
The NWK Limited external factors report provides an overview of the main external factors that NWK and its clients are exposed to at a specific point in time. This report opts to aid in a timely basis to foresee external market and other factors that may have an impact on any business and clients. The main focus of this document is to have a closer look at external factors that can affect any business and our customers.
Executive summary
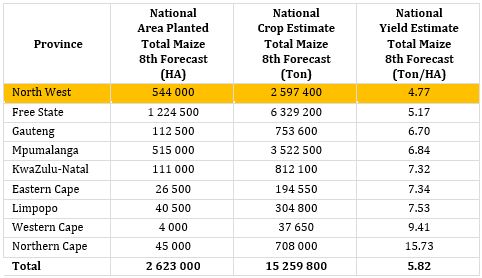
The Agribusiness Confidence Index for September (Q3), compiled by the Agricultural business chamber, presents a picture of a sector that is still on solid footing. The National Agricultural Marketing Council (NAMC) projected the ending stock for 30 April 2023 of white maize to be less than the 2021/2022 season. According to the eighth maize forecast the three main maize producing areas, namely the Free State, Mpumalanga and North West are expected to produce 82% of the 2022/2023 crop.
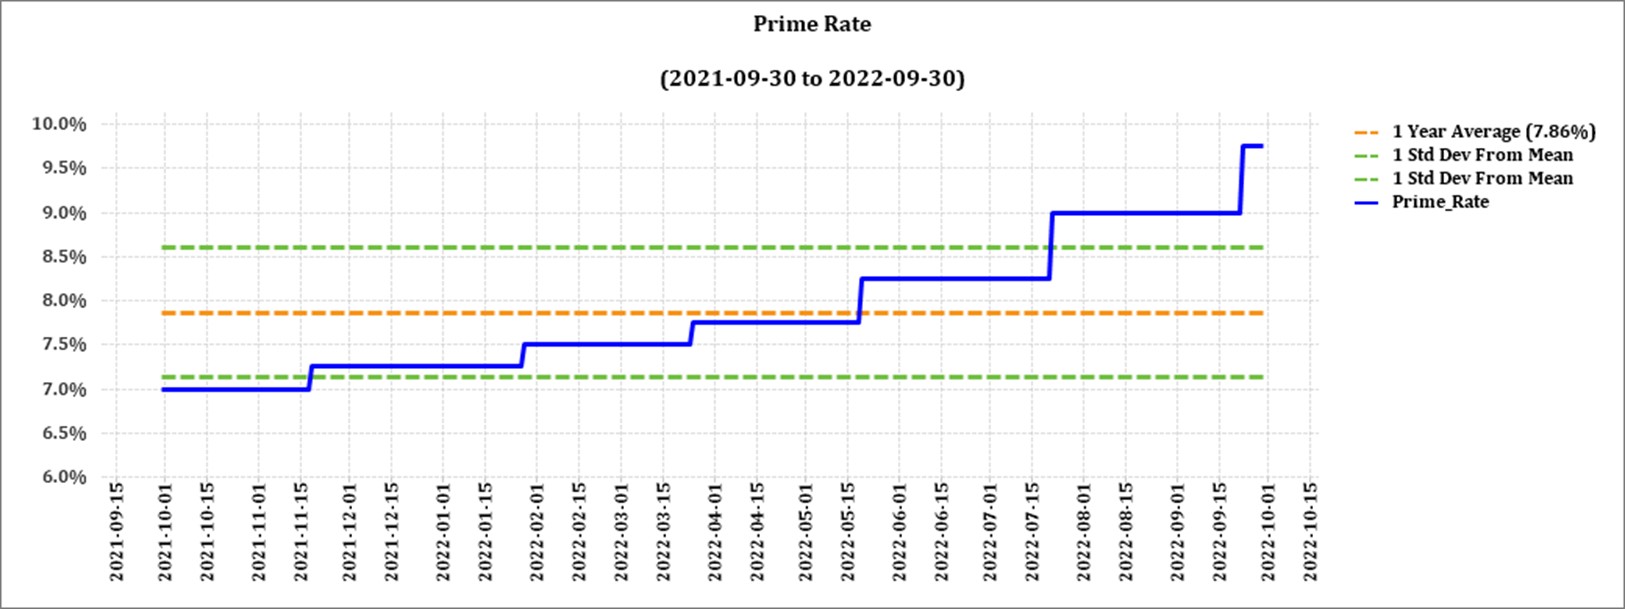
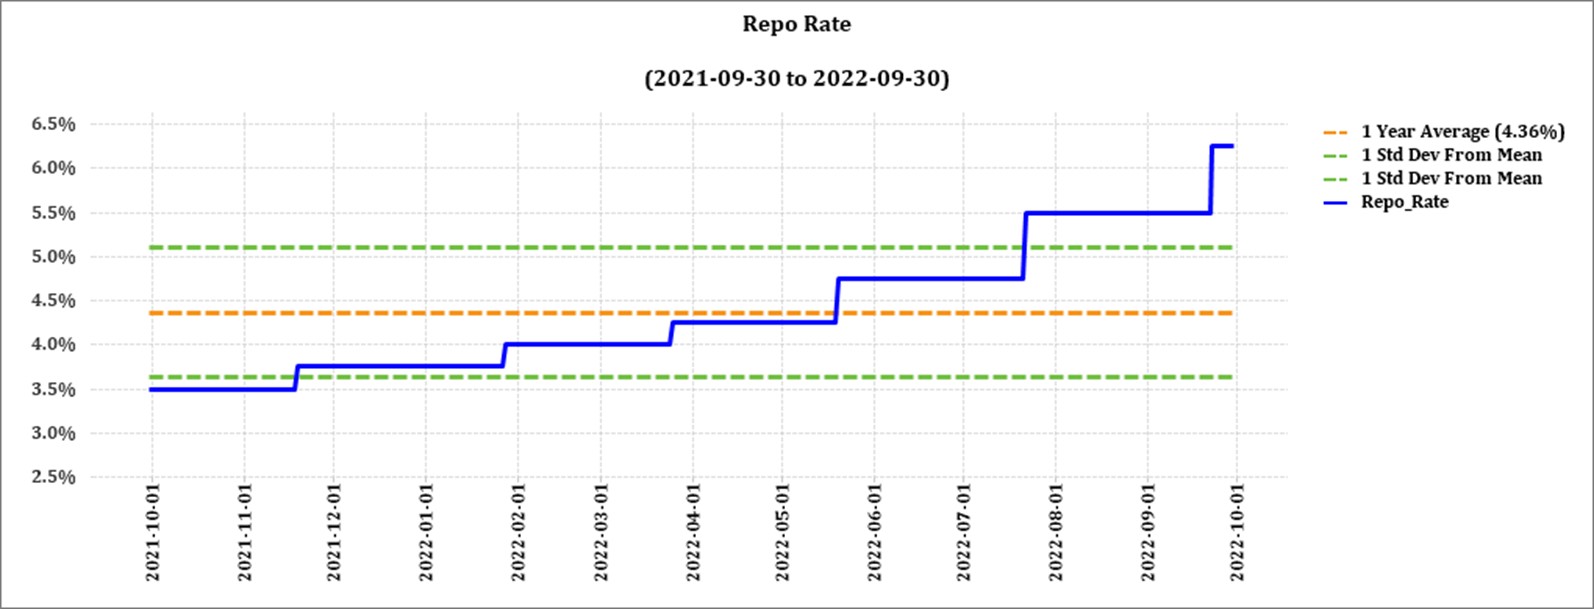
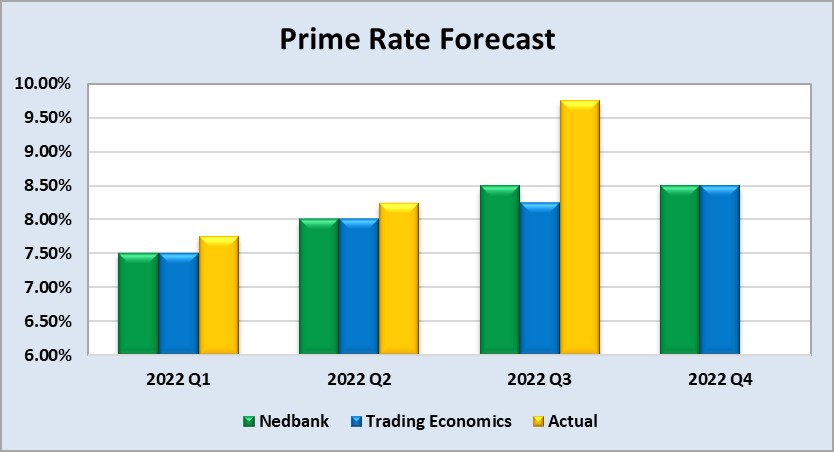
The latest increase of 75 basis points (bps) came into effect on 23 September. The repo rate is currently 6,25% and the prime rate is 9,75%.
The Russia-Ukraine conflict has a big impact on the global economy as these two countries are rich in minerals and key role-players in the export of oil, natural gasses, sunflower oil, palladium and fertiliser materials amongst others. With exports influenced the increasing demand for these resources cause prices to rise.
Load shedding poses long term risks for the agricultural sector on a supply and input cost level. When producers struggle to produce outputs, NWK is directly impacted through less silo stock income and producers’ ability to repay loans. Cost effective and sustainable alternative solutions must be considered in order to reduce the dependency on Eskom for electricity.
On Wednesday evening, 28 September, the National Assembly adopted the controversial Expropriation Bill which currently allows the expropriation of land only for public purposes and in the interest of the public, as stipulated in Section 25 of the Constitution.
Agbiz/IDC ACI moderates in Q2, 2022
Agbiz quarterly conducts a survey in order to create an Agribusiness Confidence Index (ACI). The Agbiz/IDC ACI, which was released on 19 September 2022, reflects the perceptions of at least 25 agribusiness decision-makers on the ten most important aspects influencing a business in the agricultural sector.
These ten aspects are:
- turnover;
- net operating income;
- market share;
- employment;
- capital investment;
- export volumes;
- economic growth;
- general agricultural conditions;
- debtor provision for bad debt; and
- financing cost.
These aspects are used by agribusiness executives, policymakers and economists to understand the perceptions of the agribusiness sector. It also serves as a leading indicator of the value of the agricultural output while providing a basis for agribusinesses to support their business decisions.
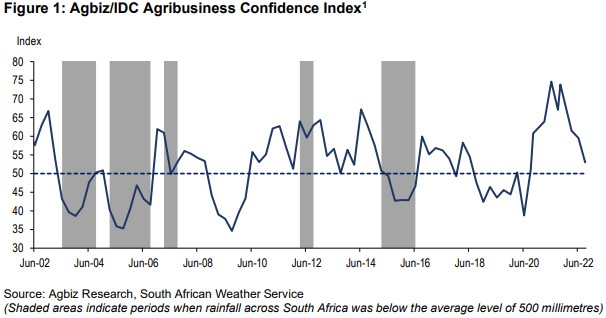
The Agbiz/IDC Agribusiness Confidence Index (ACI) deteriorated further by 7 points to 53 in the third quarter following a 2-point decline in Q2, 2022. Higher input costs, friction in some export markets, persistent animal disease challenges, rising interest rates, intensified geopolitical risks which disrupted supply chains, and ongoing weaknesses in municipal service delivery and network industries remained the key factors that survey respondents cited as the key concerns.
Still, a level of the ACI above the neutral 50-point mark implies that agribusinesses remain cautiously optimistic about operating conditions in South Africa. Therefore, Q3, 2022 results still reflect broadly favourable agricultural conditions, albeit not as strong as the previous seven quarters. This survey was conducted in the first two weeks of September 2022 and covered agribusinesses operating in all agricultural subsectors across South Africa.
The graph below shows the Agribusiness Index from 2002 to 2022.
The ACI is comprised of ten subindices, of which seven declined in the third quarter of this year. The turnover subindex lifted by 14 points to 79, while the net operating income subindex fell by 15 points to 63 points. This current turnover level is well above the long-term average, signalling that many farmers and agribusinesses continue to benefit from strong crop prices.
The employment subindex confidence increased by 4 points to 61.
The employment subindex confidence declined by 4 points to 61. This points to a potential slowdown in employment in the fields as the third quarter each year is a quiet period as harvests would typically have been finalised ahead of the start of the 2022/2023 production season in Q4.
Confidence in the capital investments subindex increased with 2 points to 71. Still, the current levels are above the long-term trends and reflective of the vibrant environment where the tractor and combine harvester sales have remained robust since the start of the year. Farmers are increasing investment in movable assets following two agricultural seasons of large harvest and higher crop prices, specifically for grains and oilseeds.
The subindex measuring the volume of exports sentiment declined by 1 point to 70. Given the market access challenges the South African citrus industry experienced in the EU, the temporary ban of wool exports to China, which had now been resolved, the temporary stoppage of livestock product exports to some markets because of the outbreak of foot-and-mouth disease and the expected decline in summer crop and wine grape harvests, a level of 70 still indicates robust export conditions.
Confidence in the general economic conditions fell by 19 points to 24. These results mirror the current environment of uncertainty triggered by recent geopolitical tensions, inflation concerns, rising interest rates, a general slowdown in the global economy, and more domestic issues such as the persistent load shedding and inefficiencies in the network industries, amongst other factors.
The general agricultural conditions subindex fell by 11 points to 42, which is the lowest level since the last quarter of 2019. The agribusiness operating in grains, finance and agrochemicals were amongst the respondents that expressed a 3-downbeat view of agricultural conditions. However, this could change in coming quarters as the weather outlook points to prospects of a weak La Niña, which could bring moderate rains in the 2022/2023 summer season.
Unlike the above seven subindices, the market share of the agribusiness’s subindex lifted by 2 points from the second quarter to 74. This optimism stemmed from the majority of the respondents, with a few that maintained an unchanged view from the previous quarter.
The subindices of the debtor provision for bad debt and financing costs are interpreted differently from the abovementioned indices. A decline is viewed as a favourable development, while an uptick signals growing financial strain. In the third quarter, the subindex for debtor provision for bad debt fell by 3 points to 39. However, the financing costs subindex increased by 7 points to 11 in the third quarter. This is still low but the increase is consistent with the current environment of rising interest rates.
In conclusion, Wandile Sihlobo, chief economist at Agbiz, said that the second-quarter results present a picture of a sector that is still on solid footing, but we still face numerous risks. “This moderation in sentiment suggests that 2022 could show contraction in South Africa’s agriculture gross-value added. Still, this does not mean the sector is in terrible shape. The base in 2021 is high and we see slightly lower harvests in some field crops this year,” says Wandile Sihlobo. “Looking ahead, the prospects of a weak La Niña provide a good foundation for an excellent rainy season. This is notwithstanding the lingering challenges of higher prices of critical farm inputs which will put pressure on farmers’ and agribusinesses’ finances when the summer crop season starts in October.” “For the long-term growth of this sector, the need to improve the efficiency of ports, electricity supply and water, quality of roads, curbing crime that devastates the rail network, and improving biosecurity should be prioritised by both government and the private sector,” added Sihlobo.
Source: www.agbiz.co.za, Issued by Wandile Sihlobo, chief economist: Agbiz
Weather and climate
NATIONAL ASSESSMENT
Winter grain conditions in the Summer Rainfall Area are favourable although there is still a frost risk, especially in the Lower Orange River areas. However, the probability for extreme cold events and frost is rapidly decreasing.
The fire season is now in progress with increased windy and hotter conditions. With rain still absent until at least the end of October, the rest of September and October can see a very high fire risk.
Storage dams in the Summer Rainfall Area are still at very high levels which is positive.
The long-term rainfall outlooks for:
- Summer rainfall areas are for below-average rainfall until about October, followed by above-average rainfall from about November 2022 to January 2023 (impact of both La Niña and the Indian Ocean.
- Winter rainfall areas will be about average until October with sporadic dry spells.
La Niña is favoured to continue through Northern Hemisphere winter 2022-2023, with a 91% chance in September to November, decreasing to a 54% chance in January-March 2023.
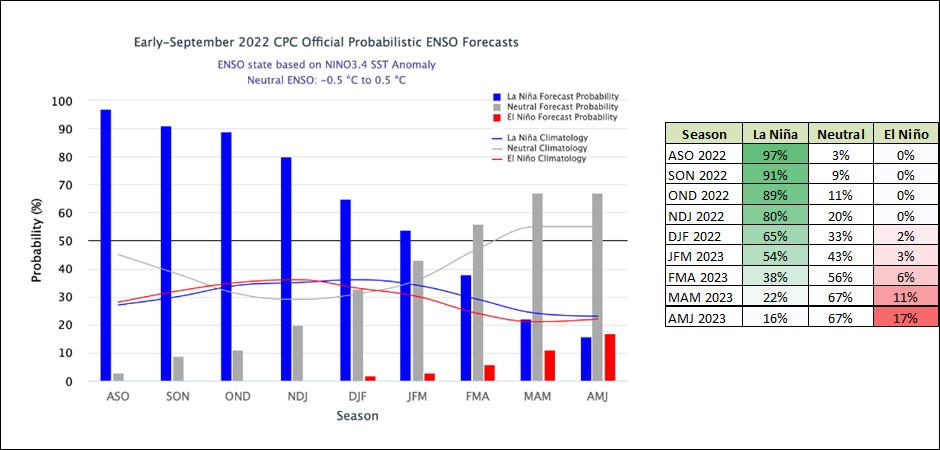
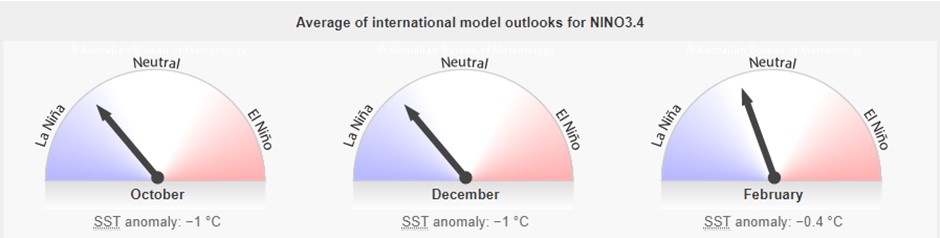
The majority of models indicate this event will peak in the spring, with a return to ENSO-neutral in early 2023. This is earlier than normal as most ENSO events peak in late summer and decay in autumn. Neutral ENSO SSTs are between -0,5°C and 0,5°C. The current SSTs for October to February range from -1°C to -0,4°C.
While back-to-back La Niña events are not uncommon and have occurred in approximately half of all past events since 1900, three in a row is less common and has only occurred three times since 1900: 1954 – 1957, 1973 – 1976, and 1998 – 2001.
Despite the end of the 2021 – 2022 La Niña, the Bureau’s long-range climate outlook remains wetter than average for most of Australia, reflecting a range of climate drivers including a developing negative Indian Ocean Dipole, and warmer than average waters around Australia. South Africa is situated far from the Pacific Ocean where most of these analyses take place, but it is also situated in the southern hemisphere which is why Australia is used as a benchmark.
Source: http://www.bom.gov.au/climate/enso/#tabs=Pacific-Ocean&pacific=Sea-surface
In summary, most of the indicators favour a La Niña season with above-average rainfall predicted for the rest of 2022. Good rainfall is pivotal for agriculture, but correct timing is of the essence. Late rainfall earlier this year had a negative impact on the production season as too wet conditions hindered farmers from getting into their land in time to harvest. The wet conditions also caused a lower grade of grain to be produced. Sclerotinia flourishes in cold and wet conditions and as a result, sclerotinia infects sunflower crops causing major damage. Therefore, good rainfall is welcomed, but the timing is of the utmost importance.
Market risk
GRAIN MARKET ANALYSIS
• Ending stock – national
Ending stock data is gathered from the NAMC. The estimates are reassessed and reported by the Grain and Oilseeds Supply and Demand Estimates Committee. The following is a summary of the April 2023 projected final ending stock for the 2022/2023 season in tonnages:
- White maize => 1 258 899 t
- Yellow maize => 891 872 t
The following is a summary of September 2022 ending stock estimates for the 2021/2022 season:
- Wheat => 378 479 t
The following is a summary of February 2023 estimated ending stock for the 2022/23 season:
- Sunflower => 59 290 t
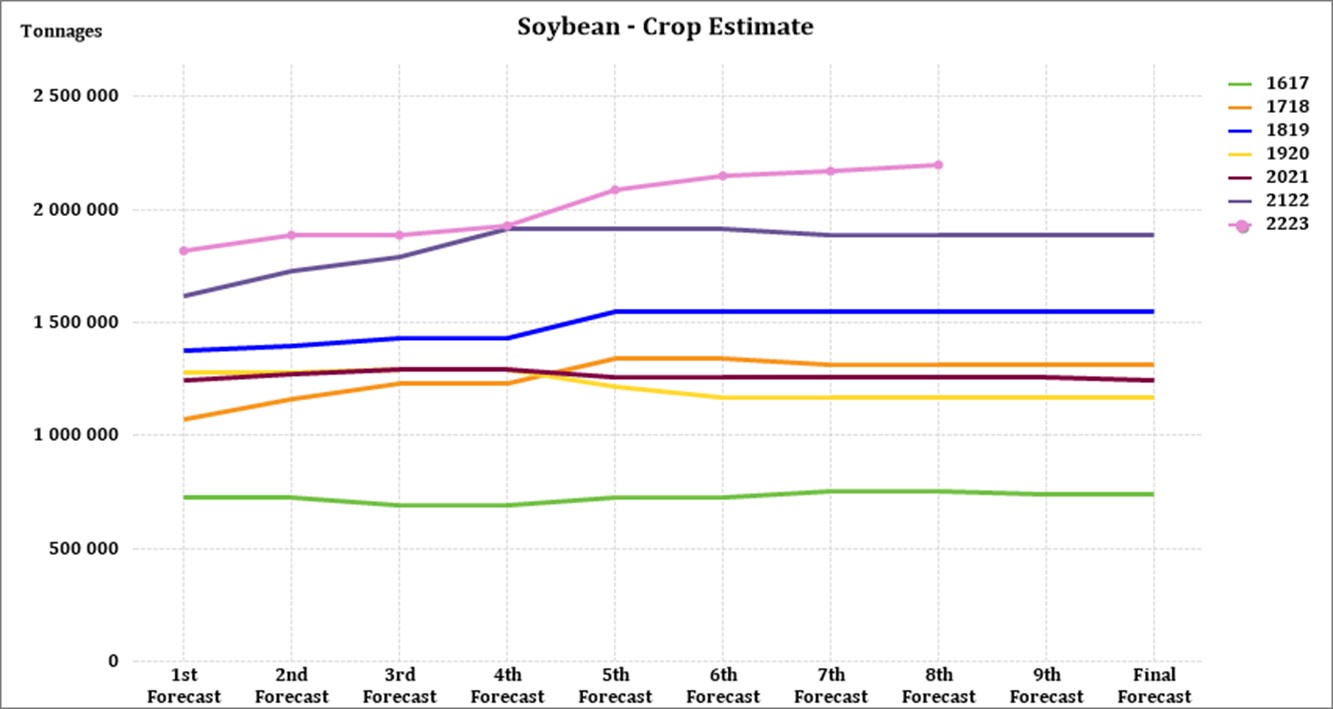
- Soybeans => 339 487 t
- Sorghum => 73 302 t
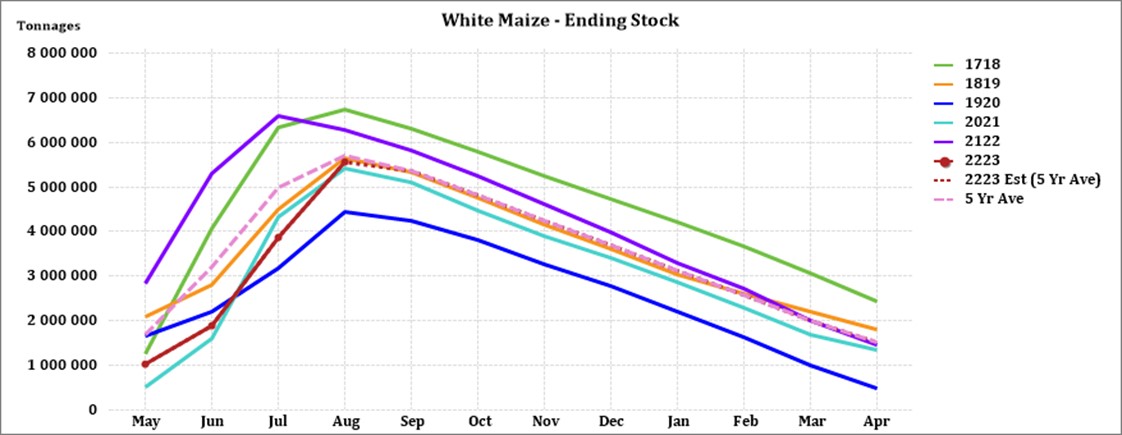
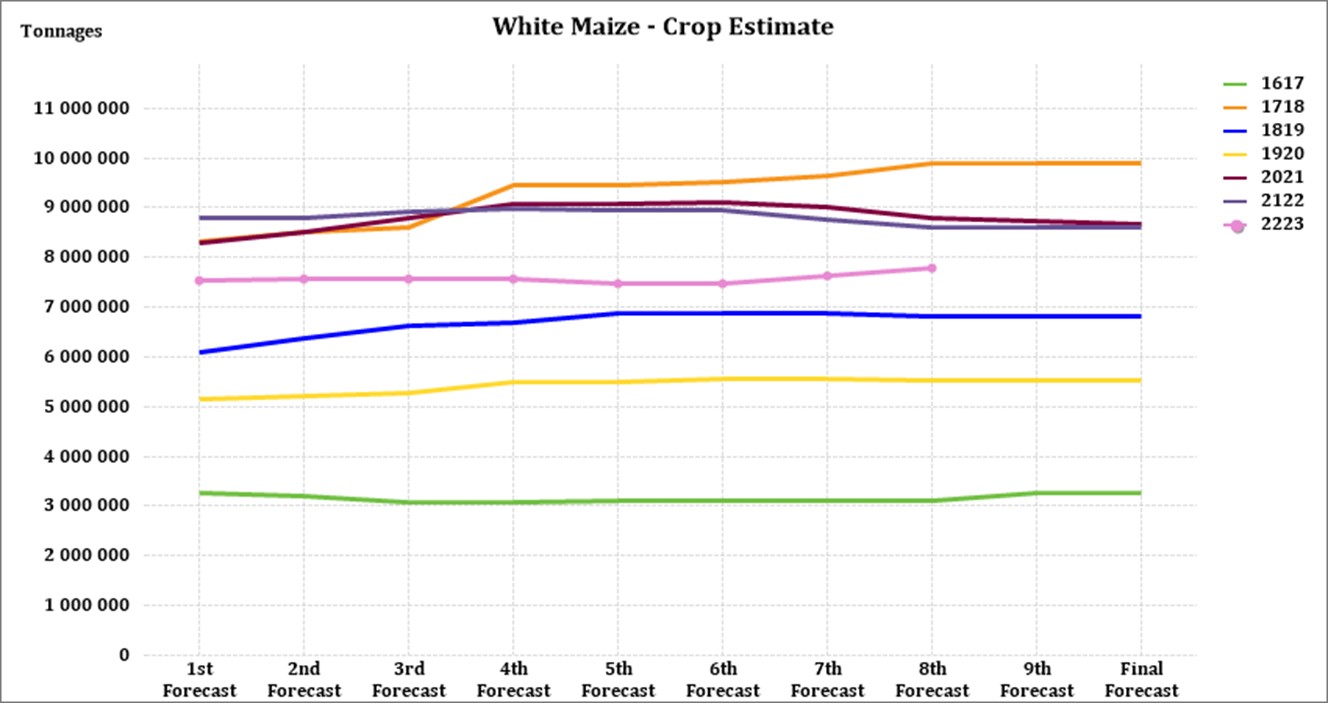
The graph below shows the estimated ending stock (based on a five-year average) for white maize in April 2023, which is 38 884 tons more than the 2021/2022 season.
Source: Sagis
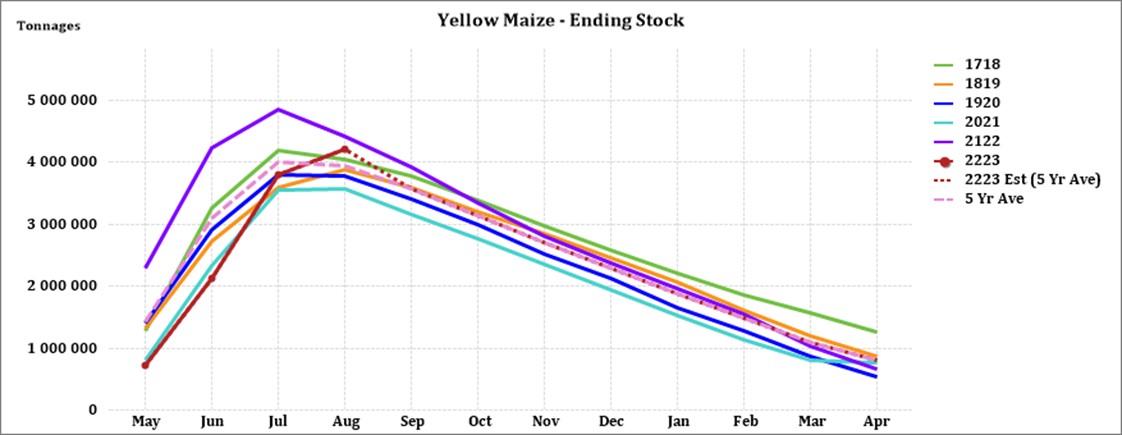
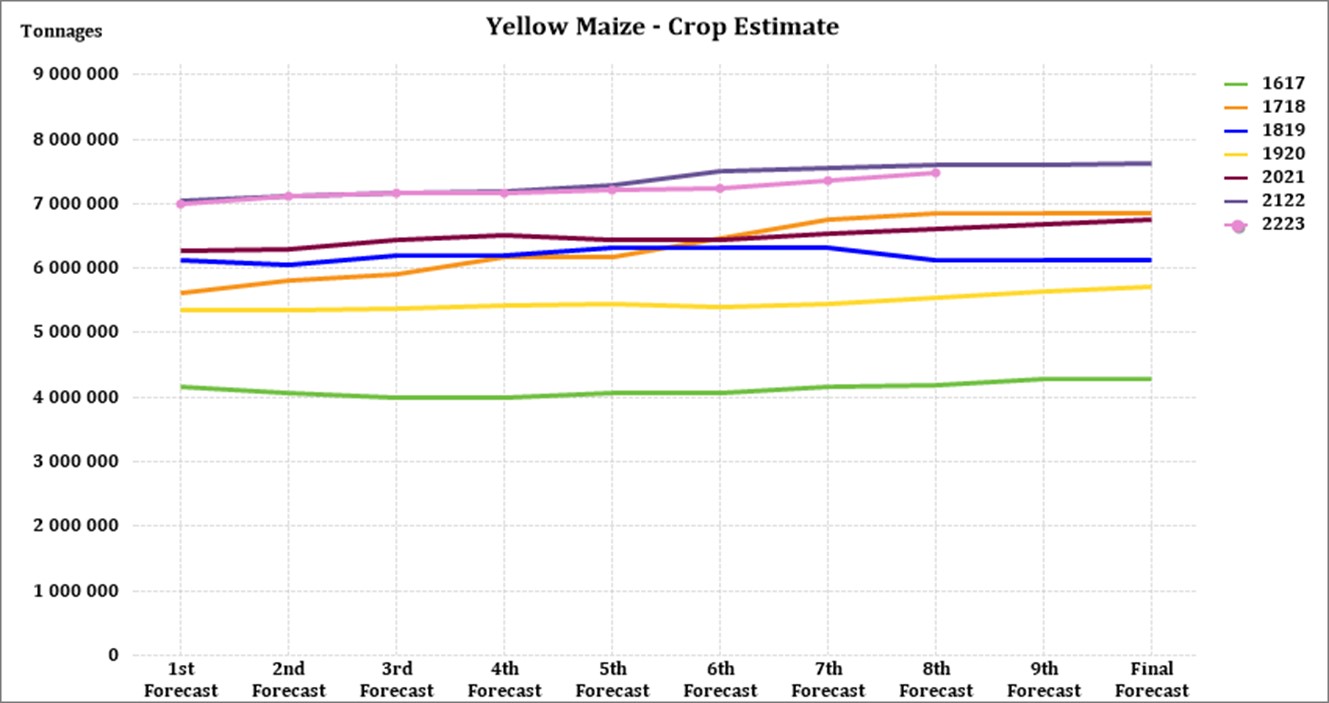
Yellow maize shows an estimated 155 755 tons increase in ending stock compared to the previous season – see graph below.
Source: Sagis
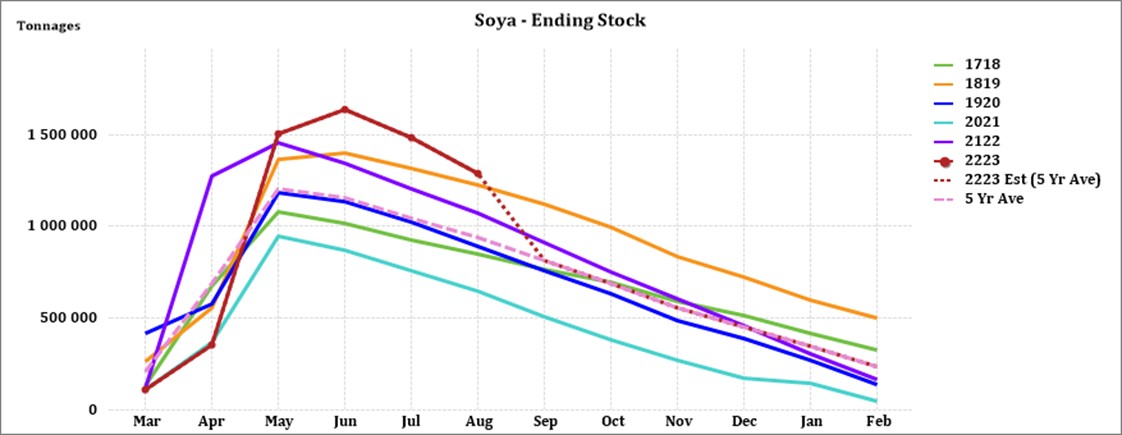
The estimated soya ending stock for February 2023 is 68 747 tons more than February 2022.
Source: Sagis
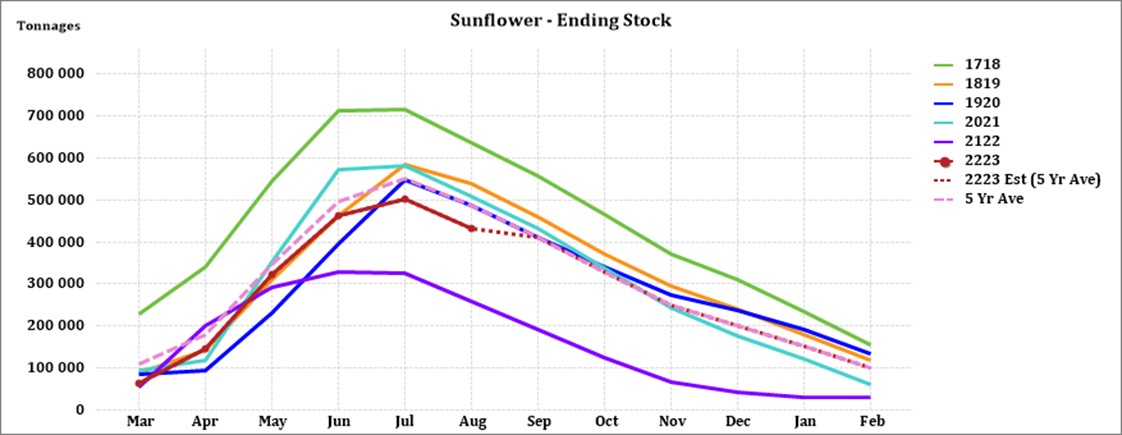
The estimated sunflower ending stock is (68 827 tons) more than the previous season ending stock.
Source: Sagis
- Crop estimations
According to the Crop Estimate Committee (CEC), the preliminary area estimate for maize is 2,623 million hectares, which is 5% less than the actual 2,755 million hectares planted for the previous season.
For the eighth forecast, the preliminary area estimate for white maize is 1,575 million hectares, which represents a decrease of 7% compared to the actual 1,692 million hectares planted last season. In the case of yellow maize, the area estimate is 1,048 million hectares, which is 1,5% less than the actual 1,064 million hectares planted last season.
Source: CEC (Crop Estimates Committee)
Source: CEC (Crop Estimates Committee)
Source: CEC (Crop Estimates Committee)
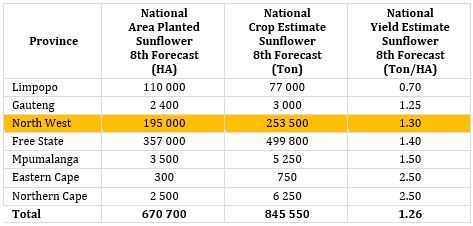
The preliminary area estimate for sunflower seed is 670 700 ha, which is 40% more than the 477 800 ha planted the previous season.
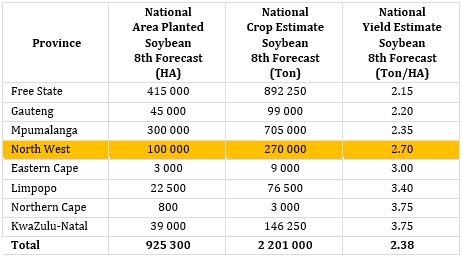
It is estimated that 925 300 ha have been planted to soybeans, which represents an increase of 12% compared to the actual 827 100 ha planted last season. This is the highest soybean area planted in the history of South Africa.
Source: CEC (Crop Estimates Committee)
Source: CEC (Crop Estimates Committee)
Source: CEC (Crop Estimates Committee)
Source: CEC (Crop Estimates Committee)
- Imports and exports – national
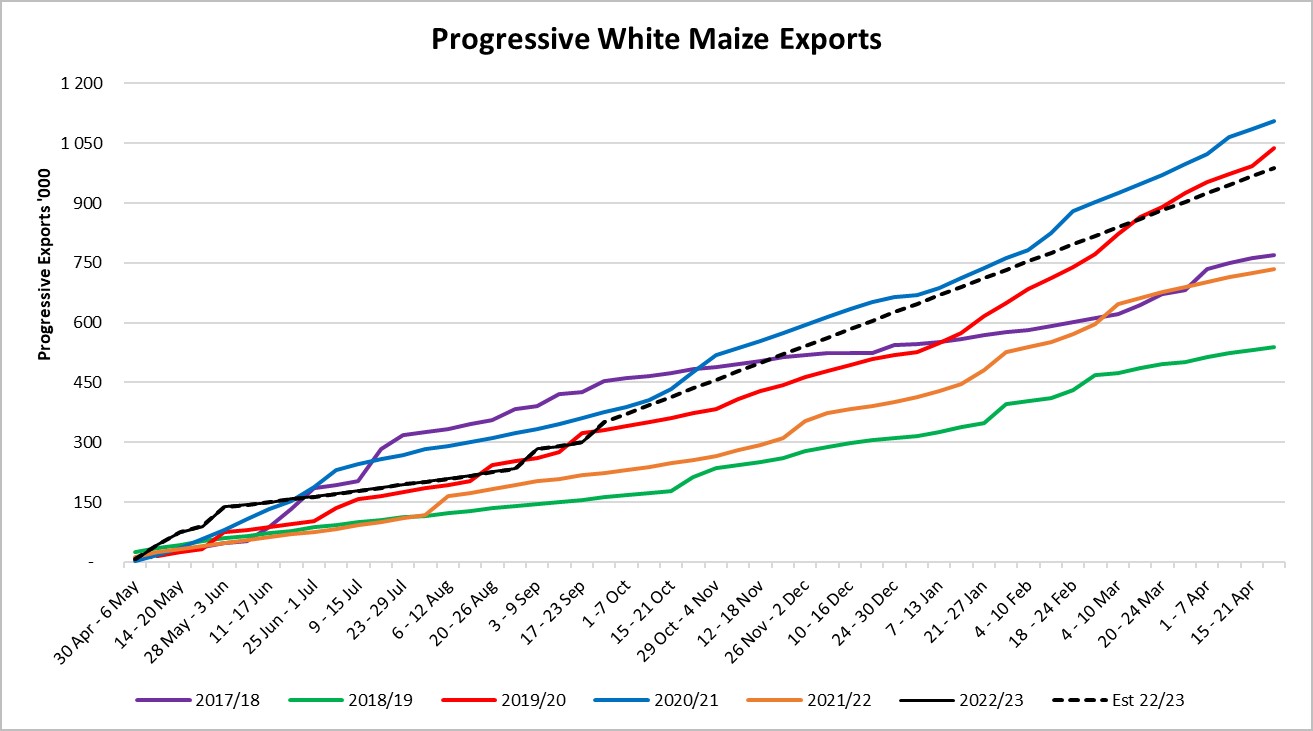
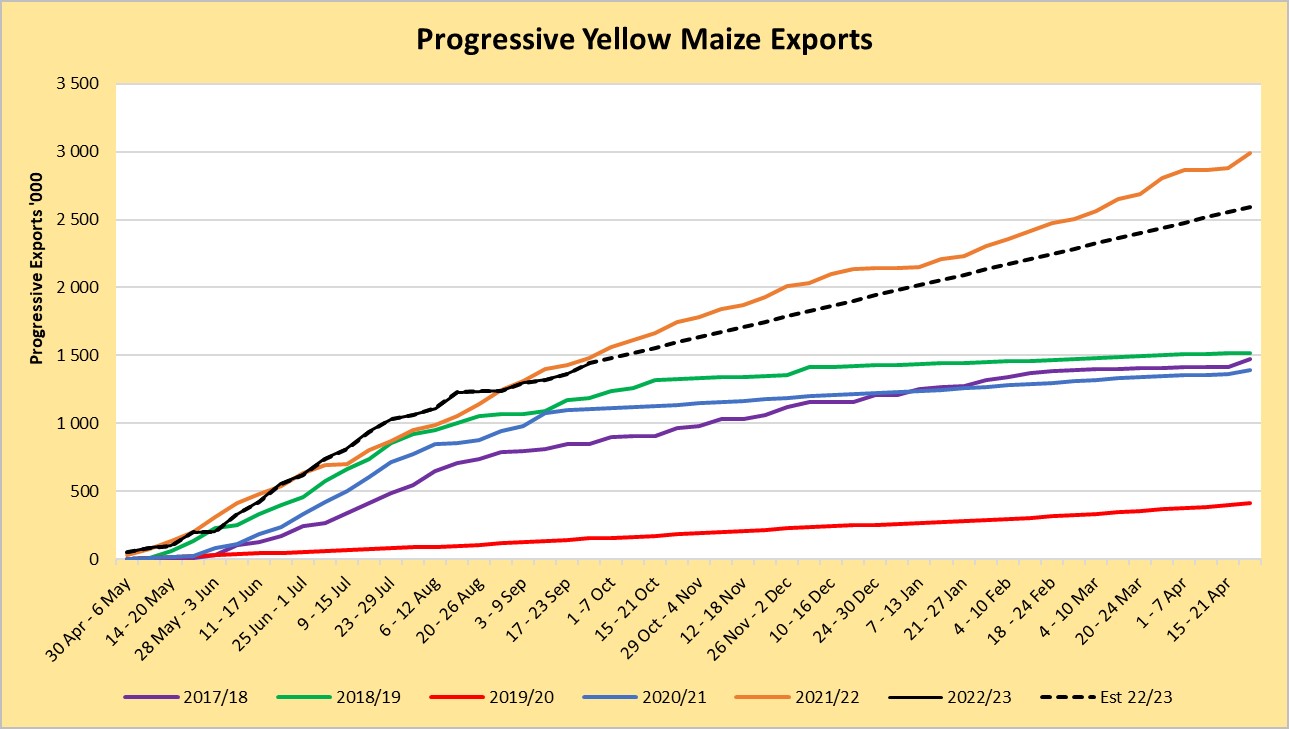
For the production season ending April 2023, 349 755 tons of white maize and 1 442 729 tons of yellow maize have been exported to date as seen on the graphs below. In the previous season a record number of 2 991 129 tons yellow maize was exported. This was mainly due to South Africa’s competitive export parity prices compared to the rest of the world.
Source: Sagis
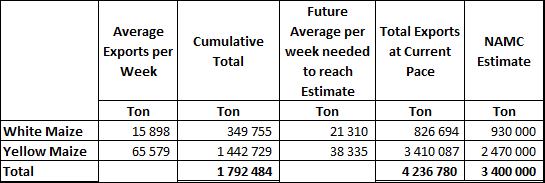
As seen in the table above, the average white maize exports per week are currently 15 898 tons. If theoretically, white maize exports remain at the current average per week then there would be 103 306 tons less white maize exports than anticipated.
The average yellow maize exports per week are currently 65 579t. If theoretically, yellow maize exports remain at the current average per week then there would be 940 087t more yellow maize exports than anticipated.
The average yellow maize exports per week is currently 65 579 tons. If theoretically, yellow maize exports remain at the current average per week then there would be 940 087 tons more yellow maize exports than anticipated.
Source: Sagis
- Parity prices
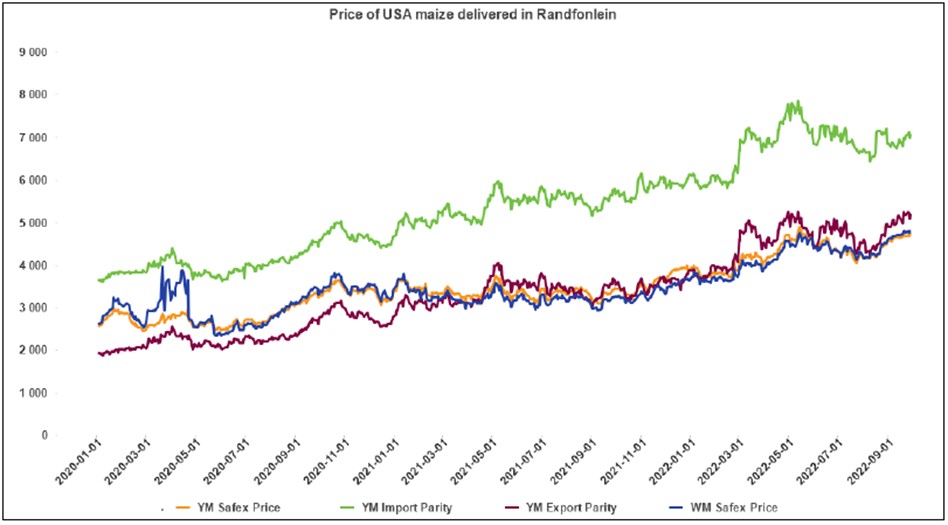
South Africa is a small producer compared to other countries and is thus a price taker (meaning that we cannot influence world prices). Because of this, our local prices are normally between import and export parity, which is illustrated in the graph below. An import parity price is defined as the price which a buyer will pay to buy the product on the world market. This price will include all the costs incurred to get the product delivered to the buyer’s destination.
An export parity price is defined as the price that a local seller could receive by selling his product on the world market e.g., excluding the export costs. The price which the seller obtains is based on the condition that he delivers the product at the nearest export point (usually a harbour) at his own expense.
The graph below reflects the Safex price, import parity and export parity of yellow maize as well as the Safex price of white maize. The import and export parity prices for white maize are not released by Grain SA for this period.
Source: Grain SA
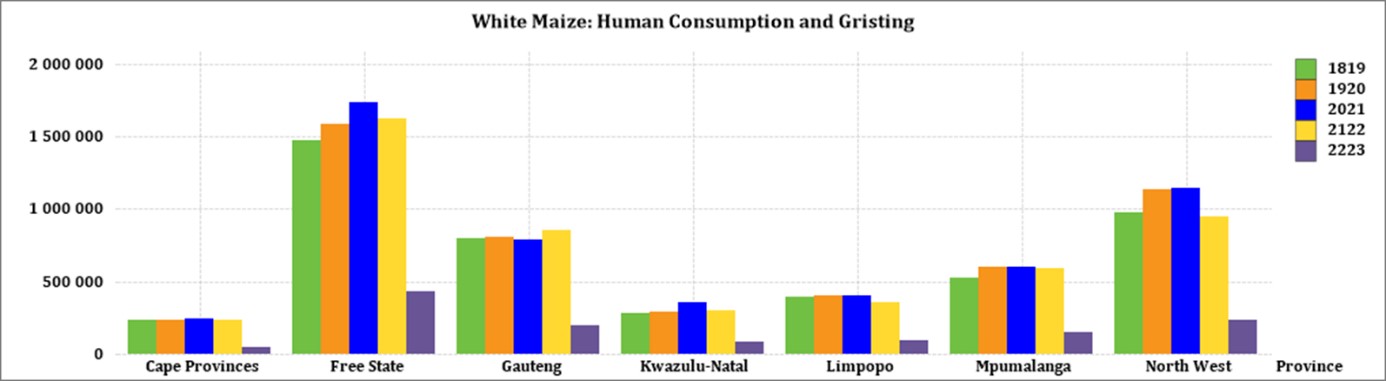
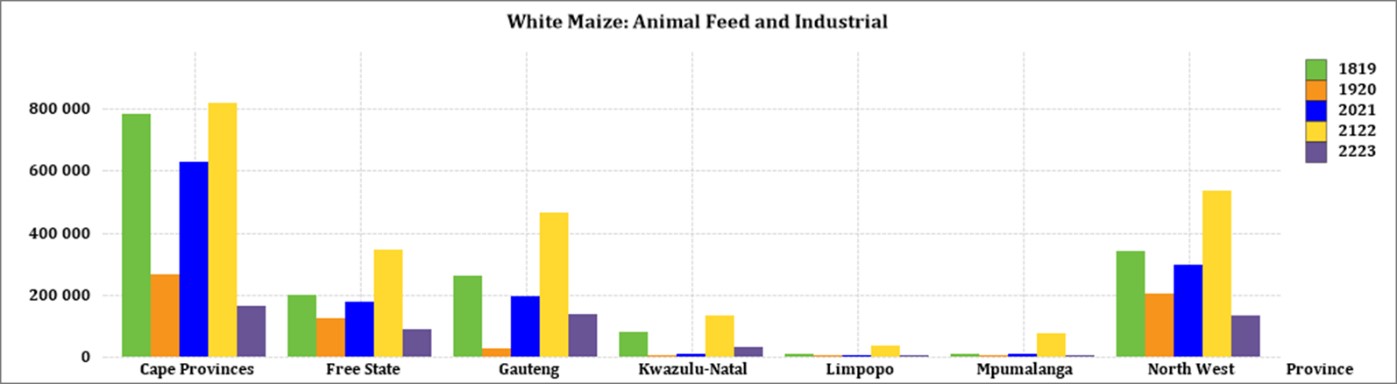
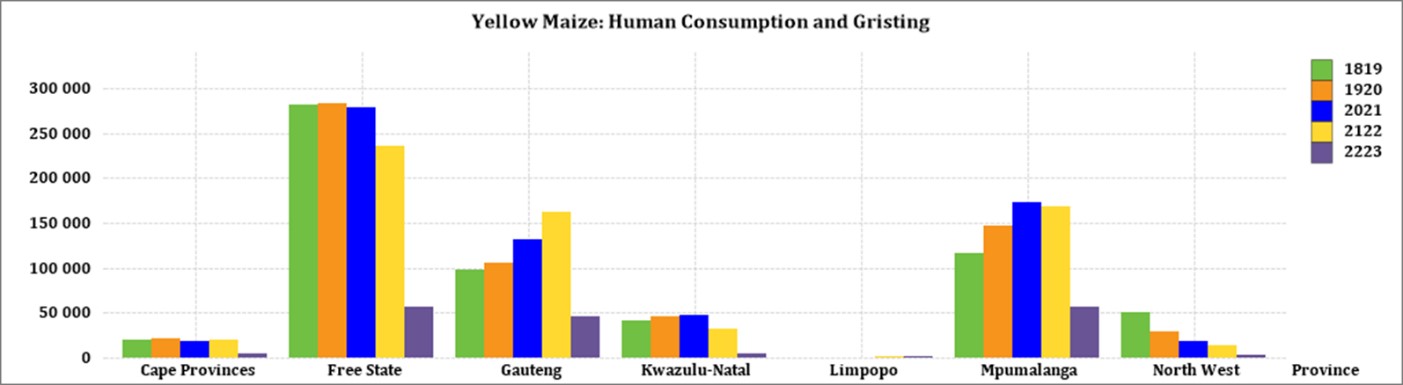
- Producer deliveries – provincial
For the marketing year which is May to April the Free State dominates the white maize which is used for human consumption and gristing. The graph below shows that North West showed a significant increase for the 2020/2021 season with 1% compared to the previous season, but for the 2021/2022 season it decreased again with 17%.
Source: Sagis
The Cape provinces uses the most white maize for animal feed and industrial usage.
Source: Sagis
North West has a decreasing trend in yellow maize which is used for consumption and gristing. Only 14 450 tons of yellow maize was used in the 2021/2022 season that ended April 2022. That is 22% less than in the 2020/2021 season.
Source: Sagis
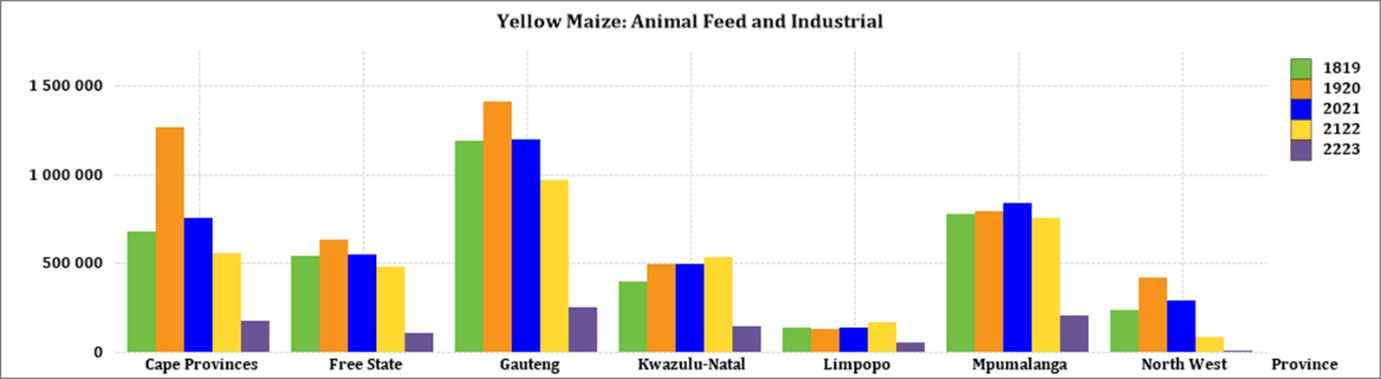
When it comes to yellow maize used for animal feed and industrial usage, Gauteng is the biggest consumer.
Source: Sagis
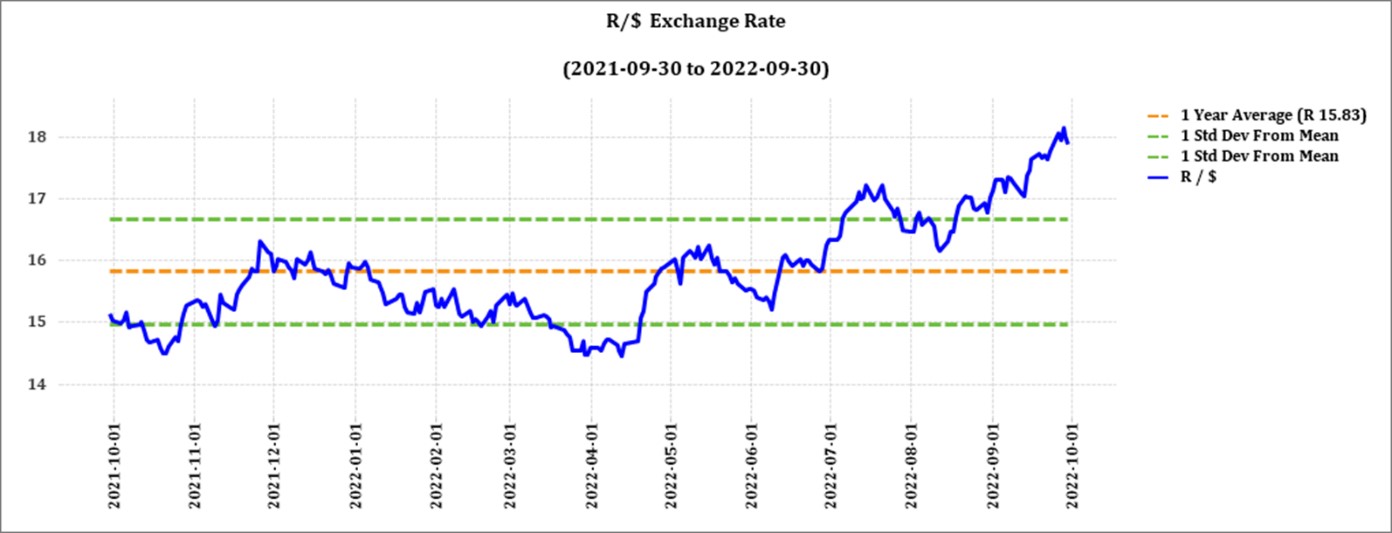
- Exchange rate
NWK Group is exposed to foreign exchange rate risk on various business areas, such as commodity prices and trade imports.
Source: Standard Bank, Corporate and Investment Banking & SARB
On a monthly average basis, the rand depreciated against the US dollar with 5,2% (R0,87) over the period August 2022 to September 2022. The one-year average for rand/US dollar is R15,83. Moreover, the average rand/US dollar exchange rate for the period August 2022 was R17,56 compared to R16,69 in August 2022. Since the middle of July the rand/US dollar exchange rate is once again higher than the first standard deviation from the mean.
Exchange rate forecast:
The graph below shows the actual USD/ZAR for 2021 Quarter 4 (Q4) and 2022 Quarter 3 (Q3) against the forecasted figures.
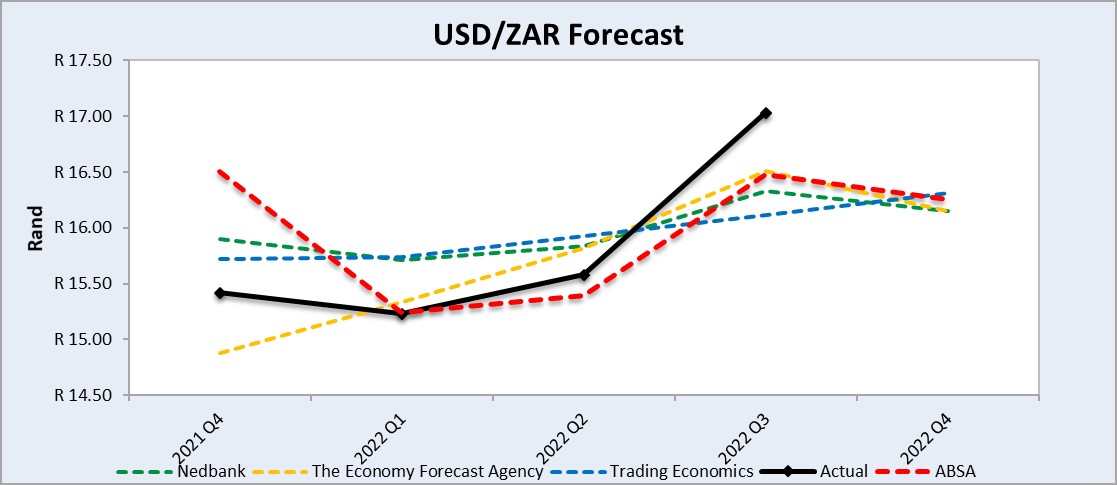
Source: Nedbank CIB; Absa; The Economic Forecast Agency; Trading Economics
INTEREST RATE RISK
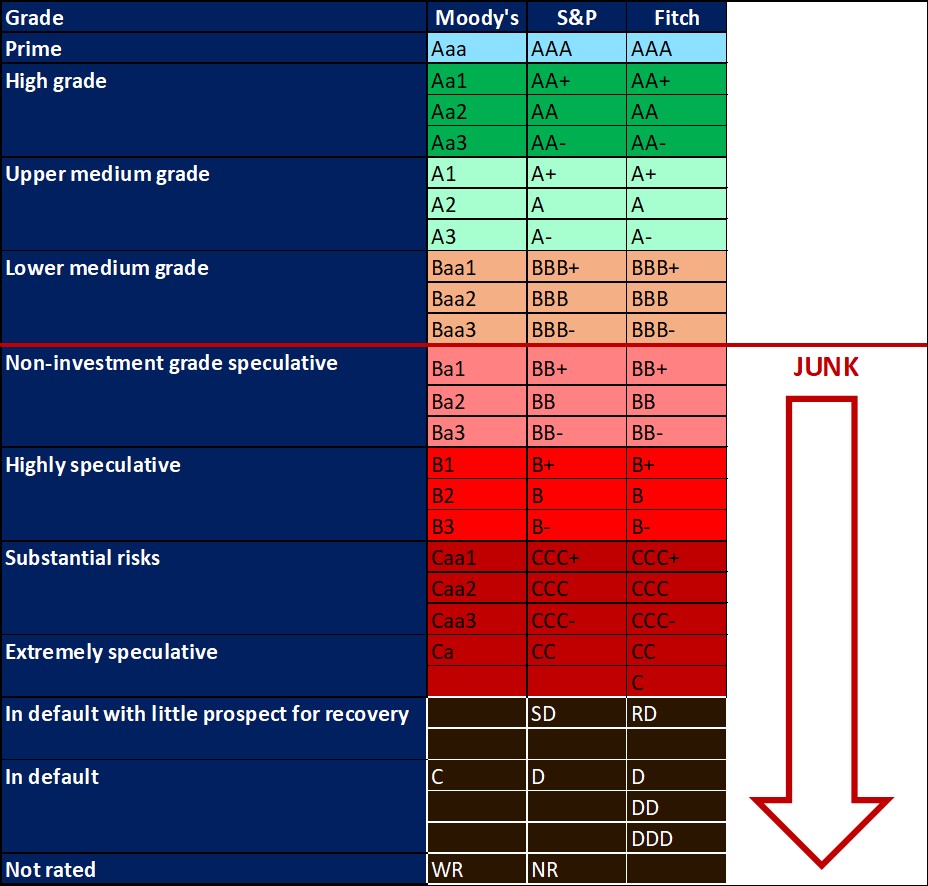
On 27 March 2020, Moody’s downgraded South Africa’s sovereign credit rating to sub-investment grade and placed a negative outlook on the rating. The key drivers for this downgrade include weak economic growth, continuous deterioration in fiscal strength, and slow progress on structural economic reforms. It is now the first time in post-apartheid South Africa where all major rating agencies, i.e., Moody’s, Fitch and S&P, have South Africa’s credit ratings in sub-investment grade territory. More than a year later and our Moody’s rating remains the same.
The latest increase of 75 basis points (bps) came into effect on 23 September. This is followed by an annual inflation rate of 7,6%. The South African Reserve Bank made several interest rate cuts amounting to 300 bps to bring relief to the economy, but as of November 2021 the prime interest rate experienced six increases amounting to a total of 275 bps. The repo rate is currently 6,25% and the prime rate is 9,75%.
Professor Raymond Parsons is of the opinion that dearer money will impact negatively on borrowing costs for both consumers and business at a time when the economy is struggling to maintain momentum. The SARB may be too optimistic about the future growth outlook – and that downside risks to growth may well in any event have risen. The combination of the latest persistent Eskom black-outs, cumulatively higher borrowing costs and an uncertain world economy now require SA to set its 2023 GDP growth expectations at only about 1,4% in 2023, in line with the SARB’s own current forecast.
The next MPC meeting date is 24 November 2022.
Interest rate movement:
- 18 November 2021: 7,25%
- 27 January 2022: 7,50%
- 24 March 2022: 7,75%
- 19 May 2022: 8,25%
- 21 July 2022: 9,00%
- 22 September 2022: 9,75%;
The following graph shows the prime rate forecast for 2022 Quarter 1 to 2022 Quarter 4. Both Q1, Q2 and Q3 experienced higher interest rates than anticipated by Nedbank and Trading Economics.
(CPI) Consumer Price Index
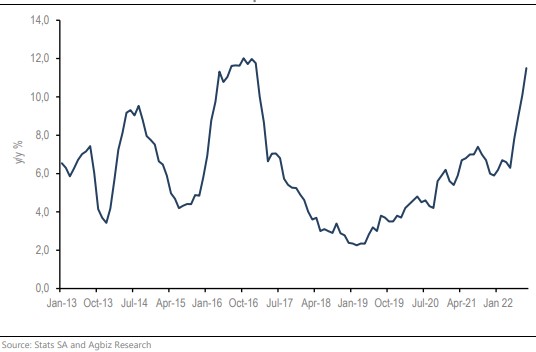
The data released by Statistics South Africa show that in August 2022, the consumer food price inflation accelerated by 11,5% y/y, from 10,1% y/y in the previous month. This is the fastest pace since January 2017. The higher global grains and oilseed prices for much of the first half of this year have been the drivers of the costs of “bread and cereals” and “oils and fats” in the consumer food price inflation basket. These are also products with a relatively higher weight within the food basket. For example, within the food basket, the key products are meat (35%); bread and cereals (21%); milk, cheese, and eggs (17%); vegetables (8%); sugar, sweets and desserts (4%); oils and fats (3%); and fruit (2%).
Overall, the global grain and oilseed prices, which have been the major drivers of the surge in inflation, are starting to soften, which shows in the global indices. The FAO’s Global Food Price Index was 138 points in August 2022, down by 2% from July and registering its fifth consecutive monthly decline led by a price drop in all products.1 These global developments are also showing in South Africa, and this could also reflect on the consumer food price inflation data in the coming months. Therefore, we continue to expect the domestic consumer food price inflation to start moderating towards the end of 2022.
The graph below shows the fluctuations from 2013 and the peak in 2017.
- Highlights in the agrochemical sector
The COVID-19 pandemic affected the production and supply of the agrochemicals market. The global pandemic has impacted the proper functioning of the international agrochemicals market. As countries are dependent on China for raw material supply, the restrictions imposed on transportation and imports across borders in various nations have resulted in shortages of raw materials. China is currently the largest glyphosate supplier in the world. The dynamics of China’s glyphosate greatly impact the global supply structure, over 80% of glyphosate produced in China is exported, to more than 20 destinations in the world.
In China, on a month-to-month basis, prices (dollar terms) of most herbicides and insecticides decreased from July 2022 to August 2022 while the prices were mixed for fungicides (some increasing and others decreasing). According to the tables in this report, glyphosate (95%) (dollar terms) decreased by 4,1% from July 2022 to August 2022 as the market demand for this product was rather weak.
From data received from various local companies, agrochemical price increases seem high, but in line with other inputs. One active ingredient to keep an eye on is glyphosate prices, which can increase at an average of 147% between respective companies. The other products could increase between 7% and 26% in the coming season.
On a month-to-month basis some of the products experienced price decreases when looking at the prices in rand.
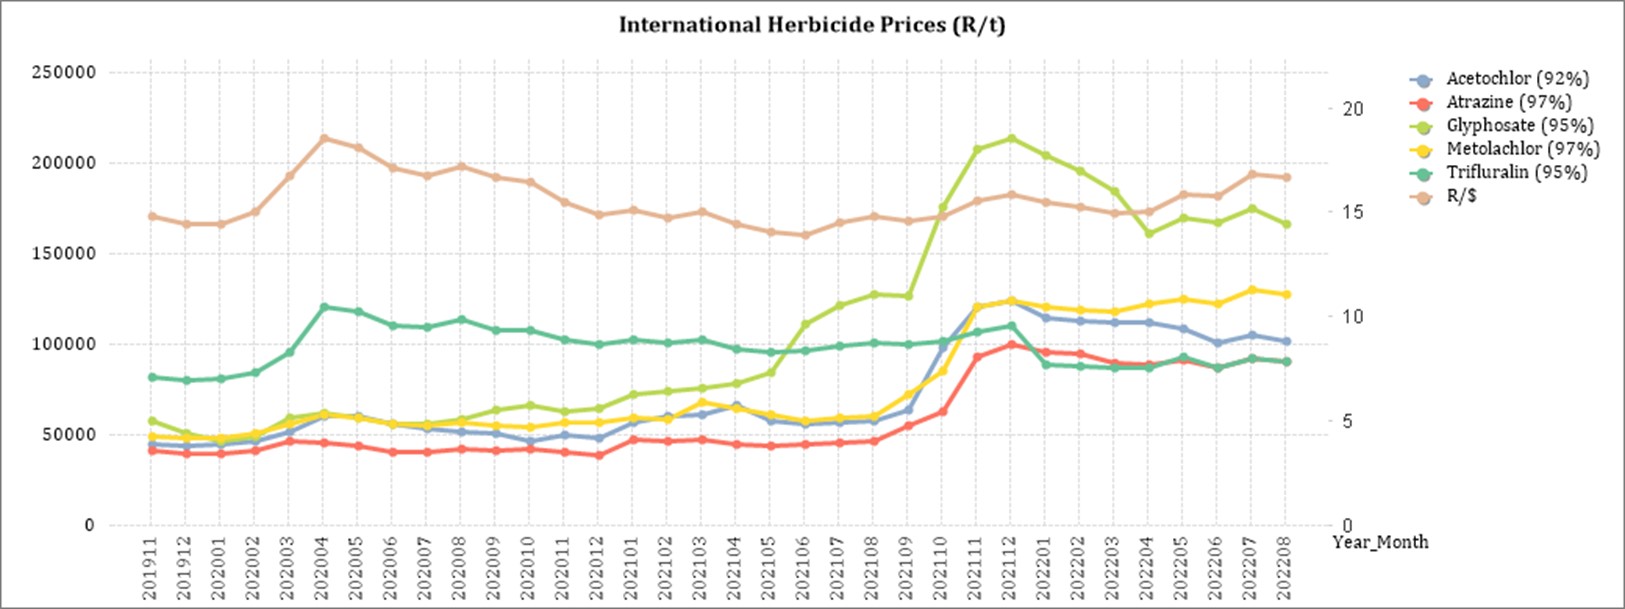
Herbicides
The following products are the main products regarding herbicides that may have an impact on input costs for producers:
- Glyphosate (95%)
- Acetochlor (92%)
- Atrazine (97%)
- Metolachlor (97%)
- Trifluralin (95%)
The following comparison is from the September 2022 Grain SA report which reports the previous month’s prices.
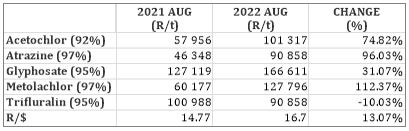
In comparison with the previous year’s prices, there was a significant increase in prices in four of the five main products. The only product that had a price decrease was Trifluralin with a decrease of -10,03%.
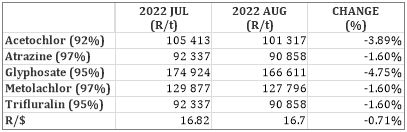
For the two months compared all five products experienced a price increase.
The graph below shows the international herbicides prices (R/t) per product from November 2019 to August 2022.
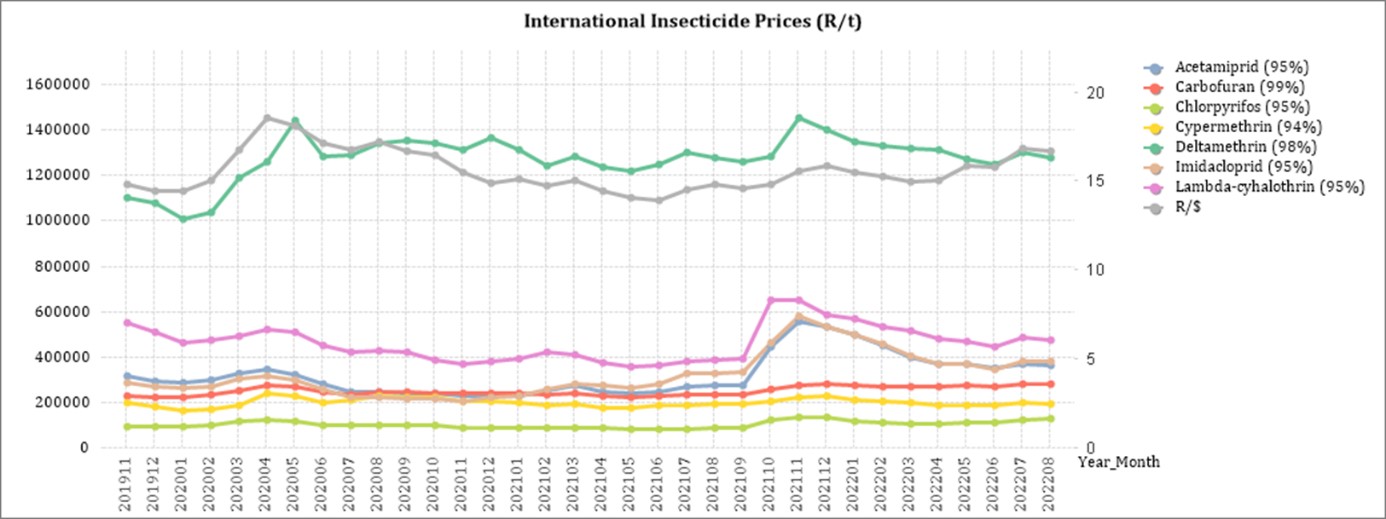
Insecticides
The following products are the main products regarding insecticides that may have an impact on input costs for producers.
Imidacloprid (95%)
Lambda-cyhalothrin (95%)
Carbofuran (99%)
Deltamethrin (98%)
Acetamiprid (95%)
Chlorpyrifos (95%)
Cypermethrin (94%)
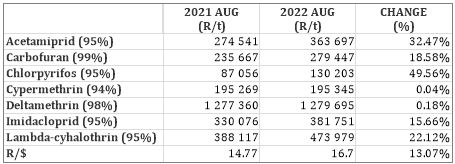
Insecticides – year to year change (R/t): In comparison with the previous year’s prices, there was a noticeable increase in prices for four of the four main products. The largest increase was Acetamiprid with an increase of 47,74%.
In comparison with the previous year’s prices, there was an increase in price for five of the main products. The largest increase was Chlorpyrifos with an increase of 49,56%.
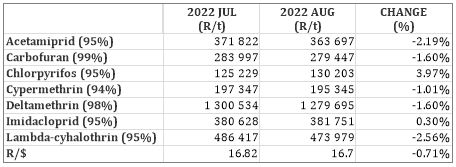
Most of the products experienced a price decrease which is positive given the high price increases experienced in July.
The graph below shows the international insecticide prices (R/t) per product from November 2019 to August 2022.
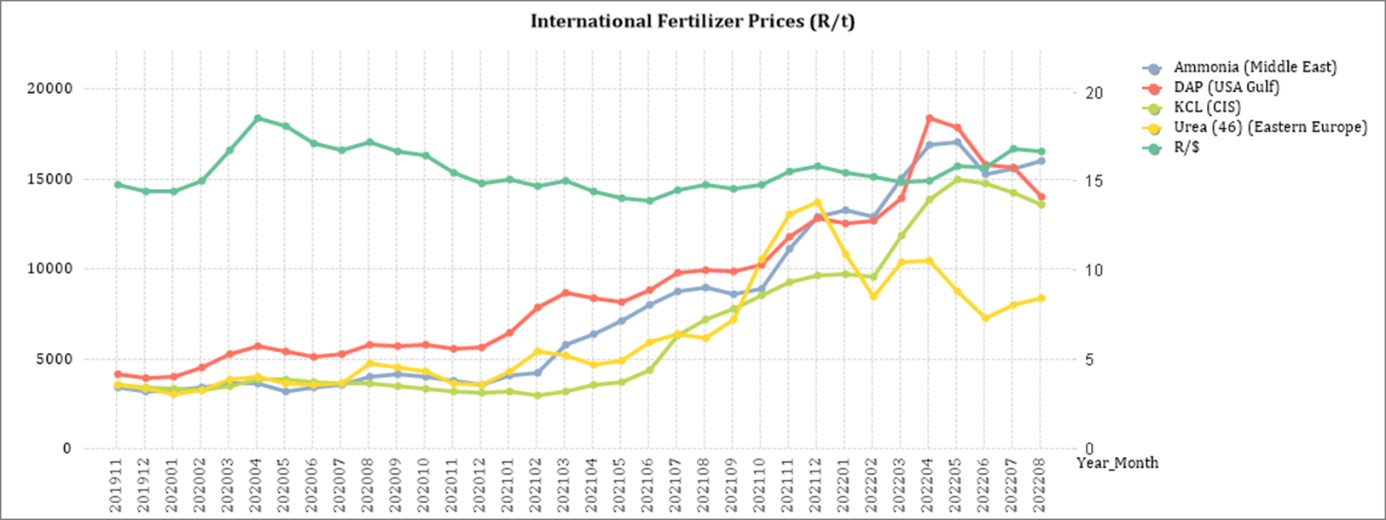
Fertiliser
The following fertiliser products are being analysed:
- Ammonia (Middle East)
- Urea (46%) (Eastern Europe)
- DAP (USA Gulf)
- KCL (CIS)
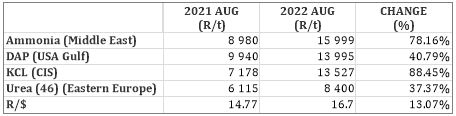
As seen in the table above all of the main fertiliser products increased from August 2021 to August 2022. The biggest increase, based on average international prices (R/t), was KCL (88,45%), followed by Ammonia (78,16%), DAP (40,79%) and Urea (3,37%).
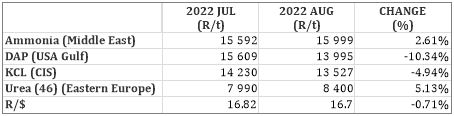
For the two months compared two products experienced a decrease and two products experienced an increase in price per ton.
The graph below shows the International Fertiliser prices (R/t) per product from November 2019 to August 2022.
Sources: Grain SA – https://www.ft.com/content/4d746aa5-29e3-4796-b9e6-0b64c6865389
Nitrogen markets saw little trading at the beginning of September. Crude oil prices decreased, and which also dragged natural gas prices down with it. An easing of natural gas prices in Europe took the urgency out of European buying. The Nord Stream 1 gas pipeline from Russia remains closed and Europe looks very short of gas supplies as it heads towards winter. The US natural gas price followed the oil trend and declined from $9/MMBtu to $8/MMBtu. European natural gas prices falling (beginning Sep) helped to cool off the panic buying of a number of European companies.
Urea market: In terms of urea imports into South Africa, July was a very busy month with more than 130,000 tons of urea coming into the country. This surge in cargoes brought the year-to-date (Jan to July) imports to almost the same level as the same period last year, 390 000 tons YTD compared to 405 000 tons Jan to July 2021. Urea prices in some major markets saw small reductions at a local level – Brazil’s prices drop due to very slow trading.
Ammonium nitrate market (AN): The ammonia market saw limited activity with European capacity down, the market is however seen as being firm with respect to price over the next month or so.
Phosphates: Outlook for phosphate prices is negative due to weak demand in most regions. Phosphate prices decreased in most major markets as the current high price levels discourages demand. An indicator of the extent of demand destruction is the challenge the Chinese are having in selling any of their 1,1 million ton phosphate export quota for Q4. Similarly, OCP in Morocco has seen a 14% drop in export sales YTD, while adding 1 million tons of capacity this year – this against a backdrop of the market expecting severe availability issues after the Russian sanctions.
It is clear that substantial price reductions are needed to stimulate demand. The outlook for MAP prices is quite bearish and the market expects prices to continue the current downward trend for the remainder of the year, even with Chinese exports being absent and high gas prices in Europe.
Potash: Not only did local potash prices decreased from August to September but international potash prices also keep on falling. Potash prices slowly continued on their downward trend mainly due to weak demand and increasing availability from Russia which influences prices. The outlook for potash is still bearish, analysts indicate that potash prices could continue to drop from the current low -$800s to the low -$600s by the end of Q1 2023. Early indications are that sales have picked up and the recent price cuts stimulated buying interest.
Source: https://www.grainsa.co.za/upload/report_files/Chemical-and-Fertilizer-Report_Sep-2022.pdf
- Economic impact of the Russia-Ukraine war
Impact on the broader economy
Despite South Africa’s special role with Russia via the BRICs (Brazil, Russia, India, China, and South Africa) grouping of middle-income countries, the South African government took a stronger stance, calling for Russia to withdraw its forces.
The invasion of Ukraine by Russia has a ripple effect on the world economy. Various countries will feel the short- and long-term effects of this war. Not all is however negative as a few possibilities arise in the short term.
For one, Ukraine is the biggest exporter of sunflower oil followed by Russia. Russia also ranks first in the world for holding 24% of the world’s total natural gas reserves. Europe receives 30% to 40% of its total gas from Russia and it is going to be difficult to wean itself from Russia to loosen Vladimir Putin’s grip on European countries. Evidentially the price of sunflower oil and natural gasses increased as exports from Russia and Ukraine are backed-up. Brent crude oil recently reached $130 per barrel and analysts predict even further increases. European natural gas also jumped 62%. Despite this several other countries who are also suppliers of sunflower oil and natural gasses may benefit from this war as countries will have to look elsewhere for their usual imported resources.
International sanctions placed on Russia could place a growing demand on palladium as Russia is the world’s biggest producer of palladium with South Africa second. Palladium is a critical component in the manufacturing of automobiles and electronics. Similarly, Russia and South Africa are major exporters of gold and the South African rand has been strengthening as a result of rising global prices for the precious metal.
Despite these possibilities the attack on Ukraine could pose hardships for households, the agricultural sector and food security. The rising price of oil is causing fuel prices to increase and consequently lead to transport being a luxury.
Sources:
Business Tech
https://www.cars.co.za/motoring-news/sa-fuel-prices-slashed-for-september-2022/132807/
https://businesstech.co.za/news/energy/622549/here-is-the-official-petrol-price-for-september-3/
Impact of load shedding on the agricultural sector
The reality is that load shedding will continue for years to come and the negative impact on the economy is severe.
The table below indicates the GDP lost per hour per sector due to load shedding:
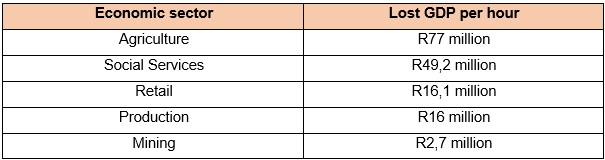
From this table it is clear that the agricultural sector loses the most GDP per hour.
Modern farming businesses have become extremely dependent on electricity to run their irrigation, cooling, pumping stations, and mechanization. producers may need to find alternative power sources. These sources, while reliable, come at a cost. With increasing fuel costs as a result of the Russian-Ukrainian war and the big fuel consumption nature of generators, investing in a generator as a power source may not be a sustainable solution – especially for small-scale producers who are sensitive to increasing variable costs. When producers fail to find alternative sources, they take the risk of forfeiting water quotas for irrigating purposes which can cause the business to go under.
Machinery and equipment are damaged and repairment comes to a standstill as a result of power outages. producers may be forced to work after hours when there is electricity, leading to increased expenditure on overtime wages and increasing production costs. Some producers may not be able to afford this, given that production costs such as fertilizer and fuel have already increased a lot over the last few months.
When producers struggle, the agricultural sector is bound to feel the impact. A decline in production poses the biggest threat to the sector as it is, among other things, reliant on stock made available by producers. In summary, no yield means no stock in the silos and no income from millers. Not to mention the transport income, income from premiums received on commodities sold and the loss of sales in retail stores due to less expenditure by producers.
The producers’ production has a direct impact on their ability to repay loans. With increasing inflation and higher interest rates in South Africa, the repayment capacity of loans decreases and are less likely. Thus when the producer makes a loss, NWK is directly impacted.
Decreased economic growth possible implications:
- Decreased foreign investment.
- Decreased sales – grain and retail.
- Increased operation cost (generator fuel cost).
- Decreased income from mechanisation.
- Weakening infrastructure.
- Inflation leads to higher input costs.
- Fluctuating and volatile markets.
- Decreased productivity and efficiency.
- Damage to electronic devices as power goes on and off.
- Increased theft.
- Overall increased risk and uncertainty.
Expropriation bill
On Wednesday evening, 28 September, the National Assembly adopted the controversial Expropriation Bill which currently allows the expropriation of land only for public purposes and in the interest of the public, as stipulated in Section 25 of the Constitution.
While Section 25(3) requires the amount of compensation for land to be “just and equitable” the bill makes it possible for expropriation of land with “nil compensation” under specific circumstances. These circumstances include abandoned land, state land, or land held for speculative purposes.
However, the DA, EFF, IFP, FF Plus and ACDP objected to the bill each for different reasons.
Patricia de Lille, public works and infrastructure minister, has tried to assure South Africans that the government has no intention of using the bill to “arbitrarily” seize land from private owners. She said that talk of land grabs and seizures of private property amounted to fear-mongering.
The bill will now go to the National Council of Provinces for commencement, after which it will head to the desk of the president to be signed into law.
Summary
According to Christo van der Rheede, Agri SA’s executive director, load shedding also poses a risk for food security and social stability.
In response to this energy crisis, Solidarity has appealed to everyone who is able to generate electricity on small scale to apply for power generating permits in an attempt to solve the electricity crisis. Regulations have been amended and up to 100 MW can be generated with a permit. However, a license is required when generating more than 100 MW.
The adoption of the expropriation bill remains a controversial subject, but government is trying to reassure citizens that land grabs will not happen. If the president signs the bill into law only future will tell what the effects of the implementation of the bill will be.
Sources
https://businesstech.co.za/news/energy/602470/experts-give-bleak-outlook-for-load-shedding-in-south-africa-report/
https://maroelamedia.co.za/nuus/sa-nuus/tshwane-bekommerd-oor-beurtkrag-wipwaentjierit/
https://maroelamedia.co.za/nuus/sa-nuus/private-verskaffers-kan-kragrevolusie-veroorsaak/
https://www.chaifm.com/podcast/2022-07-06-christo-van-der-rheede
- Future prices
The graphs below illustrate the market sentiment for maize, in the form of future contracts, for the upcoming contract months. The market sentiment is the expectation of supply and demand fundamentals relating to white and yellow maize in South Africa.
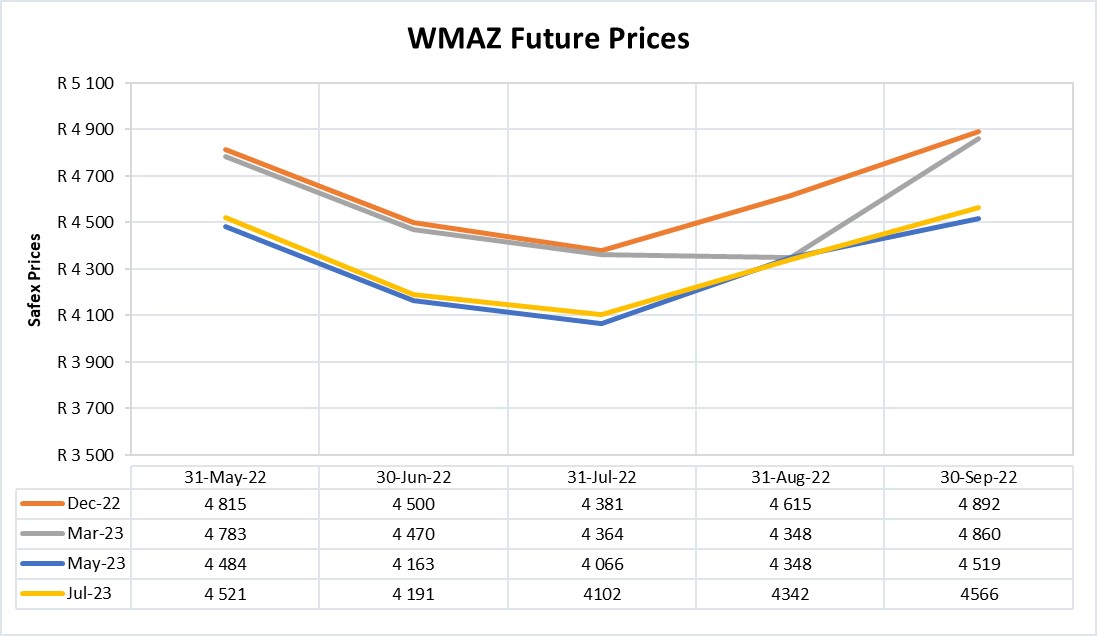
Source: Sagis/JSE

Source: Sagis/JSE
The decrease in WMAZ and YMAZ future prices are due to more supply during harvest season and the unfavourable exchange rate due to the strengthening dollar.
Fraud risk
FRAUD AWARENESS
Here are three fraud prevention tips:
Know who you’re dealing with. In any transaction you conduct, make sure to check with your state or local consumer protection agency and the Better Business Bureau (BBB) to see if the seller, charity, company, or organization is credible. Be especially wary if the entity is unfamiliar to you. Always call the number found on a website’s contact information to make sure the number legitimately belongs to the entity you are dealing with.
Pay the safest way. Credit cards are the safest way to pay for online purchases because you can dispute the charges if you never get the goods or services or if the offer was misrepresented. Federal law limits your liability to $50 if someone makes unauthorized charges to your account, and most credit card issuers will remove them completely if you report the problem promptly.
Guard your personal information. Crooks pretending to be from companies you do business with may call or send an email, claiming they need to verify your personal information. Don’t provide your credit card or bank account number unless you are actually paying for something and know who you are sending payment to. Your social security number should not be necessary unless you are applying for credit. Be especially suspicious if someone claiming to be from a company with whom you have an account asks for information that the business already has.


