
The NWK Limited external factors report provides an overview of the main external factors that NWK and its clients are exposed to at a specific point in time. This report opts to aid in a timely basis to foresee external market and other factors that may have an impact on any business and clients. The main focus of this document is to have a closer look at external factors that can affect any business and our customers.
Executive summary
Inflation rates eased, but the world economy is slowing down and economists expect a global recession this year. On a year-to-year movement retail trade decreased slightly and the unemployment rate is down to 32,9% in quarter three of 2022. The agricultural sector was the biggest contributor to the overall GDP growth of 1,6% even though one thousand jobs were cut in the mining and agricultural sector. Agricultural prices are forecast to decline in 2023, but on a positive note the Policy Uncertainty Index eased to 53,2 in Q3.
The National Agricultural Marketing Council (NAMC) projected the ending stock for 30 April 2023 of white and yellow maize to be less than the 2021/2022 season. According to the final maize forecast the three main maize producing areas, namely the Free State, Mpumalanga and North West are expected to produce 82% of the 2022/2023 crop.
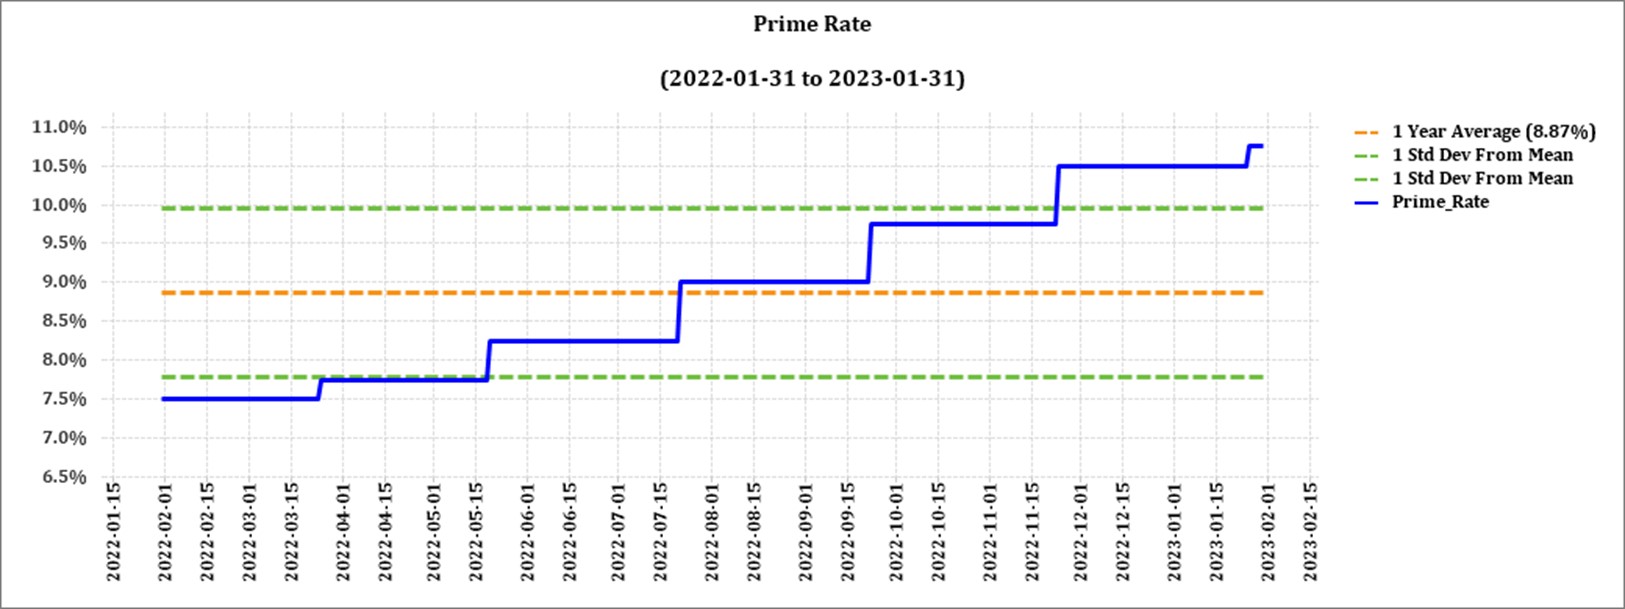
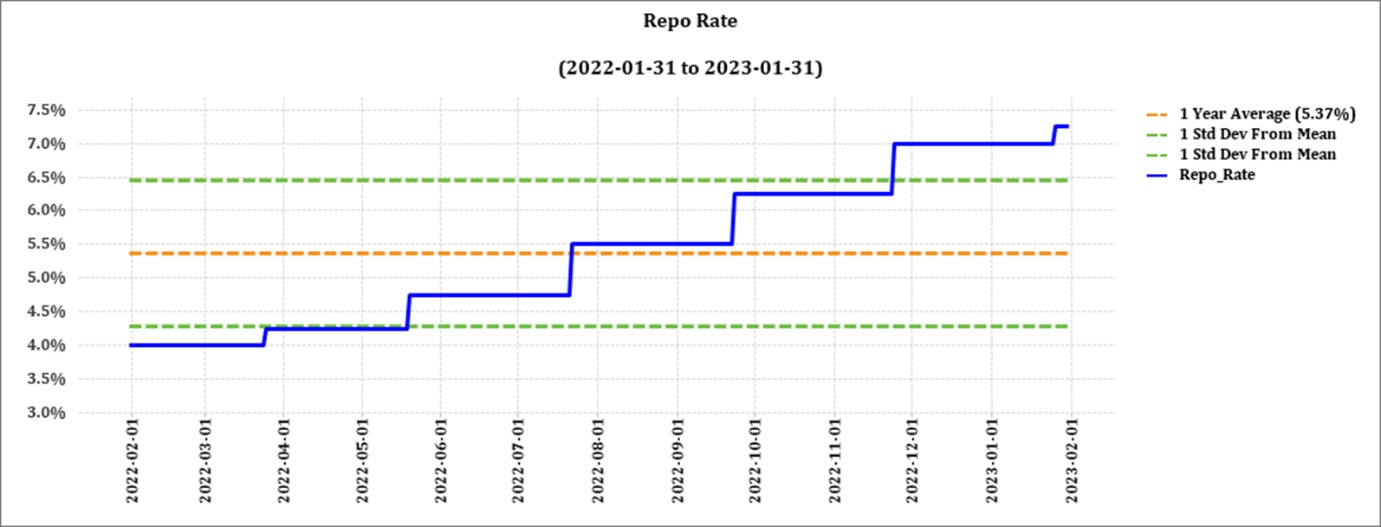
The latest increase of 25 basis points (bps) came into effect on 26 January 2023. The repo rate is currently 7,25% and the prime rate is 10,75%.
Load shedding poses long term risks for the agricultural sector on a supply and input cost level. Cost effective and sustainable alternative solutions must be considered in order to reduce the dependency on Eskom for electricity. Even more so now that tariff hikes of 18,65% have been approved.
On Wednesday evening, 28 September 2022, the National Assembly adopted the controversial Expropriation Bill which currently allows the expropriation of land only for public purposes and in the interest of the public, as stipulated in Section 25 of the Constitution.
The president declared the electricity crisis a state of national disaster during the state of the nation address on 09 February 2023.
According to the World Economic Forum (WEF) the number one short term risk is cost of living despite the ease in inflation.
Business climate: Key risk drivers
A few highlights regarding certain risk drivers are mentioned below.
According to Trading Economics South Africa’s annual inflation rate eased to 6,9% in January 2023 from 7,2% in the prior month, but still above the upper limit of the South African Reserve Bank’s target range of 3% to 6%. It was the lowest reading since May 2022, mainly due to a slowdown in prices of transportation (11,1% vs 13,9% in December), of which fuels (13,1% vs 22,8%).
Brent crude futures fell below $85 per barrel on Friday 18 February and were on track to end the week about 2% lower, weighed down by strong US economic data and hawkish remarks from Federal Reserve officials who hinted at another 50-basis point rate hike to bring down inflation. Oil prices also came under pressure earlier this week after the US government announced plans to release an additional 26 million barrels of oil from strategic reserves and as data pointed to a large buildup in US crude inventories.
South Africa’s retail trade was down by 0,6% from a year earlier in December 2022, following a an upwardly revised 0,8% rise in the previous month and worse than market forecasts of a 0,1% fall according to Trading Economics data. The largest declines in sales were recorded for pharmaceuticals and medical goods, cosmetics and toiletries (-5,2% vs -5,3% in December) and Hardware, paint and glass (-3,9% vs -5,9%).
According to Statistics SA, South Africa’s unemployment rate was at 32,9% in the third quarter of 2022, down from 33,9% in the prior period and below market estimates of 33,4%. This was the lowest jobless rate since Q1 of 2021, as the number of unemployed persons declined by 269 thousand to 7,725 million and employment rose by 204 thousand to 15,765 million. However, the labour force fell by 66 thousand to 23,491 million.
Among sectors, manufacturing (+123 000), trade (+82 000), construction (+46 000) and transport (+33 000) saw the largest job gains, while jobs were cut in finance (-80 000), private households (-36 000) and mining and agriculture (-1 000) each.
The expanded definition of unemployment, including people who have stopped looking for work, was at 43,1%, down from 44,1% in the second quarter. The youth unemployment rate, measuring job-seekers between 15 and 24 years old, fell further to an over two-year low of 59,6% in the third quarter of 2022, but remains high.
The GDP growth for the third quarter rose by 1,6% on quarter in the three months to September of 2022, well above market forecasts of a 0.6% increase, following a 0,7% contraction in the prior quarter, partly because of a low base in the second quarter, when floods disrupted operations at a key export port in Durban. Eight out of ten activities expanded in the third quarter, with the agricultural sector (19,2%) making the biggest contribution to growth, on bumper crops.
The Safex price was considered profitable according to Januaray 2023 white maize spot prices. Agricultural prices are forecast to decline by 5% in 2023 before stabilising in 2024. The projected decline in 2023 reflects a better-than-expected global wheat crop and the resumption of grain exports from Ukraine (although the maize crop is expected to contract materially during the 2022/2023 season). However, there are numerous upside risks to the price forecast.
- First, disruptions in exports from Ukraine or Russia, both key grain exporters, could once again interrupt global supplies, as they did in the early stages of the war in Ukraine.
- Secondly, further increases in energy prices or disruptions in energy supplies (especially natural gas and coal, which are key inputs to fertilisers) could exert upward pressure on grain and edible oil prices.
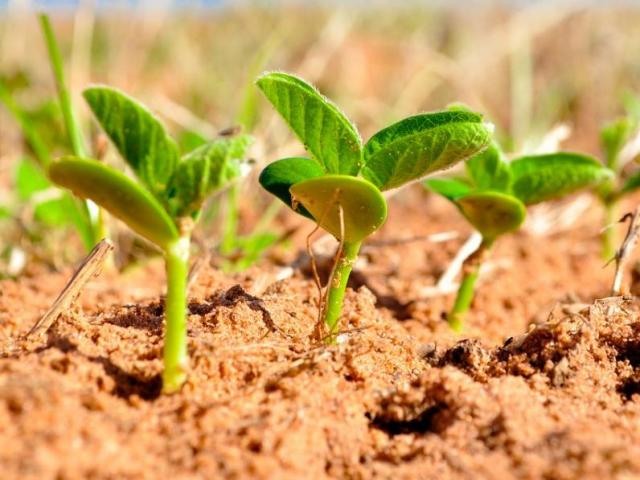
- In the third place, adverse weather patterns can reduce yields – indeed, 2023 is likely to be the third La Niña year in a row, potentially reducing yields of key crops in South America and Southern Africa. However, things can change as see surface temperatures are forecast to rise in February, moving toward an El Niño by June. On the downside, weaker-than-expected growth, especially in China, could affect the prices of certain agricultural commodities such as maize and soybeans, which are used as animal feed.
The iron ore price saw an increase of $10,50 per metric ton from December to January. Prices for iron ore cargoes with a 63,5% iron ore content for delivery into Tianjin eased to below $130 per tonne, from the seven-month high.
The NWU Business School PUI declined significantly to 53,2 points in the fourth quarter compared to 59.6 points in Q3, but remains in negative territory (baseline 50). The PUI is the net outcome of positive and negative factors influencing the calibration of policy uncertainty over the relevant period. It is seen to have important implications for business confidence and the investment climate in the country.
Sources
https://openknowledge.worldbank.org/bitstream/handle/10986/38160/CMO-October-2022.pdf
https://www.statssa.gov.za/?page_id=737&id=1
https://tradingeconomics.com/commodity/brent-crude-oil
https://tradingeconomics.com/commodity/iron-ore
https://tradingeconomics.com/south-africa/gdp https://tradingeconomics.com/south-africa/inflation-cpi
https://tradingeconomics.com/south-africa/unemployment-rategrowth#:~:text=South%20Africa%20GDP%20Grows%201.2,expectations%20of%20a%200.7%25%20growth
NWU Business School Policy Uncertainty Index (PUI) 4Q 2022_09012023_pdf
Agbiz/IDC ACI drops in Q4, 2022
The Agribusiness Confidence Index (ACI) drops below 50-neutral mark in Q4,2022: The Agricultural business chamber quarterly conducts a survey in order to create an Agribusiness Confidence Index. The Agbiz/IDC Agribusiness Confidence Index, which was released on 1 December 2022, reflects the perceptions of at least 25 Agribusiness decision-makers on the 10 most important aspects influencing a business in the agricultural sector.
These ten aspects are:
- turnover;
- net operating income;
- market share;
- employment;
- capital investment;
- export volumes;
- economic growth;
- general agricultural conditions;
- debtor provision for bad debt; and
- financing cost.
These aspects are used by agribusiness executives, policymakers and economists to understand the perceptions of the agribusiness sector. It also serves as a leading indicator of the value of the agricultural output while providing a basis for agribusinesses to support their business decisions.
The Agbiz/IDC Agribusiness Confidence Index (ACI) deteriorated further by 4 points to 49 in the fourth quarter following a 7-point decline in Q3, 2022. This is the first reading below 50-neutral since Q2 of 2020. Higher input costs, ongoing episodes of load-shedding, increased protection in some export markets, persistent animal disease challenges, rising interest rates, intensified geopolitical risks which disrupted supply chains, and ongoing weaknesses in municipal service delivery and network industries remained the key factors that survey respondents cited as the key concerns.
The graph below shows the Agribusiness Index from 2002 to middle 2022.
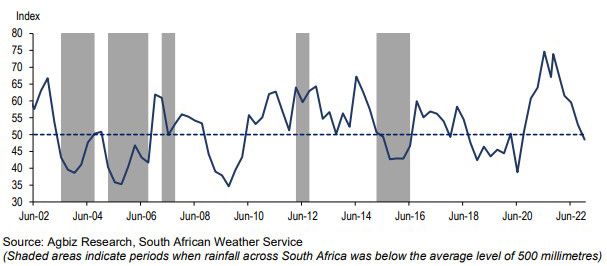
The ACI is comprised of ten subindices, of which seven declined in the fourth quarter of 2022. The turnover subindex fell by 1 point to 78, while the net operating income subindex fell by 4 points to 59 points. This is still above the 50 neutral level and could see a rise in employment levels.
The employment subindex confidence increased by 1 points to 59. This points to a potential slowdown in employment in the fields as the third quarter each year is a quiet period as harvests would typically have been finalised ahead of the start of the 2022/2023 production season in Q4.
Confidence in the capital investments subindex decreased with 5 points to 66. This comes as a surprise as tractor and harvester sales were good. Some firms likely reduced investments as input costs and interest rates rise causing the decline in capital investment points.
The subindex measuring the volume of exports sentiment rapidly declined by 20 points to 50. This is due to the market access challenges faced by the South African citrus industry experienced in the EU, the vegetable export ban in Namibia and Botswana, and less beef exports as a result of the foot-and-mouth disease outbreak.
Confidence in the general economic conditions rose with 1 point to 25. These results mirror the current environment of uncertainty triggered by recent geopolitical tensions, inflation concerns, rising interest rates, a general slowdown in the global economy, and more domestic issues such as the persistent load shedding and inefficiencies in the network industries, amongst other factors.
The general agricultural conditions subindex fell by 2 points to 40, which is the lowest level since the last quarter of 2019. This could be driven by fear that high rainfall could delay summer crop plantings.
The market share of the agribusiness’s subindex dropped by 5 points from the second quarter to 69. The decline was mainly driven by respondents in the agrochemical, horticulture and livestock industries.
The subindices of the debtor provision for bad debt and financing costs are interpreted differently from the abovementioned indices. A decline is viewed as a favourable development, while an uptick signals growing financial strain. In the fourth quarter, the subindex for debtor provision for bad debt fell by 5 points to 34. Financing costs subindex decreased by 7 points to 4 in the last quarter.
In conclusion, Wandile Sihlobo says: ‘The fact that the ACI index dropped below the neutral 50-point mark for the first time in nearly three years suggests that the combination of high input costs, friction in our export markets and persistent animal diseases are starting to bite.’. The likelihood of an El Niño approaching won’t be favourable for an already stressed agricultural sector. One of the most important challenges to address is the electricity crises facing South Africa. Without reliable energy resources the possibilities of growth and the markets’ ability to bounce back will be stalled.
Source: www.agbiz.co.za, Issued by Wandile Sihlobo, chief economist: Agbiz, 1 December 2022
Weather and climate
NATIONAL ASSESSMENT
La Niña is expected to transition into ENSO-neutral during February to April 2023. The chance for ENSO-neutral is 94% from March to May 2023.
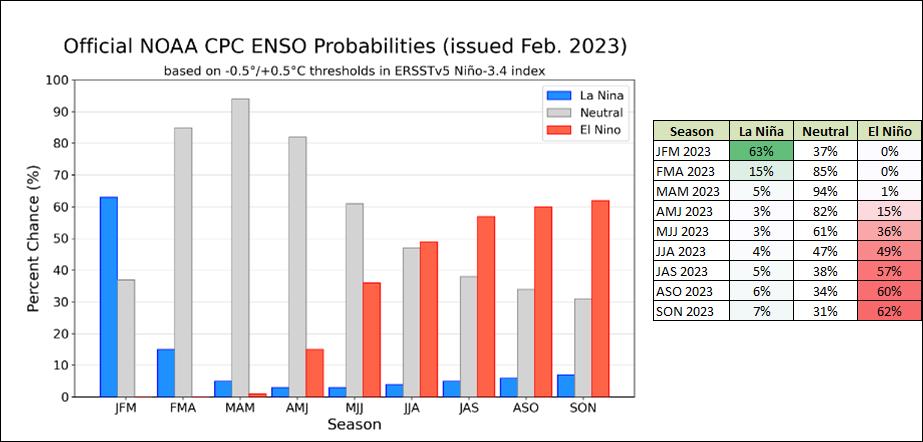
All models indicate a return to neutral NINO3.4 index values by March 2023. Neutral ENSO SSTs are between -0,5°C and 0,5°C. The current SSTs for March to July range from -0,2°C to +0,8°C.
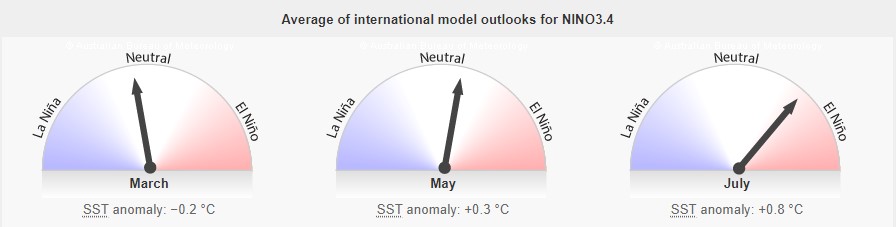
Source: Australian Government – Bureau of Meteorology
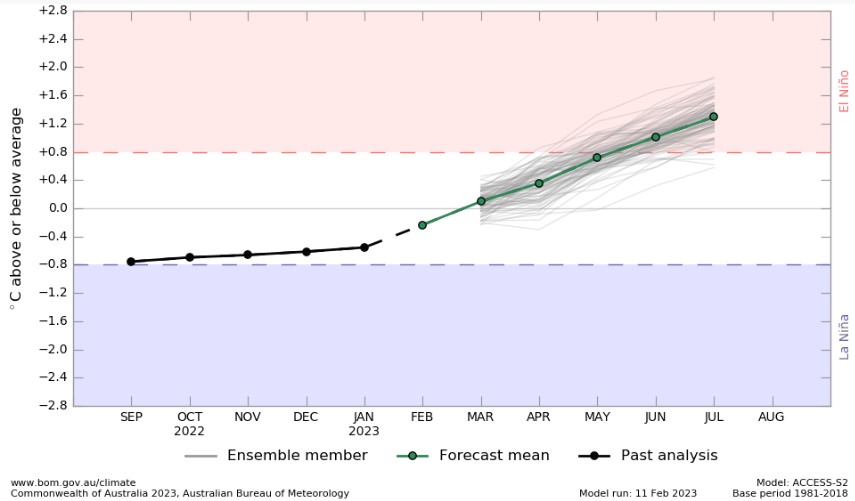
According to the above graph ENSO is still in a La Niña phase, but ocean temperatures near the equator is slowly starting to get warmer. According to the graph it is likely that an El Niño will form later this year in June. The upward trajectile of the graph shows that there will already be less rain than usual as temperatures rise.
The current view on 15 February 2023 is:
- As from 22 February 2023 a dry spell may be felt for 10 to 14 days as a cyclone is forming to the East of Madagascar;
- For the next two to three weeks crops will be in the flower and pollinate stage where they are at their most sensitive to moisture stress;
- Good rainfall predictions for the coming week will be very valuable given the dry spell predicted for the week thereafter.
Source: Martiens du Plessis (15/02/2023)
SUNSPOTS
Sunspots are darker, cooler areas on the surface of the sun that arise due to disturbances in the sun’s magnetic field. Every eleven years, the number of spots dotting the surface of the Sun increases and decreases and forms the solar cycle.
Sources
https://eos.org/articles/why-did-sunspots-disappear-for-70-years-nearby-star-holds-clues 10 June, 2022
https://www.sciencedirect.com/science/article/abs/pii/S136468262200116X#:~:text=It%20was%20observed%20that%20rainfall,an%20increasing%20effect%20on%20rainfall
https://www.space.com/solar-cycle-frequency-prediction-facts May 27,2022
According to science direct the rainfall rate is directly related to the sunspot number, but shows different characteristics during solar maximum years. Though a lag correlation exists between sunspot number and rainfall, sunspots have an increasing effect on rainfall. Studies show that the more sunspots are present the higher the rainfall and the less sunspots the lower the rainfall.
ENSO occurs at irregular interval between three and seven years causing global climate system variation. Considering this event occurs periodically, it might be triggered by the eleven years of solar cycle as an energy source.
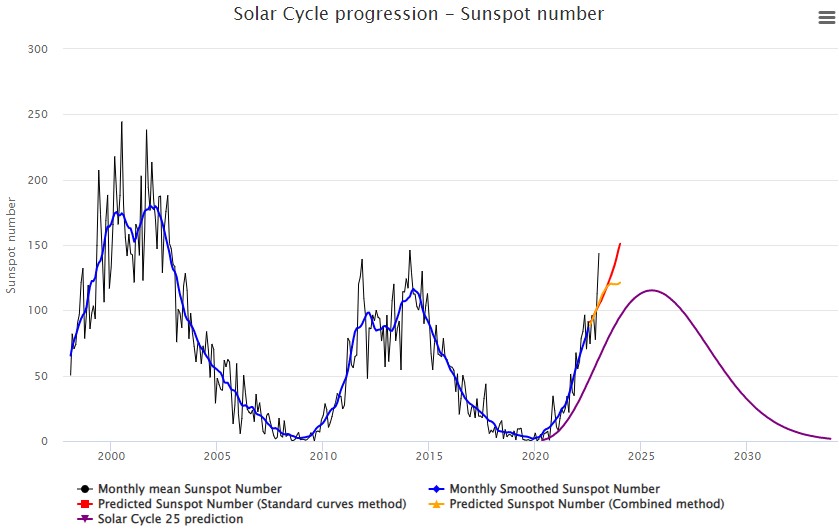
The graph below shows the eleven year solar cycles since before the 2000’s. As the graph is in an upward trajectile higher rainfall can be expected – La Niňa. As the graph reaches its turning point and moves in a downward trajectile less rainfall is expected characteristic of an El Niňo.
The last three years were La Niňa years and as the graph is approaching its forecasted turning point in 2025 an El Niňo can be expected for the coming years. ENSO indicators are still currently in a La Niňa phase but weakening.
One could make the assumption that ENSO-neutral conditions start to develop as the number of sunspots are close to reaching their maximum for the solar cycle and then turn towards El Niňo as the sunspots get less and the graph is in a downward trajectile.
Market risk
GRAIN MARKET ANALYSIS
• Ending stock – national
Ending stock data is gathered from the NAMC. The estimates are reassessed and reported by the Grain and Oilseeds Supply and Demand Estimates Committee. The following is a projection of the April 2023 projected final ending stock for the 2022/2023 season in tonnages:
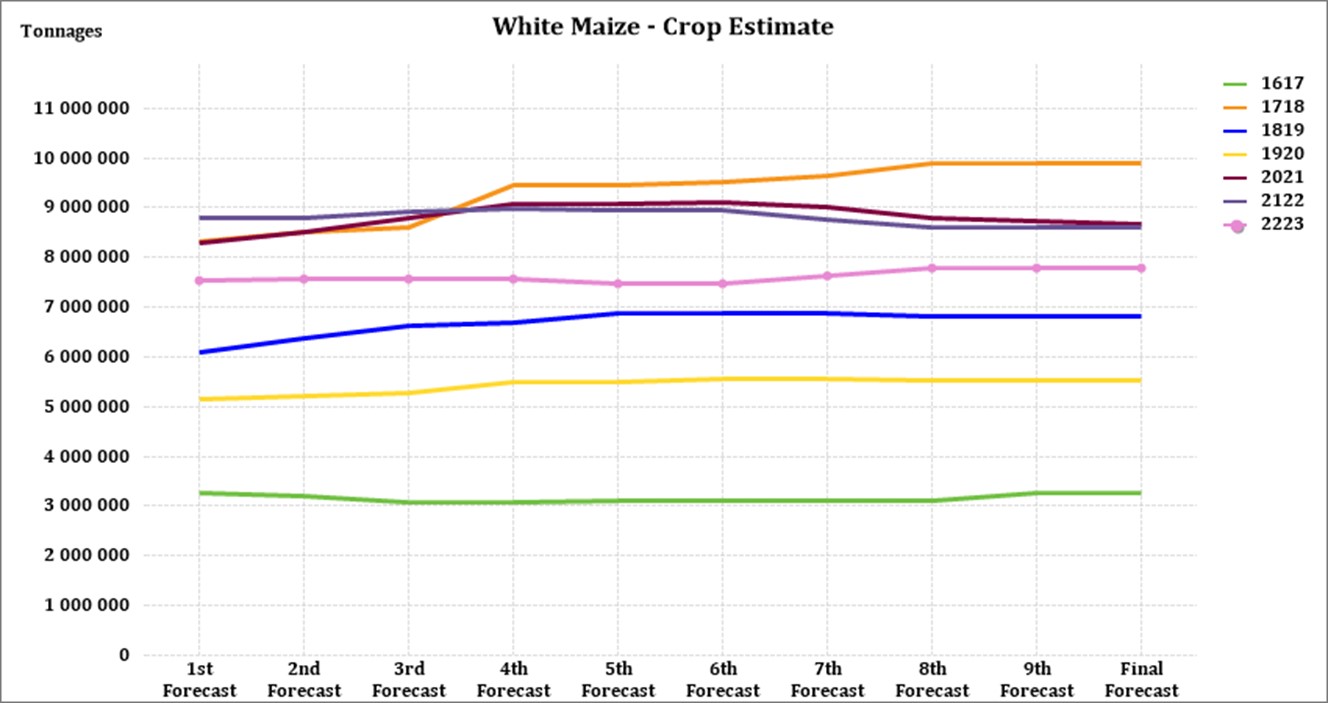
- White maize => 1 353 899 t
- Yellow maize => 784 272 t
The following is a summary of September 2023 ending stock estimates for the 2022/23 season:
- Wheat => 583 923 t
The following is a summary of the February 2023 estimated ending stock for the 2022/23 season:
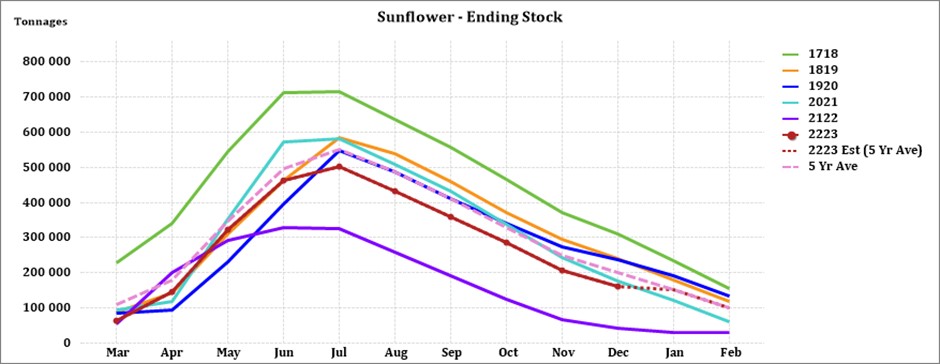
- Sunflower => 59 970 t
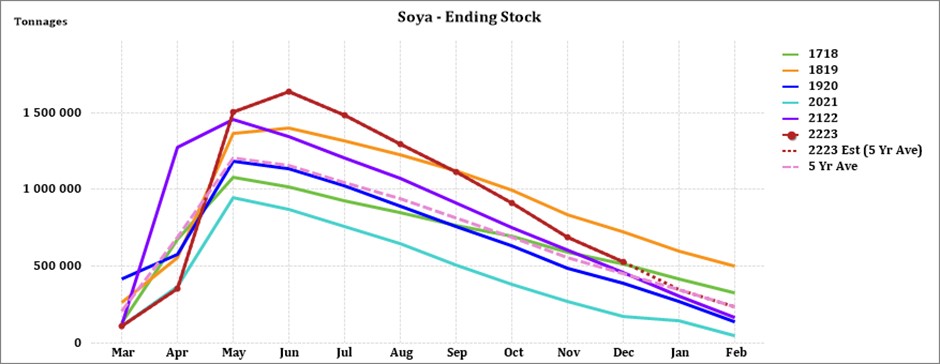
- Soybeans => 183 137 t
- Sorghum => 42 917 t
The graph below shows the estimated ending stock (based on a five-year average) for white maize in April 2023, which is 38 884 t more than the 2021/2022 season. Yellow maize shows an estimated 155 755 t increase in ending stock compared to the previous season.
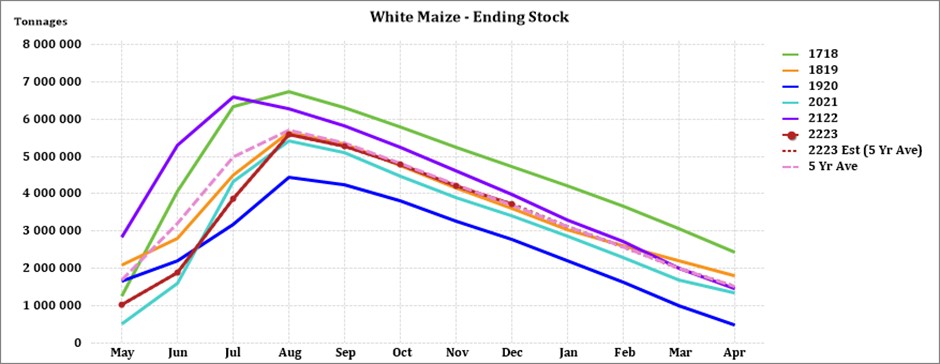
Source: Sagis
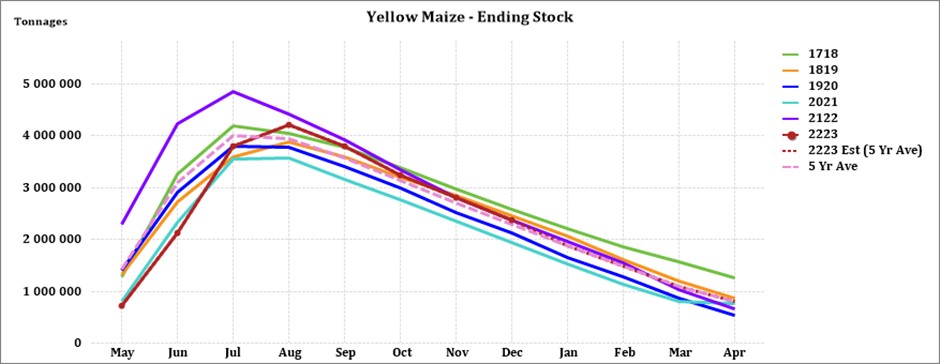
Source: Sagis
The estimated soybeans ending stock for February 2023 is 68 747 tons more than February 2022.
Source: Sagis
The estimated sunflower ending stock is (68 827 tons) more than the previous season ending stock.
Source: Sagis
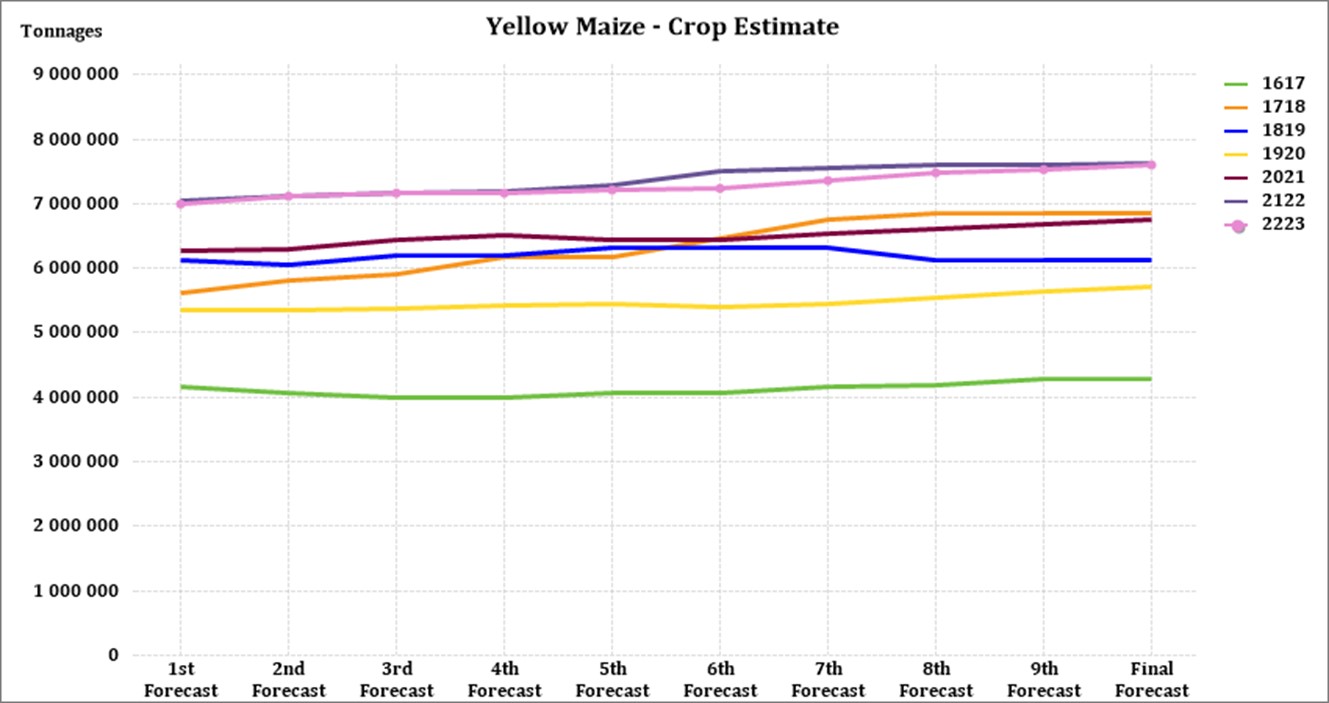
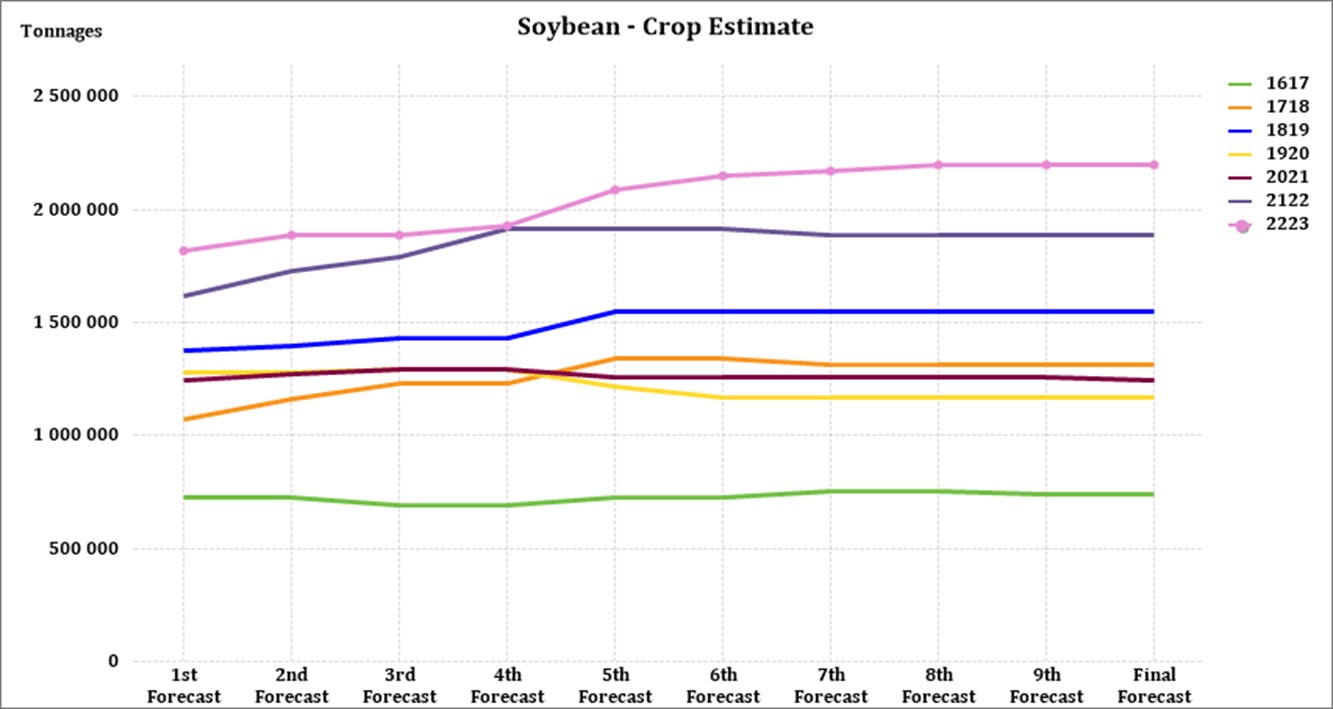
• Crop estimations
According to the Crop Estimate Committee (CEC), the preliminary area estimate for maize is 2,623 million hectares, which is 5% less than the actual 2,755 million hectares planted for the previous season.
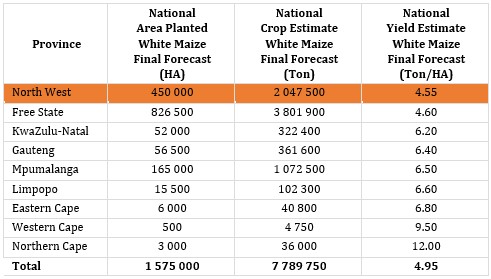
For the final forecast, the preliminary area estimate for white maize is 1,575 million hectares, which represents a decrease of 7% compared to the actual 1,692 million hectares planted last season. In the case of yellow maize, the area estimate is 1,048 million hectares, which is 1,5% less than the actual 1,064 million hectares planted last season.
Source: CEC (Crop Estimates Committee)
Source: CEC (Crop Estimates Committee)
Source: CEC (Crop Estimates Committee)
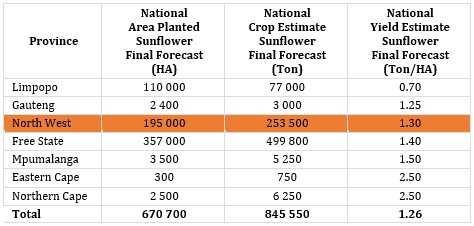
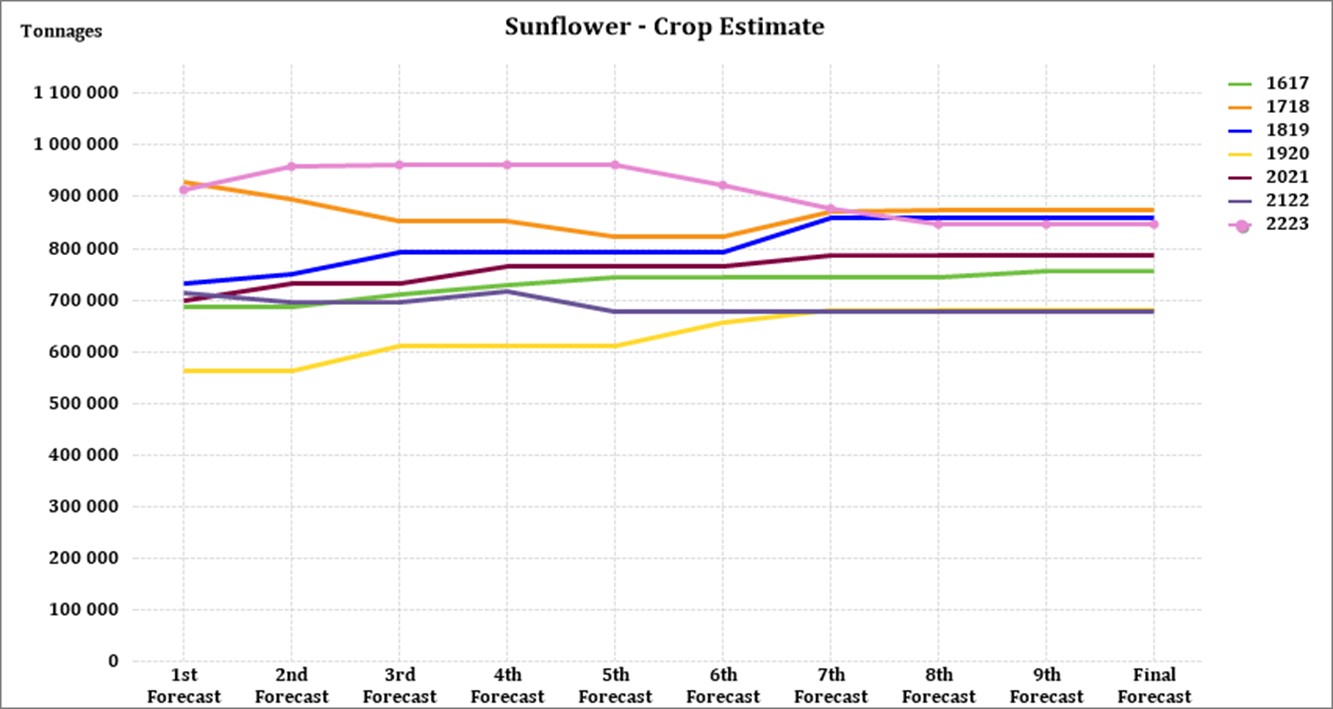
The final area estimate for sunflower seed is 670 700 ha, which is 40% more than the 477 800 ha planted the previous season.
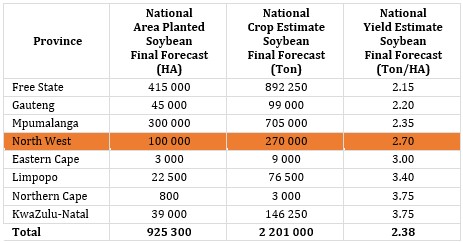
It is estimated that 925 300 ha have been planted to soybeans, which represents an increase of 12% compared to the actual 827 100 ha planted last season. This is the highest soybean area planted in the history of South Africa.
Source: CEC (Crop Estimates Committee)
Source: CEC (Crop Estimates Committee)
Source: CEC (Crop Estimates Committee)
Source: CEC (Crop Estimates Committee)
• Imports and exports – national
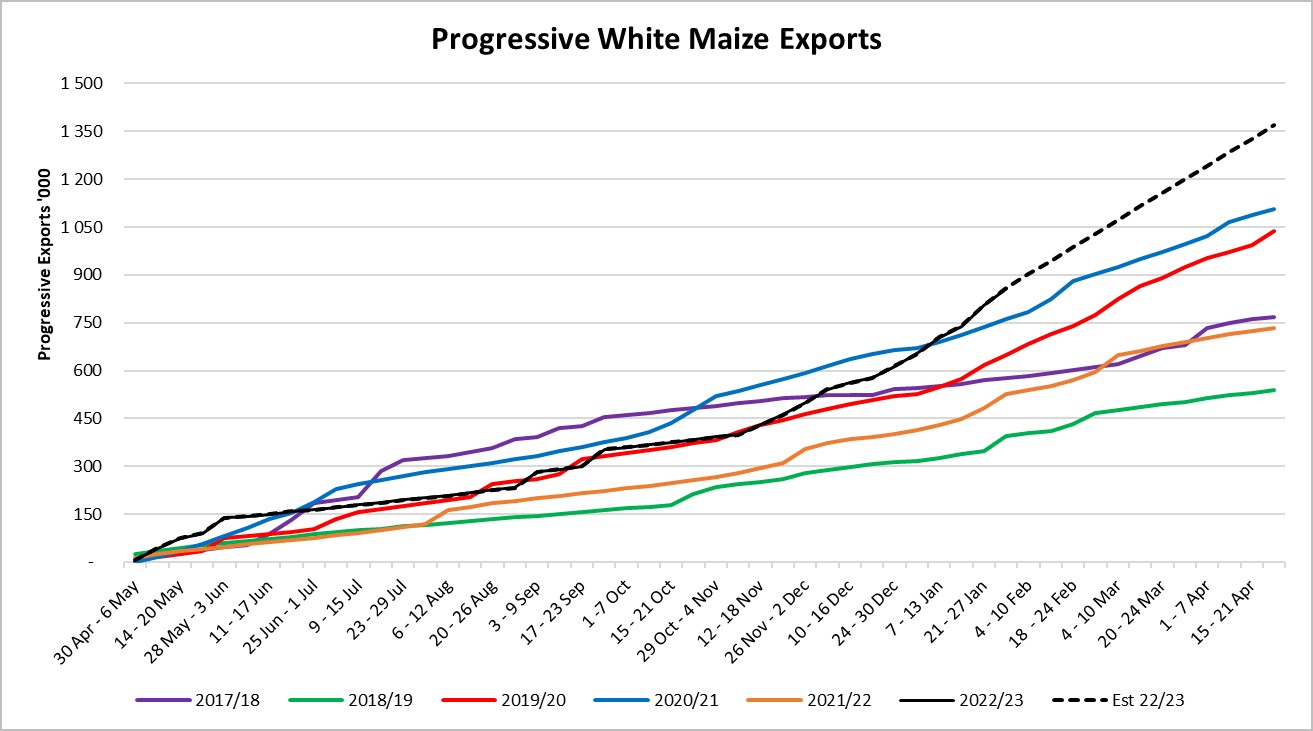
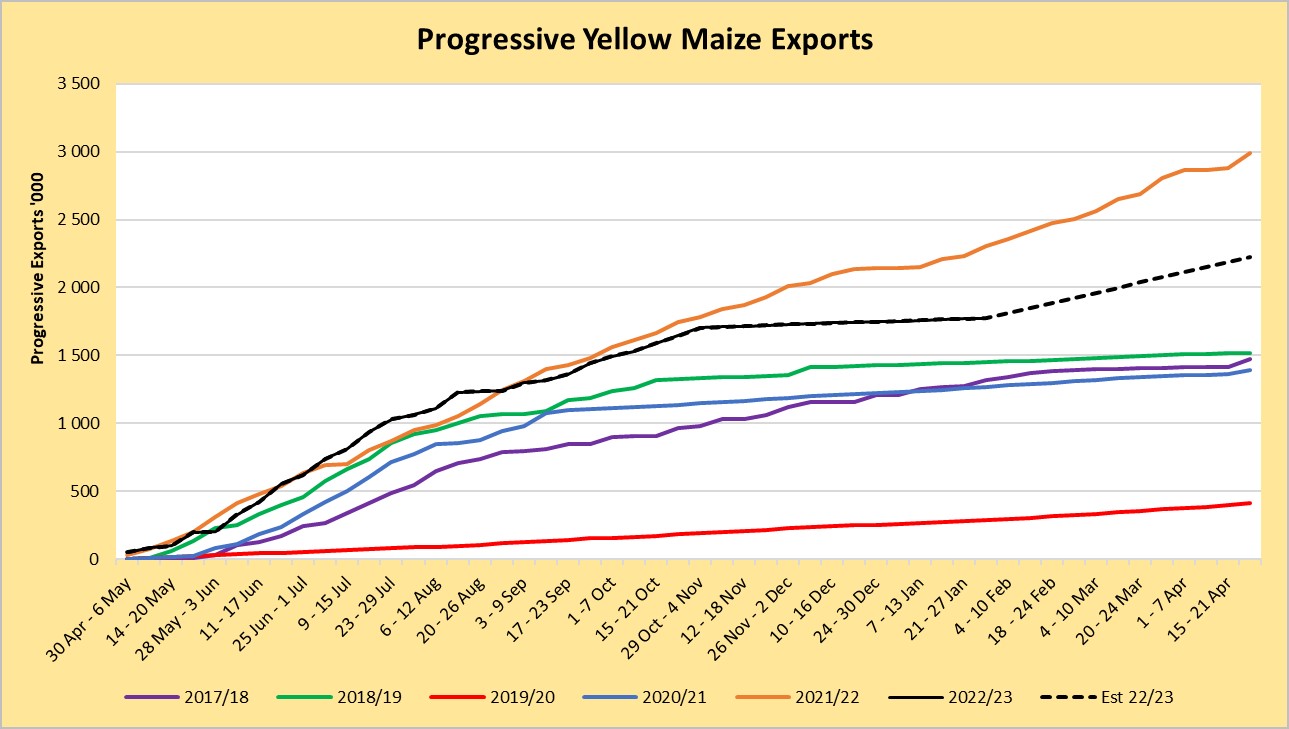
For the production season ending April 2023, 858 744 tons of white maize and 1 773 929 tons of yellow maize have been exported to date (week ending 3 February 2023) as seen in the graphs below, In the previous season a record number of 2 991 129 tons yellow maize was exported, This was mainly due to South Africa’s competitive export parity prices compared to the rest of the world.
Source: Sagis
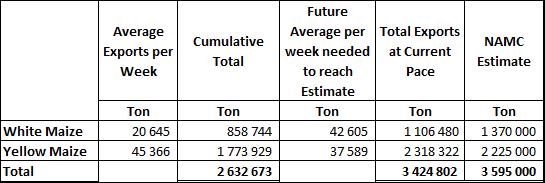
As seen in the table above, the average white maize exports per week are currently 20 645 tons. If theoretically, white maize exports remain at the current average per week then there would be 263 520 tons less white maize exports than anticipated.
The average yellow maize exports per week is currently 45 366 tons. If theoretically, yellow maize exports remain at the current average per week then there would be 93 322 tons more yellow maize exports than anticipated.
Source: Sagis
• Parity prices
South Africa is a small producer compared to other countries and is thus a price taker (meaning that we cannot influence world prices). Because of this, our local prices are normally between import and export parity, which is illustrated in the graph below. An import parity price is defined as the price which a buyer will pay to buy the product on the world market. This price will include all the costs incurred to get the product delivered to the buyer’s destination.
An export parity price is defined as the price that a local seller could receive by selling his product on the world market e.g., excluding the export costs. The price which the seller obtains is based on the condition that he delivers the product at the nearest export point (usually a harbour) at his own expense.
The graph below reflects the Safex price, import parity and export parity of yellow maize as well as the Safex price of white maize. The import and export parity prices for white maize are not released by Grain SA for this period.
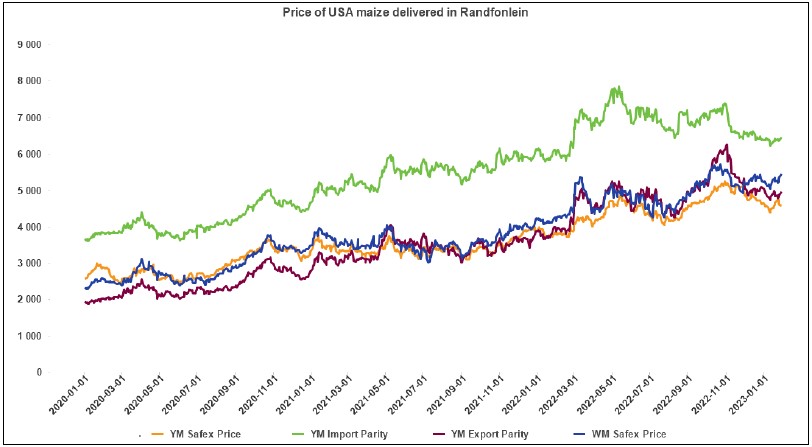
Source: Grain SA
• Producer deliveries – provincial
For the marketing year which is May to April (2022/2023) the Free State dominates the white maize which is used for human consumption and gristing. North West showed a decrease in white maize human consumption for the three month period ending October 2022.
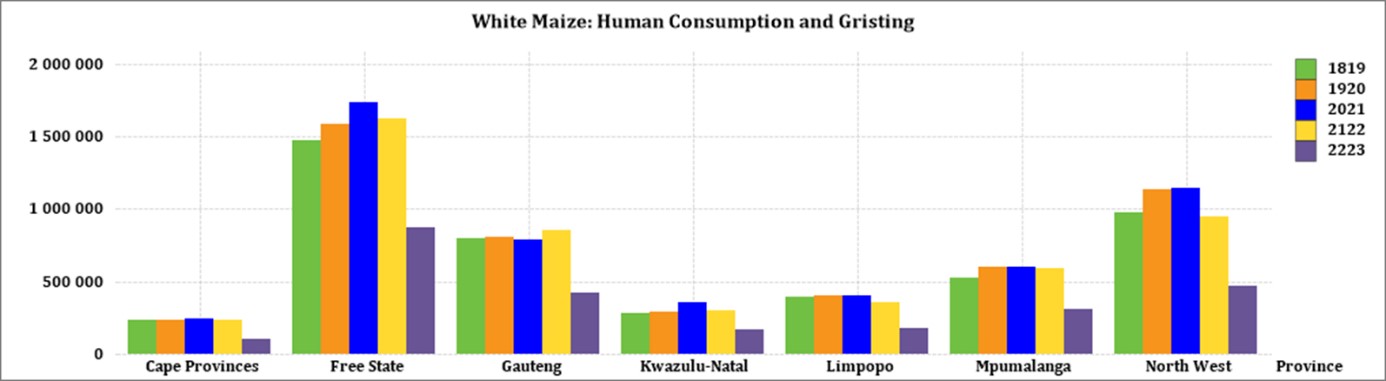
Source: Sagis
The Cape provinces uses the most white maize for animal feed and industrial usage.
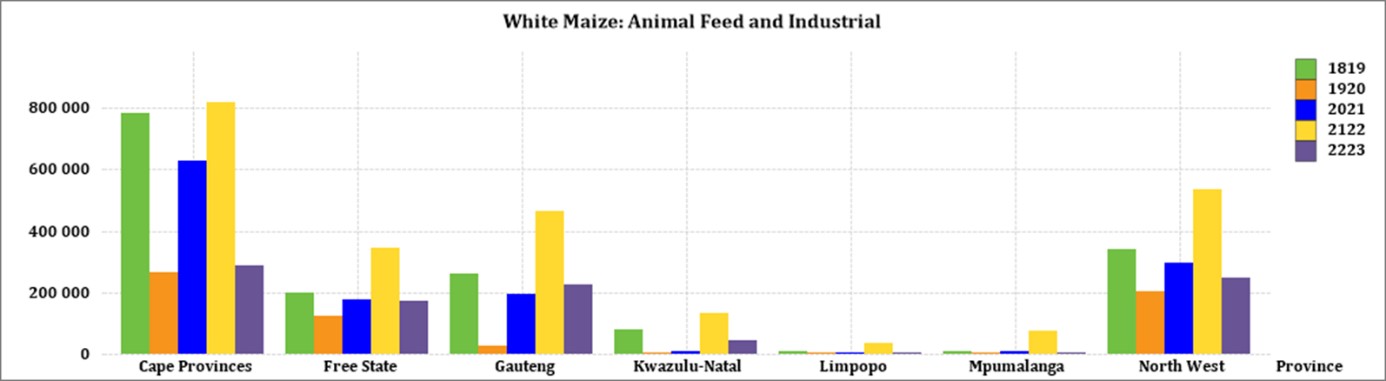
Source: Sagis
North West has a decreasing trend in yellow maize which is used for consumption and gristing. For the three month period ending October 2022 North West processed an accumulative of 4 969 tons of yellow maize.
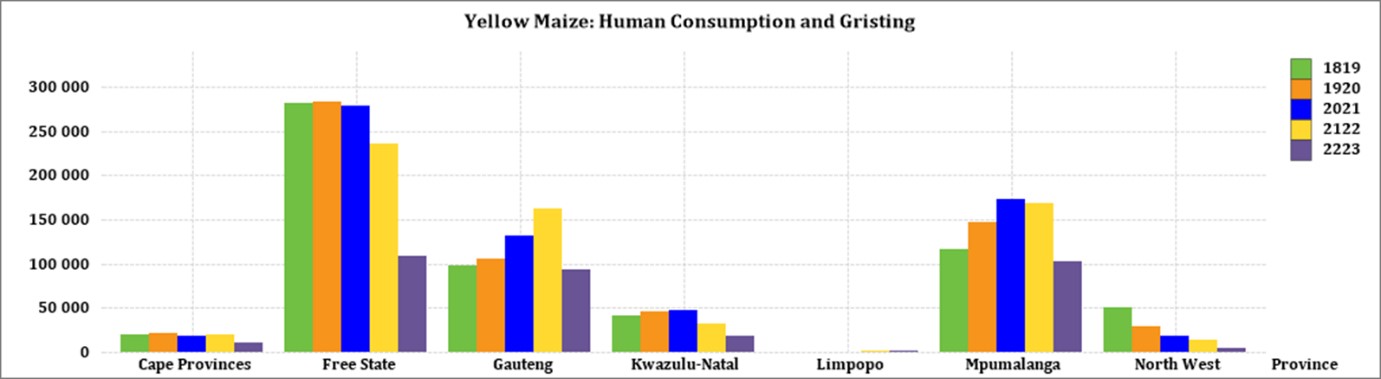
Source: Sagis
When it comes to yellow maize used for animal feed and industrial usage. Gauteng is the biggest consumer.
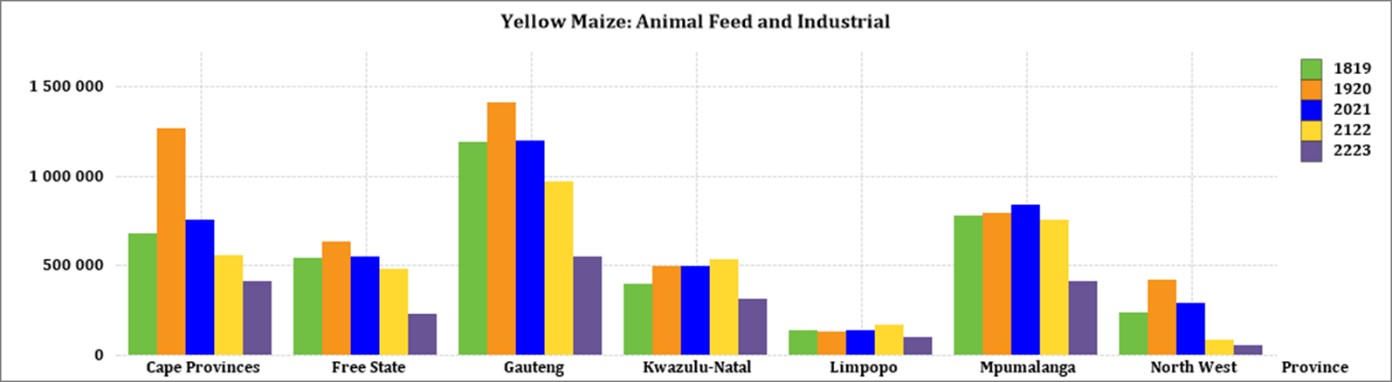
Source: Sagis
• Exchange rate
NWK Group is exposed to foreign exchange rate risk on various business areas, such as commodity prices and trade imports.
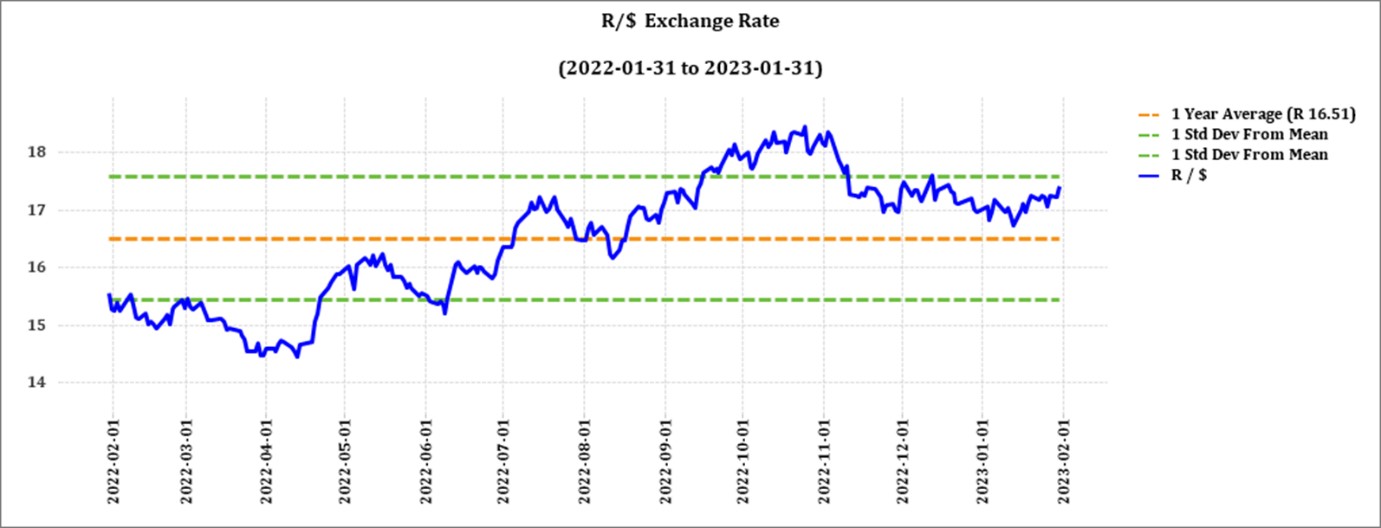
Source: Standard Bank, Corporate and Investment Banking & SARB
On a monthly average basis, the rand depreciated against the US dollar with 1,12% (R0,19) over the period December 2022 to January 2023. The one-year average for rand/US dollar is R17,09. Moreover, the average rand/US dollar exchange rate for the period January 2023 was R17,09 compared to R17,28 in December 2022.
Exchange rate forecast:
The graph below shows the actual USD/ZAR for 2022 Quarter 1 (Q1) to 2023 Quarter 2 (Q2) against the forecasted figures.
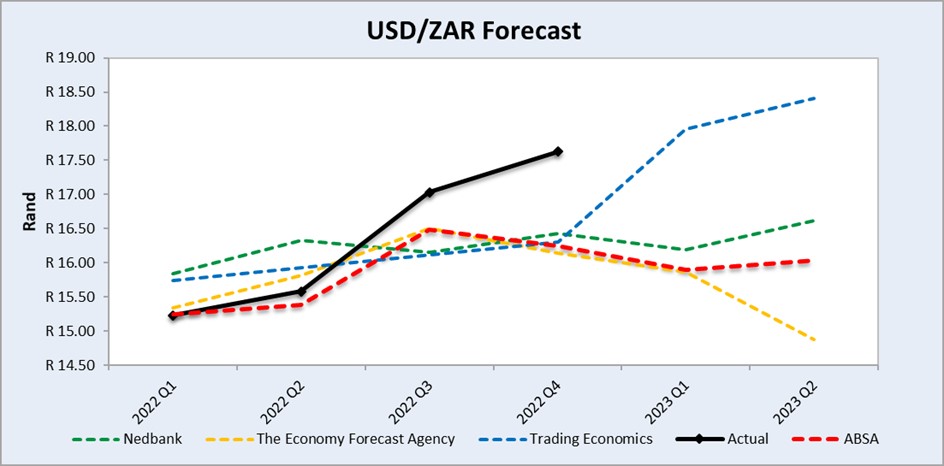
Source: Nedbank CIB; Absa; The Economic Forecast Agency; Trading Economics
• Interest rate risk
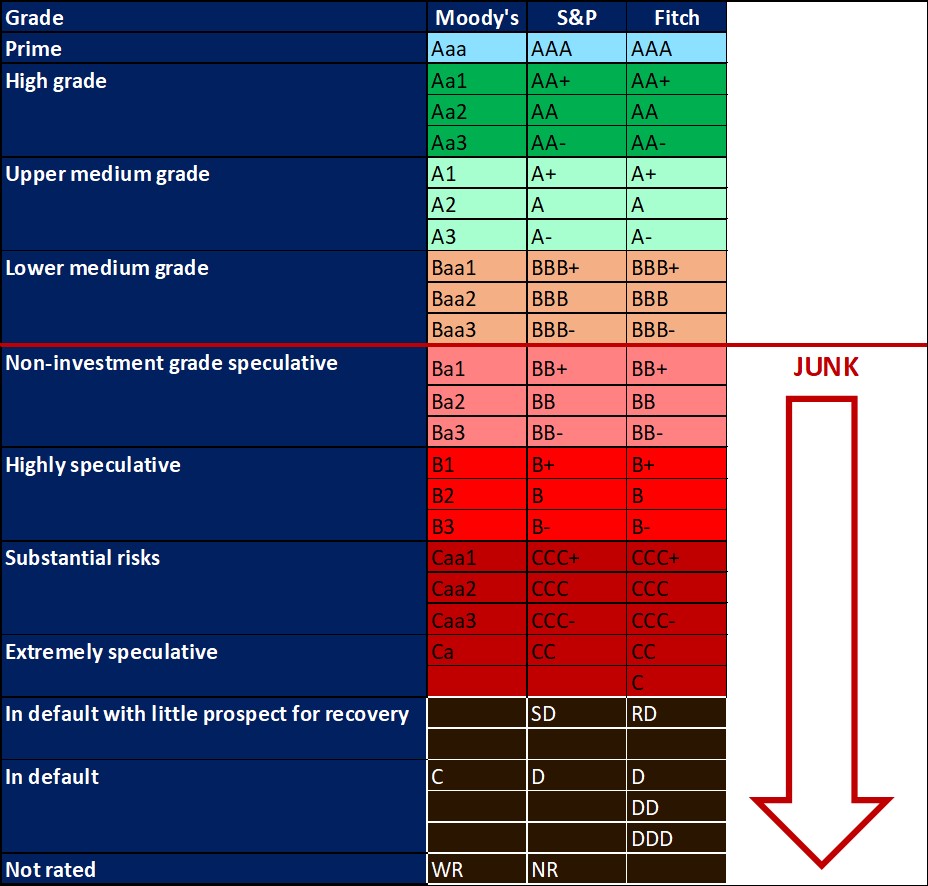
On 27 March 2020, Moody’s downgraded South Africa’s sovereign credit rating to sub-investment grade and placed a negative outlook on the rating. The key drivers for this downgrade include weak economic growth, continuous deterioration in fiscal strength, and slow progress on structural economic reforms. It is now the first time in post-apartheid South Africa where all major rating agencies, i.e.. Moody’s, Fitch and S&P, have South Africa’s credit ratings in sub-investment grade territory. More than a year later and our Moody’s rating remains the same.
The latest increase of 25 basis points (bps) came into effect on 26 January 2023. This is followed by an annual inflation rate of 7,2% in December 2022. The South African Reserve Bank made several interest rate cuts to bring relief to the economy, but as of January 2022 the prime interest rate experienced seven increases. The repo rate is currently 7,25% and the prime rate is 10,75%. The next MPC meeting date is 30 Match 2023.
Interest rate movement:
- 27 January 2022: 7,50%
- 24 March 2022: 7,75%
- 19 May 2022: 8,25%
- 21 July 2022: 9,00%
- 22 September 2022: 9,75%
- 24 November 2022: 10,50%
- 26 January 2023: 10,75%
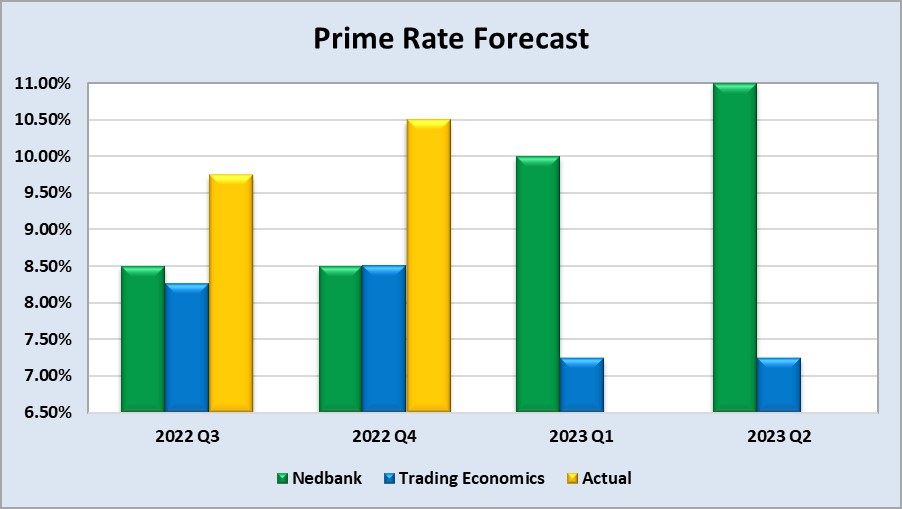
The following graph shows the prime rate forecast for 2022 Quarter 1 to 2022 Quarter 4. Both Q1, Q2 and Q3 experienced higher interest rates than anticipated by Nedbank and Trading Economics.
• Highlights in the agrochemical sector
Fertiliser prices have eased from their early 2022 peaks but we are still in a period of high fertiliser prices. The factors contributing to the high fertiliser prices have not gone away and the situation is currently “unstably stable” according to Jason Minkhorst. Food insecurity, inflation, Ukraine war and China’s policy of export restrictions around fertiliser are still concerns. With the northern hemisphere’s planting season approaching and the demand for fertiliser there might be a rally in fertiliser prices.
Source: https://www.farmersweekly.co.nz/markets/fertiliser-prices-finally-show-signs-of-easing/
Herbicides
The following products are the main products regarding herbicides that may have an impact on input costs for producers:
- Glyphosate (95%)
- Acetochlor (92%)
- Atrazine (97%)
- Metolachlor (97%)
- Trifluralin (95%)
The following comparison is from the January 2023 Grain SA report which reports the previous month’s prices.
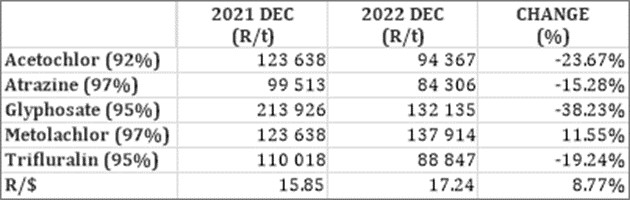
In comparison with the previous year’s prices, four of the five main products experienced a decrease in prices. Glyphosate had the biggest decrease with -38,23%.
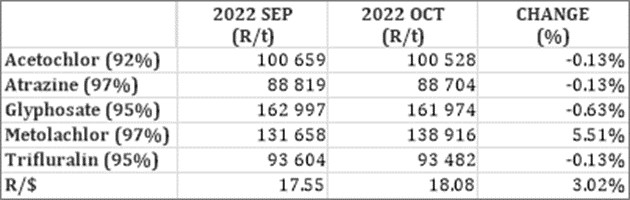
For the two months compared three products experienced a slight price decrease.
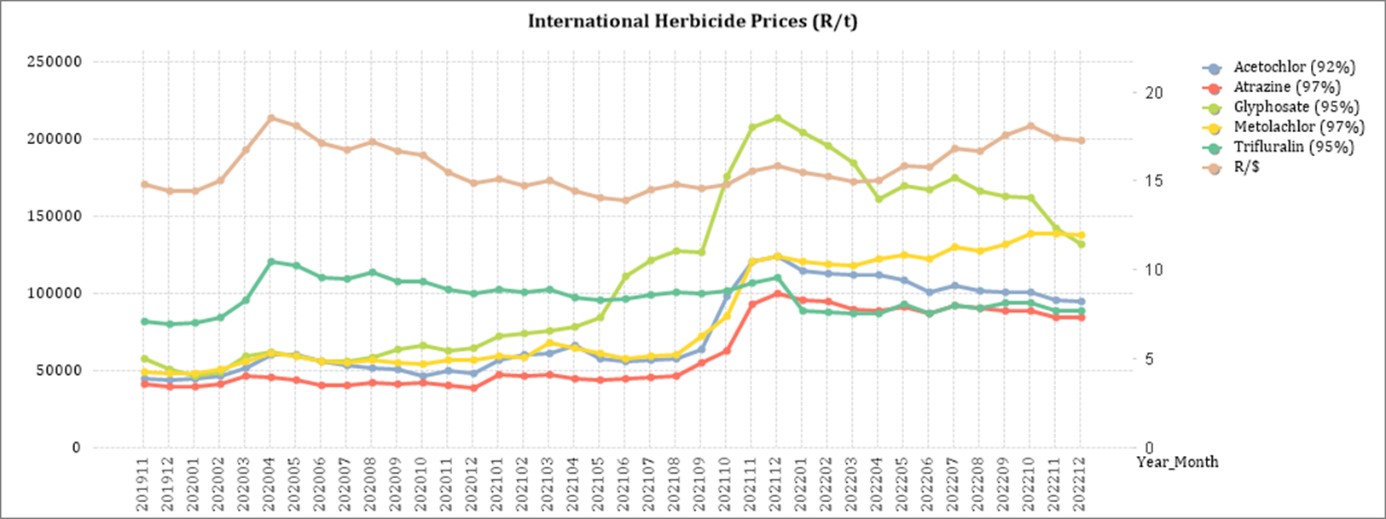
The graph below shows the international herbicides prices (R/t) per product from November 2019 to December 2022.
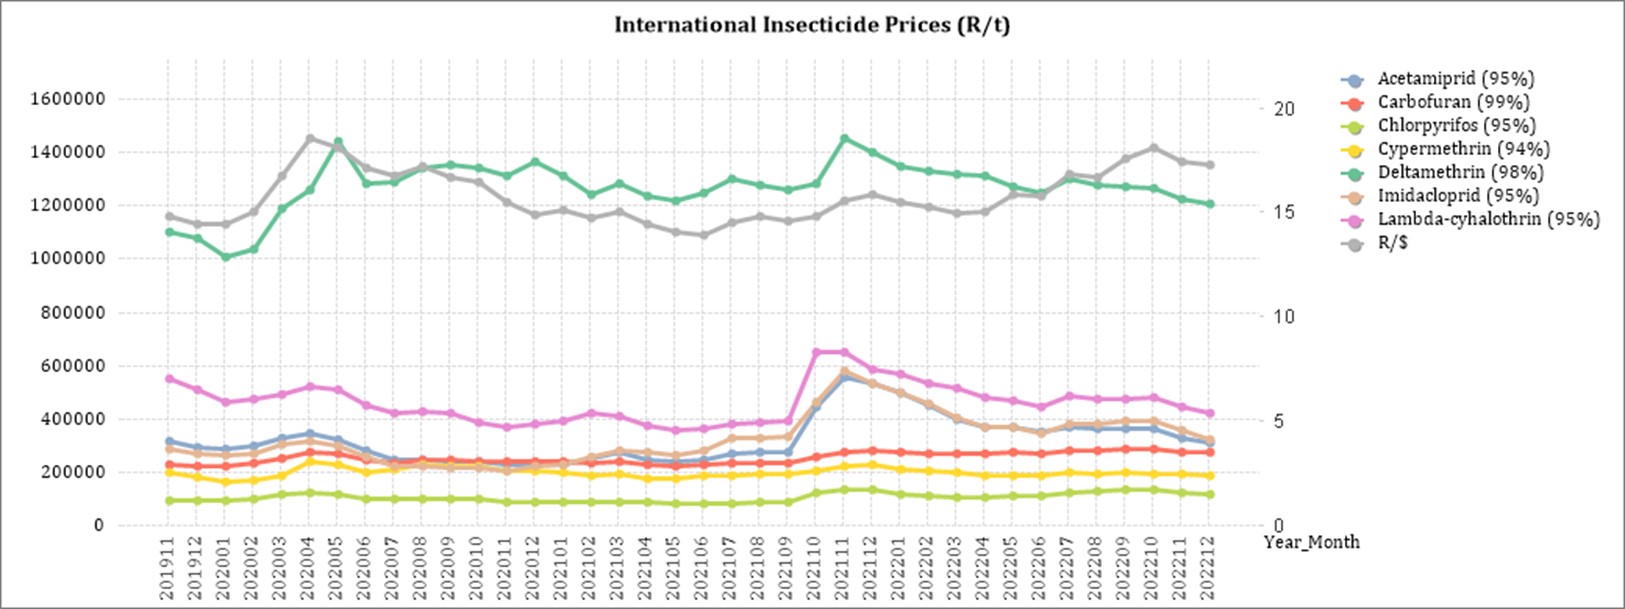
Insecticides
The following products are the main products regarding insecticides that may have an impact on input costs for producers,
Imidacloprid (95%)
Lambda-cyhalothrin (95%)
Carbofuran (99%)
Deltamethrin (98%)
Acetamiprid (95%)
Chlorpyrifos (95%)
Cypermethrin (94%)
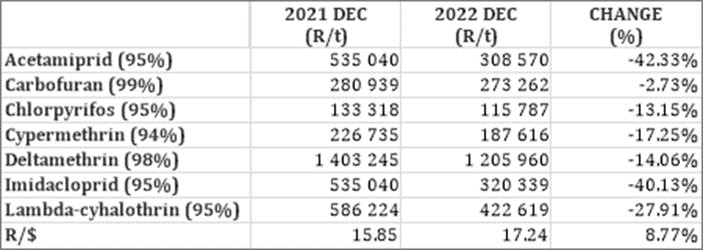
In comparison with the previous year’s prices. all of the products experienced a price decrease. The largest decrease was Acetamiprid with a decrease of 42,33% and Imidacloprid with 40,13%.
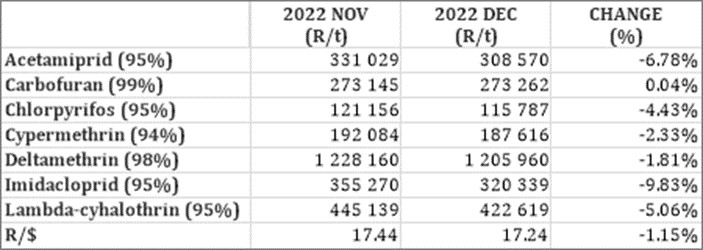
Six of seven products experienced slight price decreases in December.
The graph below shows the international insecticide prices (R/t) per product from November 2019 to December 2022.
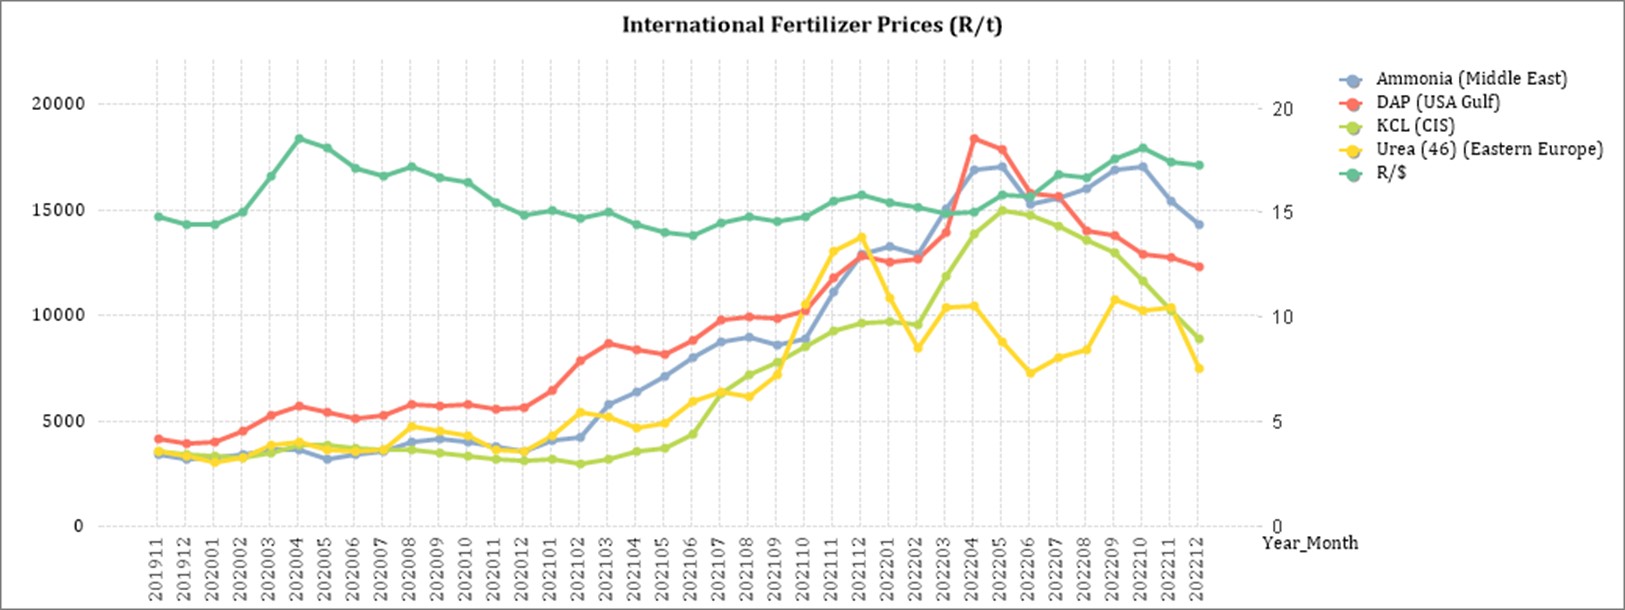
Fertiliser
The following fertiliser products are being analysed:
- Ammonia (Middle East)
- Urea (46%) (Eastern Europe)
- DAP (USA Gulf)
- KCL (CIS)
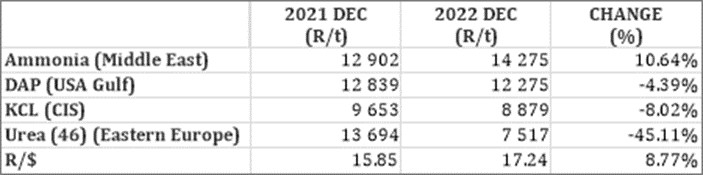
As seen in the table above all of the main fertiliser products increased on a year-on-year basis. The biggest decrease, based on average international prices (R/t), was urea (45,11%).
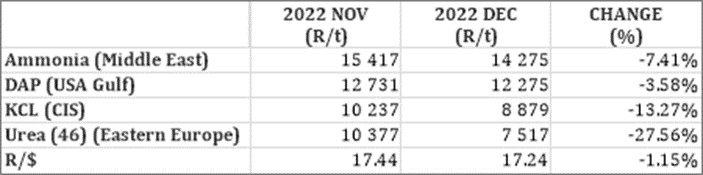
For the two months compared, all of the products experienced a decrease in price per ton. Urea experienced the biggest price decrease with 27,56%.
The graph below shows the International Fertiliser prices (R/t) per product from November 2019 to December 2022.
Sources: Grain SA – https://www,ft,com/content/4d746aa5-29e3-4796-b9e6-0b64c6865389
Urea market: Urea prices drastically decrease in all regional markets as buyer interest is minimal. The Urea market is currently heavily oversupplied, and the minority of active buyers are being flooded with offers from urea producers around the world. Indian urea stocks are reported as being high and the government is therefore delaying permission to issue the next tender.
Demand from Europe, the US and Brazil is very low as local producers in the US and Europe are happily producing at capacity as natural gas prices in both regions are at twelve-month lows – these regions thus have satisfactory inventory and local supply to meet demand.
Ammonium nitrate market (AN): Ammonia prices also decreased quite rapidly. With ammonia being a key raw material for ammonium phosphate production, this price reduction improves economics for MAP and DAP producers.
Phosphates: Phosphates prices have generally been stable in most markets the past few weeks as the price differentials between major regions are starting to narrow. With phos acid prices looking likely to decrease and ammonia and sulphur prices moving sharply down, there would appear to be scope for MAP prices to decline if producers maintain current production rates. With China also still out of the picture as far as phosphate exports goes, the supply-demand balance is finely poised. South African trade data for MAP for January to November showed imports of 230 000 tons compared to 300 000 tons in the same period last year, a 23% decline. According to Fcurve Insights, this is attributed to Foskor’s improved production and local sales volumes, as well as an element of demand destruction due to the record high prices of MAP this year.
Potash: The big market move for Potash was the decreasing of prices in the USA as Canadian producers accepted price cuts to boost sales Brazilian potash consumption has been strong driven by the Safrinha planting season, however high stock levels and ongoing high import volumes have ensured that supply has not been a constraint and it is unlikely prices will rise unless there are big moves in prices in other regions, which also looks unlikely. The market consensus points to potash prices stabilizing somewhat during Q1 but the downturn in prices is expected to resume strongly in Q2.
Source: https://www.grainsa.co.za/upload/report_files/Chemical-and-Fertilizer-Report_Jan-2023.pdf
• Economic impact of load shedding on the agricultural sector
- Modern farming businesses have become extremely dependent on electricity to run their irrigation, cooling, pumping stations, and mechanization. Producers may need to find alternative power sources. These sources, while reliable, come at a cost. With increasing fuel costs and the big fuel consumption nature of generators, investing in a generator as a power source may not be a sustainable solution – especially for small-scale farmers who are sensitive to increasing variables costs. With even higher levels of load shedding expected in 2023 these input costs will soon be much higher.
- When producers fail to find alternative sources, they take the risk of forfeiting water quotas for irrigating purposes which can cause the business to go under.
- Machinery and equipment are damaged and repairment comes to a standstill as a result of power outages. Producers may be forced to work after hours when there is electricity, leading to increased expenditure on overtime wages and increasing production costs. Some farmers may not be able to afford this, given that production costs such as fertilizer and fuel have already increased a lot over the last few months.
- According to economist Dawie Roodt, South Africa has been getting poorer for the past ten years on a per capita basis and one of the major contributors to this is a lack of electricity.
- The producers’ production has a direct impact on their ability to repay loans. With increasing inflation and higher interest rates in South Africa, the repayment capacity of loans decreases and are less likely.
Electricity tariff hike
Nersa granted Eskom a 18,65% hike in electricity prices for the 2023/2024 tariff year. It will be effective from 1 April 2023. With load shedding already increasing input costs in many sectors due to generators and other energy sources being expensive to run, the latest electricity increase is going to cripple producers even further and threaten food security.
Sources
https://www.news24.com/news24/community-newspaper/paarlpost/electricty-tariff-hike-will-hinder-agriculture-20230113
https://www.businesslive.co.za/bd/national/2023-01-12-power-cuts-are-sowing-the-seeds-of-food-crisis-say-farmers/
• Expropriation bill
On Wednesday evening, 28 September 2022, the National Assembly adopted the controversial Expropriation Bill which currently allows the expropriation of land only for public purposes and in the interest of the public, as stipulated in Section 25 of the Constitution.
While Section 25(3) requires the amount of compensation for land to be “just and equitable” the bill makes it possible for expropriation of land with “nil compensation” under specific circumstances. These circumstances include abandoned land, state land, or land held for speculative purposes. However, the DA, EFF, IFP, FF Plus and ACDP objected to the bill each for different reasons.
Patricia de Lille, public works and infrastructure minister, has tried to assure South Africans that the government has no intention of using the bill to “arbitrarily” seize land from private owners. She said that talk of land grabs and seizures of private property amounted to fear-mongering.
The bill will now go to the National Council of Provinces for commencement, after which it will head to the desk of the president to be signed into law.
Summary
According to Christo van der Rheede, Agri SA’s executive director, load shedding also poses a risk to food security and social stability.
The adoption of the expropriation bill remains a controversial subject, but government is trying to reassure citizens that land grabs will not happen. If the president signs the bill into law only future will tell what the effects of the implementation of the bill will be. Electricity tariff hikes will hinder agriculture and farmers are worried.
Sources
https://businesstech.co.za/news/energy/602470/experts-give-bleak-outlook-for-load-shedding-in-south-africa-report/
https://businesstech.co.za/news/government/629653/land-expropriation-bill-moves-ahead-as-government-tries-to-calm-fears-over-land-grabs/
https://maroelamedia.co.za/nuus/sa-nuus/tshwane-bekommerd-oor-beurtkrag-wipwaentjierit/
https://maroelamedia.co.za/nuus/sa-nuus/private-verskaffers-kan-kragrevolusie-veroorsaak/
https://www.chaifm.com/podcast/2022-07-06-christo-van-der-rheede
https://www.news24.com/news24/politics/parliament/national-assembly-adopts-expropriation-bill-but-opposition-parties-object-for-different-reasons-20220929
• State of the nation address (SONA)
On Thursday, 09 February 2023, President Cyril Ramaphosa delivered the state of the nation address and made two important announcements. A National State of Disaster has been declared in response to dealing with the energy crisis and the proposal to appoint a Minister of Electricity is made. It is important that the decision to declare a National State of Disaster be taken seriously and treated with the necessary controls in order to prevent corruption. Whether the appointment of a Minister of Electricity will be the answer to the electricity crisis is debateable.
Resolving the energy crisis is essential for South Africa’s GDP growth and combating the socioeconomic challenges. It is clear from the SONA that current tactic to resolve the energy crisis is not effective. Change has to be enforced and parties should be held accountable for not delivering quality timely services.
Global risks – World Economic Forum
The Global Risk Report released by the WEF displays the top global risks over the short and long-term. The top 5 short term global risks ranked by severity over two years are:
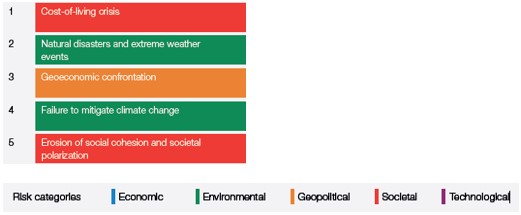
The cost of living is already at worrying levels with the FAO Price Index reaching the highest level in March 2022 since its inception in 1990. What is interesting to see is that the current number one global risk, cost-of-living crisis, will only be the 15th highest risk in the long-term.
Global inflation is rising and uncertainty looms over when the Russian/Ukraine war will end and when food exports, inflation and interest rates will start to stabilise or ease. Rising energy prices and a shortage of energy supply pose a further threat to the cost of living. According to the WEF there is a material possibility of a global food supply crisis occurring in 2023. This can lead to a humanitarian crisis with a up flair in protests and political unrests.
To illustrate the point of rising living costs in South Africa see the graph below.
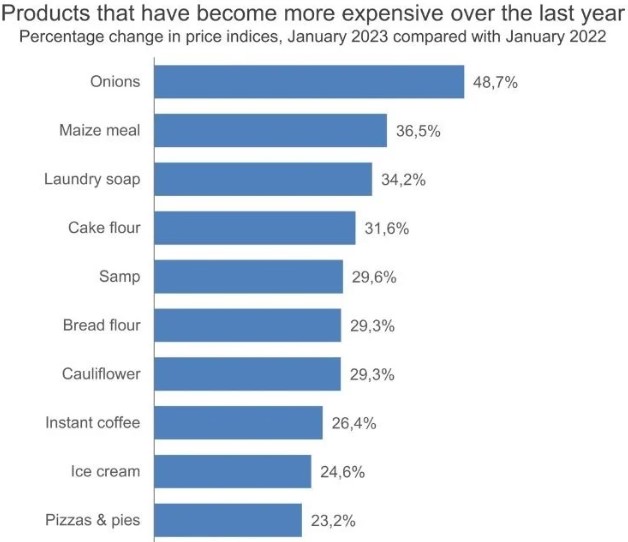
Source: https://www.news24.com/fin24/economy/just-in-inflation-cools-but-red-hot-food-prices-hit-new-high-20230215#&gid=1&pid=1
The top 5 long term global risks (ten years) ranked by severity are:
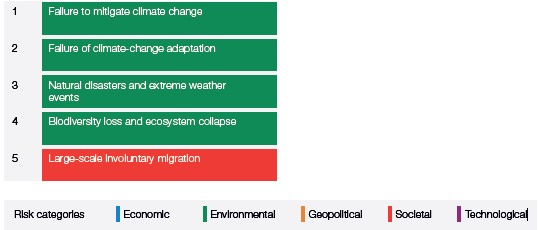
The number one long term risk namely failure to mitigate climate change refers to the failure of governments, businesses and individuals to enforce, enact or invest in effective climate-change mitigation measures, such as the decarbonization of economic activity. It is seen as the global risk that we are the least prepared for. Pressure on energy-importing countries to invest in cleaner renewable energy sources have already limited progress on climate change mitigation due to geopolitical tensions and economic pressures. A good example of progress almost being reversed is the EU spending €50 billion on new and expanded fossil-fuel infrastructure and some countries restarting coal power stations instead of investing in cleaner sources. Progress to mitigate climate change is slow and short-term goals are often pursued without consideration of the long-term effects.
Source: WEF_Global Risks Report 2023 pdf
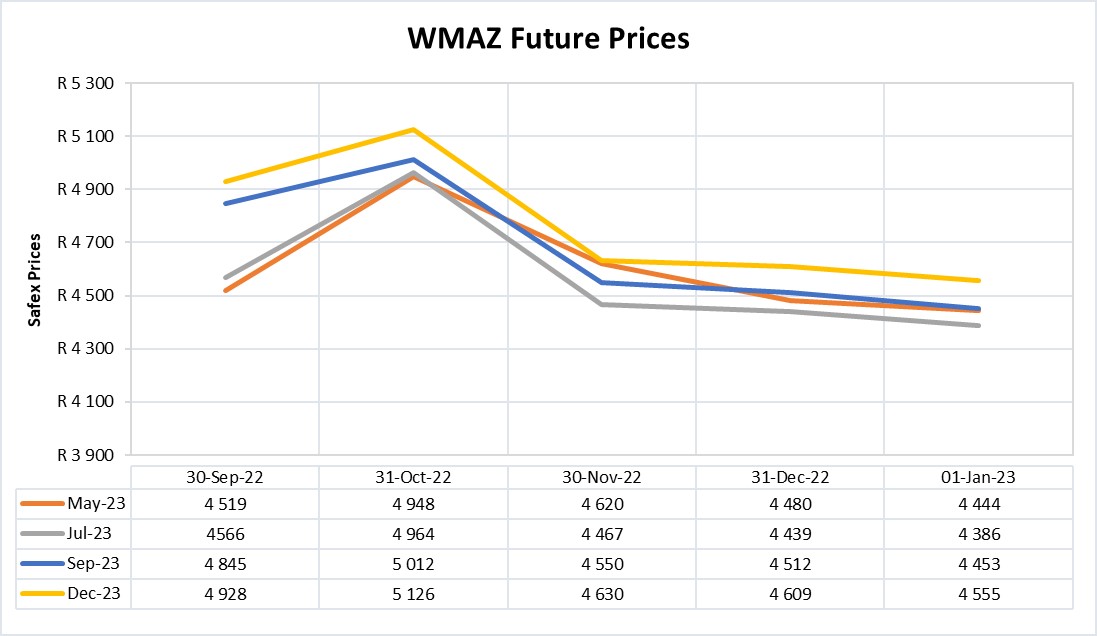
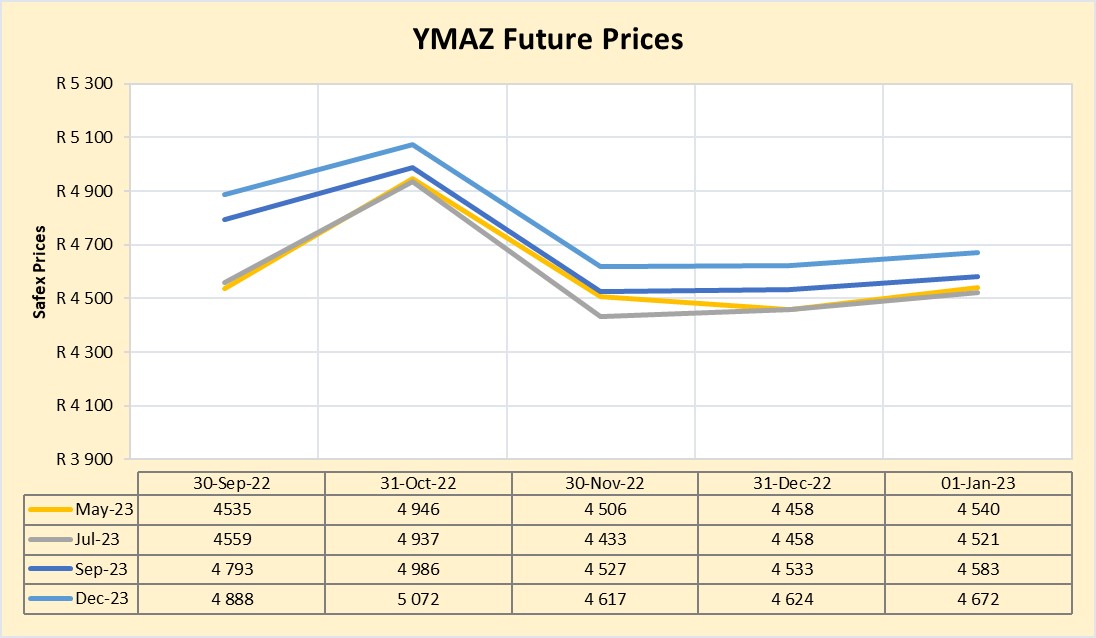
FUTURE PRICES
The graphs below illustrate the market sentiment for maize, in the form of future contracts, for the upcoming contract months. The market sentiment is the expectation of supply and demand fundamentals relating to white and yellow maize in South Africa.
Source: Sagis/JSE
Source: Sagis/JSE
Maize prices increased seasonally in most markets and remained above the previous year and five-year averages, driven by declining stock-to-use ratios and strong export demand to East Africa. Maize prices are expected to follow typical seasonal trends, peaking in February before stabilizing in March and declining in April as harvests commence.
Source: https://reliefweb.int/report/world/global-price-watch-december-2022-prices-january-31-2023
Fraud risk
FRAUD AWARENESS
Here are three fraud prevention tips:
Don’t believe promises of easy money. If someone claims that you can earn money with little or no work, get a loan or credit card even if you have bad credit, or make money on an investment with little or no risk, it’s probably a scam. Oftentimes, offers that seem too good to be true, actually are too good to be true.
Fully understand the offer. A legitimate seller will give you all the details about the products or services, the total price, the delivery time, the refund and cancellation policies, and the terms of any warranty. Contact the seller if any of these details are missing, if they are unable to provide the details, it may be a sign that it’s a scam.
Get off credit marketing lists. Credit bureaus compile marketing lists for pre-approved offers of credit. These mailings are a goldmine for identity thieves, who may steal them and apply for credit in your name. Get off these mailing lists by calling the credit bureaus (your social security number will be required to verify your identity). Removing yourself from these lists does not hurt your chances of applying for or getting credit.


