
The NWK Limited external factors report provides an overview of the main external factors that NWK and its clients are exposed to at a specific point in time. This report opts to aid in a timely basis to foresee external market and other factors that may have an impact on any business and clients. The main focus of this document is to have a closer look at external factors that can affect any business and our customers.
Executive summary
External factors that can affect any business and its customers include various economic factors. This report will focus on monthly or quarterly changes of these economic factors.
The inflation rate decreased to 4,6% in July 2024, the lowest in three years. Retail trade rose by 4,1% in June 2024. The unemployment rate rose to 33,5% in the second quarter of 2024. The GDP growth for the first quarter contracted with -0,1%, down from a 0,1% increase in the previous quarter. The Policy Uncertainty Index moved further into negative territory from 65,8 to 68,3 points in Q2.
Political factors can also have an impact on an industry. The appointment of a new Minister of Agriculture might bring new insights into the agricultural industry. Minister John Steenhuisen highlighted the continuity and enhancement of South Africa’s Agricultural and Agro-processing Master Plan (AAMP). Focus will be placed on underdeveloped regions like the Eastern Cape, Limpopo and KwaZulu-Natal. Clear communication, inter-departmental cooperation and partnerships with the private sector are crucial for success. The success of the AAMP also depends on collaboration with the Departments of Land Reform and Rural Development.
Other external factors that are of great concern to any agricultural business is the weather and climate outlooks. These factors include long term climate risks, such as drought and heat stress, as well as the current status of the El Niño and La Niña climate phenomenon. The South African Economic outlook report of 2024 highlights the severe risks drought and heat stress poses to the production of essential commodities that are crucial to global and local food security.
According to the Allianz Risk Barometer 2024 the agricultural sector faces the following top five risks: Climate change, natural catastrophes, environmental risks, changes in legislation, and business interruption. The risk as well as mitigating measures are discussed in the report.
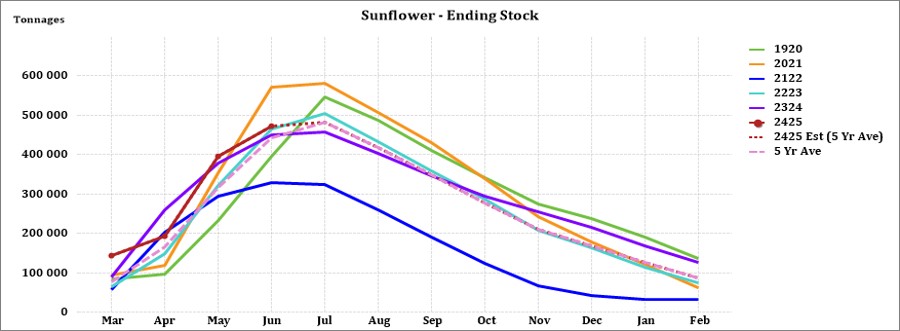
The National Agricultural Marketing Council (NAMC) projected the ending stock for 30 April 2025 of white and yellow maize to be less than the 2023/2024 season. The projected soya ending stock for February 2025 is 103 527 t, that is less than the final for the 2023/2024 season of 320 637 t. The projected sunflower ending stock for February 2025 is 65 444 t, that is less than the final for the 2023/2024 season of 127 144 t.
During the previous Monetary Policy Committee (MPC) meeting held on 18 July the committee once again decided that interest rates will remain unchanged. The repo rate is currently 8,25% and the prime rate 11,75%.
Business climate: Key risk drivers
A few highlights regarding certain risk drivers are mentioned below.
According to Trading Economics South Africa’s annual inflation rate decreased to 4,6% in July form 5,1% in June 2024. The inflation rate is expected to be 5,2% by the end of this quarter. It still remains above the central bank’s preferred level of 4,5%.
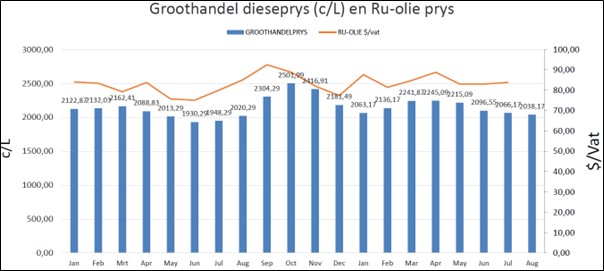
Brent crude oil monthly average prices increased by $2,91 per barrel from June to July. From a US perspective, Brent crude oil futures rose to around $79,5 per barrel on 28 August after losing over 2% in the previous session, driven by a drawdown in US crude inventories. API data showed a decline of 3,4 million barrels for the week ending August 23rd, surpassing market expectations of a 3 million barrel decrease.
South Africa’s retail trade climbed by 4,1% over a year ago in June 2024, following an upwardly revised 1,1% rise in the prior month. According to Statistics SA, South Africa’s unemployment rate rose slightly to 33,5% in Q2.
The GDP growth rate contracted by -0,1% on quarter in the first quarter in 2024. Six of the ten industries experienced declines. Agriculture was the main positive contributor with a growth increase of 13,5%.
The maize Safex prices remained high, increasing by 4,6% and 8,2% for white and yellow maize month-on-month, respectively. The white maize monthly average Safex price for July was exceedingly profitable at R5 282 per ton. Maize prices are expected to hover around the R4 000 per ton mark for yellow maize and above the R5 000 per ton mark for white maize. Expected weather improvements on the back of the high probabilities of the La Nina weather during the 2024/2025 production season are expected to limit excessive gains. Local production is expected to meet the local demand and some regional export demand.
Adverse weather patterns can reduce yields and also affect the Safex price (high regional demand poses an upside price risk). The El Niño–Southern Oscillation (ENSO) is currently in a neutral phase at and is expected to remain neutral until early spring. The Bureau’s ENSO Outlook is at La Niña Watch due to early signs that an event may form in the Pacific Ocean later in 2024. From March 2021 to July 2024 the actual sunspot numbers were higher than the predicted values.
The iron ore price increased with $1,53 per metric ton on a monthly average from June to July. Prices of iron ore cargoes with a 62% iron content fell to below the $100 threshold in August, the lowest in 20 months, as poor demand for steel in China drove mills to cut their iron input buying. China’s housing oversupply crisis and the government’s lack of stimulus measures toward debt-ridden property developers increasingly hampered the outlook for construction activity.
The Policy Uncertainty Index (PUI) moved further into negative territory from 65,8 to 68,3 points in Q2. In addition to the well-known global risks and uncertainties the 2024 election outcome also weighed on investors and the markets. The PUI is the net outcome of positive and negative factors influencing the calibration of policy uncertainty over the relevant period. It is seen to have important implications for business confidence and the investment climate in the country.
Sources
https://tradingeconomics.com/south-africa/inflation-cpi
https://tradingeconomics.com/commodity/brent-crude-oil
https://tradingeconomics.com/south-africa/unemployment-rate
https://www.statssa.gov.za/?page_id=737&id=1
https://tradingeconomics.com/south-africa/gdp-growthchrome-extension://efaidnbmnnnibpcajpcglclefindmkaj/https://agrink.co.za/downloads/ABSA%20Agri%20Trends%20Grains%20and%20Veggies.pdf
https://tradingeconomics.com/commodity/iron-orePUI_2024Q2.pdf
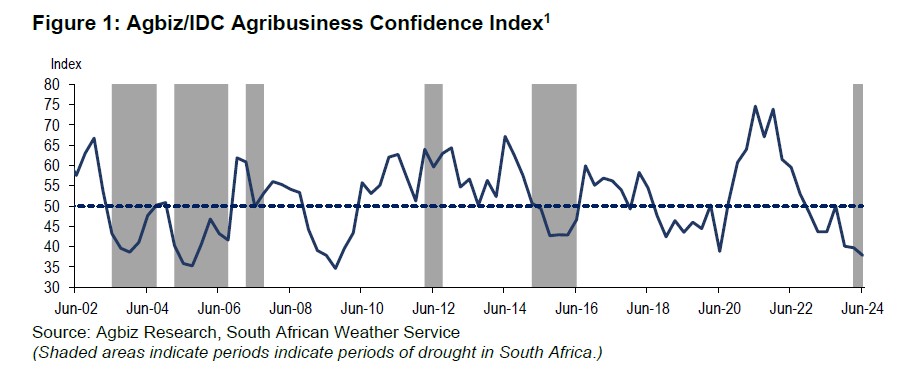
Agribusiness Confidence Index (ACI) at its lowest level since Q3 2009
The Agricultural Business Chamber conducts a quarterly survey to compile the Agribusiness Confidence Index (ACI), reflecting the views of at least 25 decision-makers in the agricultural sector. Released on June 24, 2024, the latest index evaluates ten critical factors impacting agribusiness: Turnover, net operating income, market share, employment, capital investment, export volumes, economic growth, general agricultural conditions, debtor provisions for bad debt, and financing costs.
The Q2 2024 ACI registered a decline to 38 points from 40 in the previous quarter, marking its lowest level since Q3 2009 during the global financial crisis. This downturn signifies persistent pessimism among agribusinesses regarding economic conditions in the country.
Factors such as the recent El Niño-induced drought affecting summer grains and oilseed production have contributed significantly to this sentiment. Concurrent challenges like inadequate road infrastructure, municipal service delivery issues, ongoing animal diseases, and geopolitical tensions have further exacerbated concerns within the sector.
While there is acknowledgment of improvements in Transnet’s operations, there remains a call for sustained efforts to address inefficiencies in ports and rail networks. Uncertainty surrounding government formation during the survey period likely compounded the subdued mood among agribusiness stakeholders. Conducted from June 10 to 19, the survey encompassed all agricultural subsectors across South Africa.
Discussion of the subindices
In Q2 2024, several subindices of the ACI exhibited significant movements, reflecting the dynamic challenges faced by agribusinesses. Here’s a breakdown of each subindex:
- Turnover subindex: Dropped sharply by 9 points from Q1 2024 to 22, marking its lowest level since Q2 2020. This decline underscores the bleak outlook for summer grains and oilseed harvests, compounded by elevated input costs post-Covid-19.
- Net operating income subindex: Fell by 13 points to 35, primarily due to the adverse impact of the mid-summer drought on farming incomes.
- Employment subindex: Decreased by 12 points to 38, contrary to expectations driven by tough production conditions in some sectors, employment in the agricultural sector rose by 6% year-on-year.
- Capital investments subindex: Declined by 4 points to 46, aligning with reduced sales of tractors and combine harvesters since the beginning of the year.
Conversely, some subindices showed modest improvements:
- Market share subindex: Increased by 6 points to 65, buoyed by gains in winter crops and select financial services sectors, while other segments maintained stability.
- General economic conditions subindex: Recovered by 9 points to 38 in Q2 2024, although still below the neutral mark of 50, attributed partly to expectations of reduced power outages and improved GDP forecasts.
- General agricultural conditions subindex: Rebounded significantly by 28 points to 46, reflecting the easing of El Niño effects and optimism for beneficial La Niña conditions expected later in the year and into the 2024/2025 summer season.
On the financial front: These subindices are interpreted differently as a decline is viewed as favourable while an increase signals increasing financial strain.
- Debtor provision for bad debt subindex: Rose by 3 points to 31, indicating increased financial strain, particularly among businesses involved in summer grains.
- Financing costs subindex: Declined by 4 points to 23, suggesting anticipation of lower interest rates ahead, crucial for the sector managing over R205 billion in farm debt.
These insights illustrate the varied sentiments and economic conditions shaping the agribusiness landscape during Q2 2024, influenced by both environmental factors and financial considerations.
Concluding remarks
Despite some subsectors showing promising performance early in the year, lingering pessimism persists within the agricultural sector. This sentiment largely stems from the significant impact of the mid-summer drought and ongoing inefficiencies in network industries.
“While the farming sector expressed concerns about the political landscape during the survey period, the response to the formation of the Government of National Unity has been generally positive, reflected in optimistic financial market reactions,” noted Wandile Sihlobo, chief economist of the Agricultural Business Chamber of SA (Agbiz). This perspective highlights a cautious outlook within the agricultural industry, influenced by both immediate challenges and broader political developments shaping future expectations.
Source: www.agbiz.co.za, Issued by: Wandile Sihlobo, Chief Economist (AgbizMarch 2024)
Agriculture budget vote speech
On 16 July 2024, Agriculture Minister, John Steenhuisen delivered his agriculture budget vote speech. Overall, feedback on the speech is positive which might have a positive impact on the above-mentioned Agribusiness Confidence Index which was the lowest in many years.
The minister highlighted the continuity and enhancement of South Africa’s Agricultural and Agro-processing Master Plan (AAMP), adopted in 2022. The focus will be on accelerating the AAMP’s objectives, particularly through its “value chain deep dives” and commodity corridor approach, particularly in underdeveloped regions like the Eastern Cape, Limpopo, and KwaZulu-Natal. Clear communication and inter-departmental cooperation are crucial for success.
The AAMP relies on partnerships with the private sector, labour, and other social partners to leverage existing resources and knowledge. Financial support, especially through the Blended Finance Scheme, is vital for new entrant farmers. The Department has partnered with several financial institutions to provide affordable finance.
The commitment to biosecurity and improving animal health was also reaffirmed, given its significance to the livestock and poultry sectors. Furthermore, the success of the AAMP depends on collaboration with the Departments of Land Reform and Rural Development, and the efficient operation of the proposed Land Reform Agency to enhance land access and open new markets for South African agricultural products.
The potential benefits this holds for all South African farmers include: Accelerated implementation of AAMP; enhanced regional development; increases access to finance; support for innovation; strengthened biosecurity; improved land access and new market opportunities. These benefits collectively aim to foster a more inclusive, innovative, and prosperous agricultural sector in South Africa.
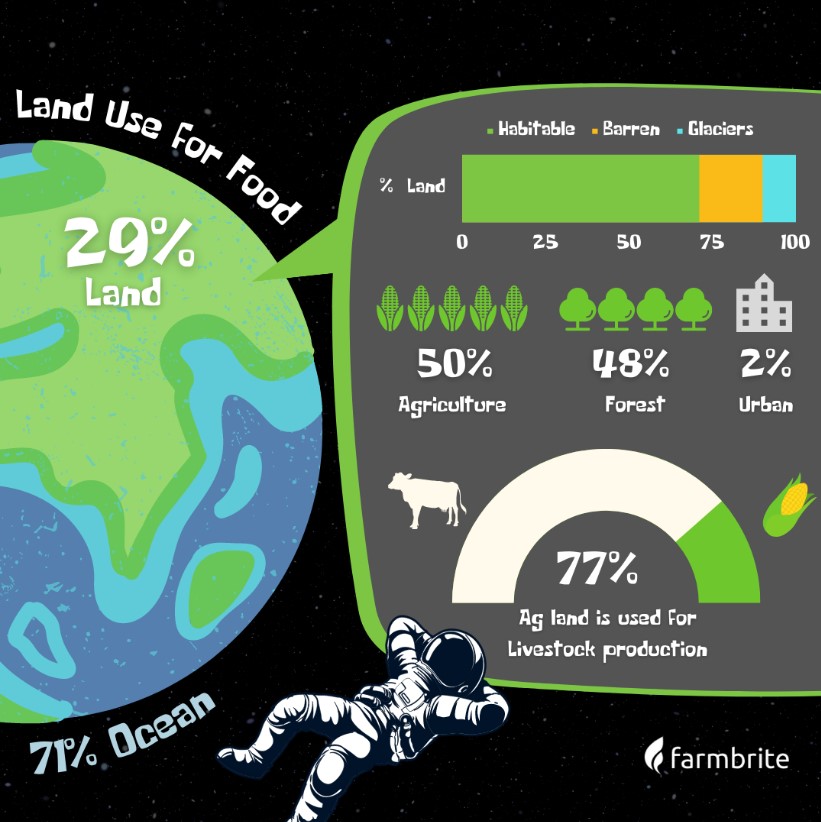
Fact of the month
50% of the habitable land on earth is used for farming. The area used for agriculture collectively amounts to around 51,8 million square km (± 20 million square miles). Livestock occupies the majority of the world farmland with 77% (±3,7 billion hectares) and crop lands occupy 23% (±1,1 billion hectares) of the agricultural land use.
Weather and climate
NATIONAL ASSESSMENT
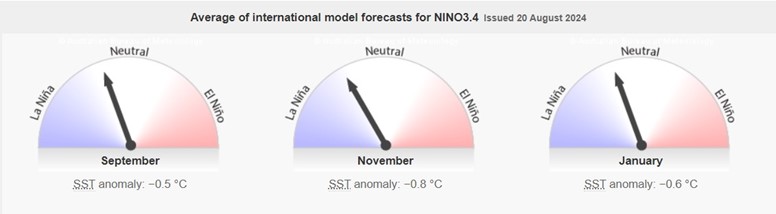
The El Niño–Southern Oscillation (ENSO) neutral phase is expected to continue for the next several months (at least until early spring), with borderline La Niña conditions to emerge during the Spring season (October to December).
The Bureau’s ENSO Outlook remains at La Niña Watch due to early signs that an event may form in the Pacific Ocean later in 2024. A La Niña Watch does not guarantee La Niña development. The chance of a La Niña developing in the coming season has increased.
When La Niña Watch criteria have been met in the past, a La Niña event has subsequently developed around 50% of the time. When looking at Mid-August predictions the chance of a La Niña developing from September to November (SON) is 41%. The current sea surface temperatures (SSTs) for September to January range from -0,5°C to -0,8°C.
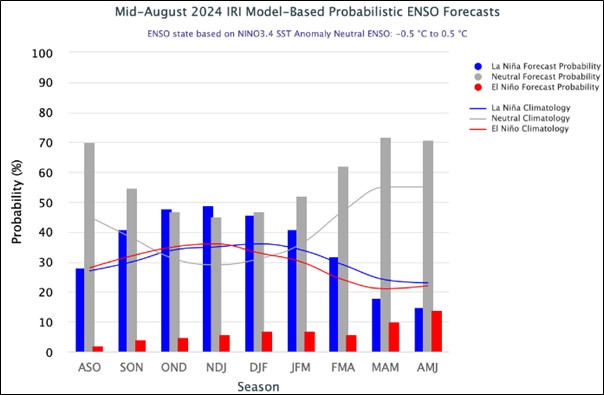
Source:https://iri.columbia.edu/our-expertise/climate/forecasts/enso/current/?enso_tab=enso-iri_plume
The graph below reflects the current neutral conditions and the ocean temperatures that are starting to get cooler near the equator. More rain can possibly be expected later during the year as temperatures start to subside.
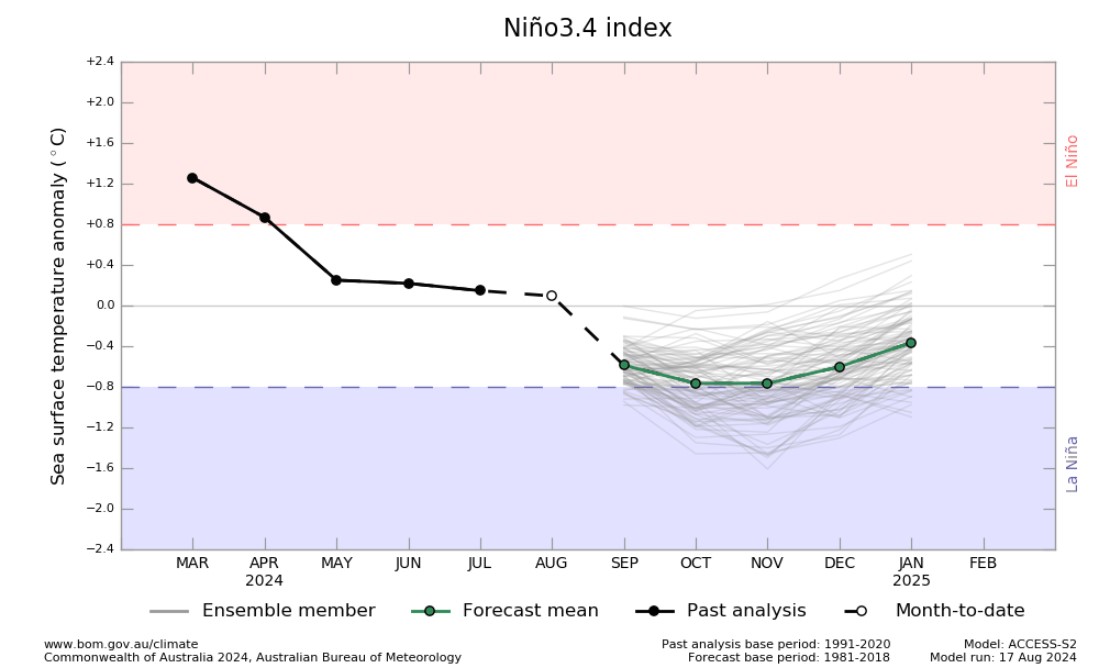
http://www.bom.gov.au/climate/model-summary/#tabs=Bureau-model®ion=NINO34
The latest Climate Watch issued by the SA Weather Service (1 August 2024) predicts below-normal rainfall is forecasted for most parts of the country in the early spring and mid- to late spring seasons, with the exception of some areas in the Free State Province.
Conversely, above-normal rainfall is expected in most parts of the summer rainfall regions, except for the Limpopo Province, during the early summer season (OND). This above-normal rainfall forecast for these summer rainfall regions will likely have a positive impact on crop and livestock production. However, below-normal rainfall is predicted over the Limpopo region during the early summer period.
Therefore, it is recommended that the relevant decision-makers advise farmers in this region to implement soil and water conservation measures, proper water harvesting and storage techniques, establish effective drainage systems, and adopt other appropriate farming practices.
Source: https://www.weathersa.co.za/Documents/SeasonalForecast/SCOLF202407_01082024095021.pdf
SUNSPOTS
Sunspots are darker, cooler areas on the surface of the sun that arise due to disturbances in the sun’s magnetic field. Every 11 years, the number of spots dotting the surface of the sun increases and decreases and forms the solar cycle.
Sources: https://www.sciencedirect.com/science/article/abs/pii/S136468262200116X#:~:text=It%20was%20observed%20that%20rainfall,an%20increasing%20effect%20on%20rainfall
https://www.space.com/solar-cycle-frequency-prediction-facts May 27,2022.
https://eos.org/articles/why-did-sunspots-disappear-for-70-years-nearby-star-holds-clues 10 June, 2022
According to science direct the rainfall rate is directly related to the sunspot number, but shows different characteristics during solar maximum years. Though a lag correlation exists between sunspot number and rainfall, sunspots have an increasing effect on rainfall. Studies show that the more sunspots are present the higher the rainfall and the less sunspots the lower the rainfall.
ENSO occurs at irregular intervals between three and seven years causing global climate system variation. Considering this event occurs periodically, it might be triggered by the 11-year solar cycle as an energy source.
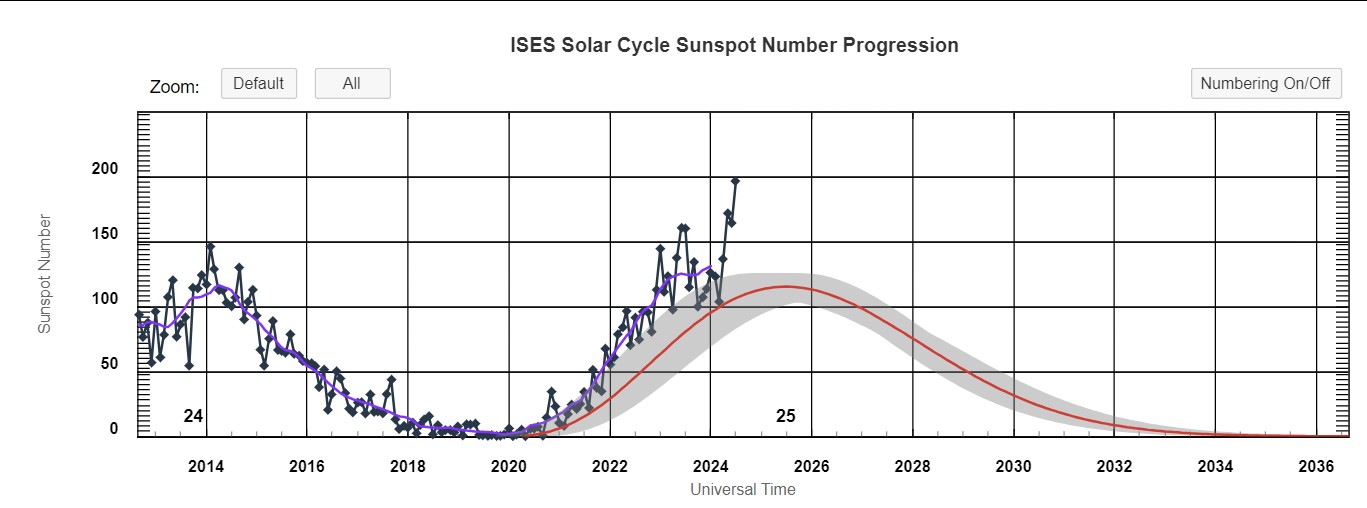
The graph below shows the 11-year solar cycles since before the 2000s. As the graph is in an upward trajectory higher rainfall can be expected – La Niña. As the graph reaches its turning point and moves in a downward trajectory less rainfall is expected characteristic of an El Niño.
The last three years were La Niña years and as the graph is approaching its forecasted turning point in August 2024 an El Niño can be expected for the coming years. ENSO indicators are currently at neutral and a La Nina is expected to form later this year. From March 2021 to July 2024 the actual sunspot numbers were higher than the predicted values.
The conclusion can be made that the sunspots are not yet at their downward turning point. When the sunspots are in an increasing phase it means more rainfall and when in a decreasing phase it usually means less rainfall.
https://www.swpc.noaa.gov/products/solar-cycle-progression
LONG-TERM CLIMATE RISKS TO THE PRODUCTION OF ESSENTIAL COMMODITIES
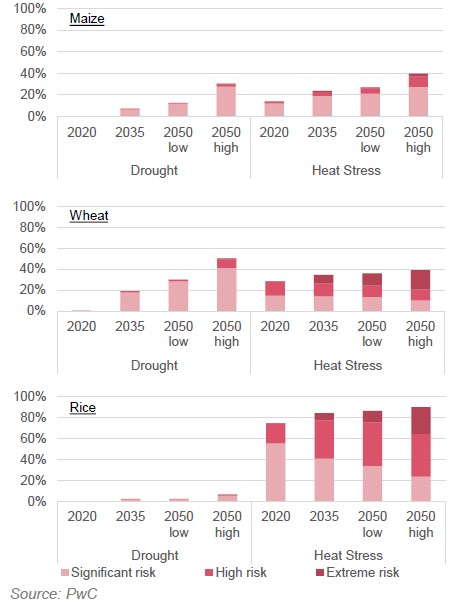
The sixth South Africa Economic Outlook report of 2024 focuses on the risk that drought and heat stress pose to the production of nine essential commodities. The PwC report ‘Climate risk to nine key commodities: Protecting people and prosperity’ considered climate-related risks faced by the global producers of nine essential commodities.
Climate change has become a real and present threat to companies that depend on these commodities. Drought and heat stress will impact the availability of these commodities, in South Africa and other countries that need these commodities to produce material and food products essential for economic development and human wellbeing.
While the PwC report focuses on nine commodities that are essential for transport, construction, manufacturing, nutrition and green transition, we will mainly be focusing on the three key crops and how climate change poses a serious and growing threat to the world’s ability to produce these commodities. These three agricultural commodities are at risk of both drought and heat stress going forward. Farming is the world’s thirstiest industry, accounting for 70% of the world’s freshwater consumption. Water is particularly critical in the cultivation of these three key crops and the absence of it (drought) for irrigation poses an existential threat.
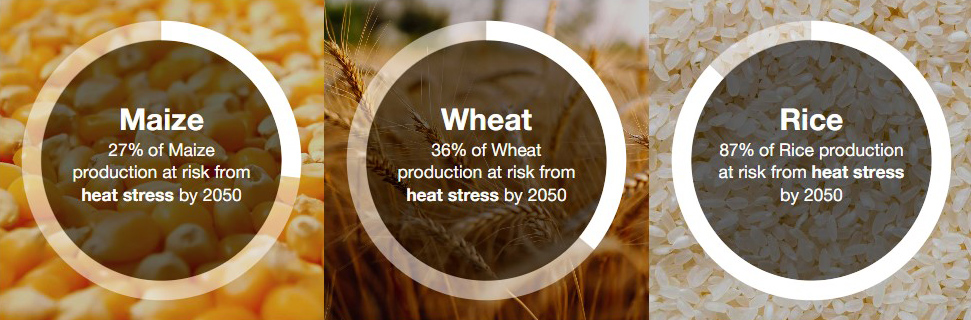
These three key crops are maize, rice, and wheat. Maize is the most produced cereal in the world and the second most produced crop. 80% of maize is used to feed humans. Its indirect channel (via animals) through which humans consume maize makes this a key global crop. Rice holds the second place for most produced cereal in the world and supplies 20% of the world’s dietary energy. The crop is the primary source of nutrients for more than 3 billion people. The third most produced cereal for human consumption is wheat. The cultivation of this crop takes up the largest land area globally, with around 217 million hectares.
While droughts can reduce crop yields exponentially, workers in the agriculture sector are particularly at risk from heat stress, and climate change will increasingly expose outdoor workers to heat. It is estimated that in 2035 some 24% of maize, 35% of wheat and 84% of rice cultivation are at significant, high or extreme risk of heat stress globally.
Farm workers often spend large numbers of hours outdoors where they are directly exposed to the impacts of heat and humidity. Research done by the International Labour organization (ILO) shows a global temperature rise of 1,5°C could result in a 2,2% reduction in total labour hours in shaded areas by 2030, the productivity loss will be the equivalent of 80 million full-time jobs. In areas exposed to full sun, a similar rise in temperature could result in 3.9% reduction in total labour hours, the equivalent to 136 million full-time job losses.
Maize, rice and wheat are the primary food source for billions of people. 70% of South Africa’s food-budget is grain dependent (cereals, meat, dairy) products. If not locally farmed these commodities are imported, and whether sourced locally or abroad, our drought and heat risk forecast point to a higher cost and constrained supply associated with these cereals in the coming years. The prerogative for food producers is to secure the future supply of commodities that they need to support the country’s long-term food security.
Companies can use climate change risk assessment at the site, project and supplier levels to better understand and manage climate-related risks and opportunities. Climate scenario analysis can be used to help understand the impact of climate change. These tools can assist a company to develop a comprehensive climate strategy that describe efforts to mitigate the physical risk of climate change to the business.
Insurance companies need innovative products to turn climate risks into opportunities. Globally, some insurers have responded to severe climate risks by no longer covering them. With this growing weather-related protection gap, insurers need to understand climate risk exposure on both sides of the balance sheet, create new innovative products to turn the risks into opportunities, invest in driving the adoption of existing risk prevention solutions and collaborate with stakeholders to chart a viable path to a resilient future.
TOP FIVE RISKS CONFRONTING THE AGRICULTURE SECTOR
Allianz recently released their Allianz Risk Barometer 2024. According to their report the agriculture sector faces five concerning risks and addressing these risks are crucial for the sustainability and growth of the agriculture sector.
The top five risks and mitigating measures are discussed below, with the top risk being climate change.
1. Climate change:
With rising temperatures, shifting water patterns, and increased frequency of extreme weather events significantly impacting livestock health and crop yields. To mitigate the risk, it is advised that producers adopt sustainable practices such as crop diversification, precision farming, and water-efficient irrigation techniques.
Investing in research and development for climate-resilient crops and collaborating with governmental and non-governmental organisations to implement climate adaptation strategies are also essential.
2. Natural catastrophes:
Floods, storms and droughts among other things, can devastate crops. It can damage infrastructure and disrupt supply chains. To mitigate the risk, businesses should invest in resilient infrastructure to help ensure that buildings and equipment can withstand extreme weather events.
Installing advanced weather forecasting systems also provide crucial early warnings, allowing farmers to take proactive measures. Implementing comprehensive disaster preparedness plans can ensure that there are clear strategies in place for dealing with various scenarios. Additionally, insurance coverage tailored to agricultural risks is vital for financial protection. It can cover losses due to crop failure, equipment damage, or other disaster-related issues, helping farmers recover more quickly and resume operations.
3. Environmental risks
Water scarcity, soil degradation and biodiversity loss are new and significant threats in the industry. This can reduce agricultural productivity and sustainability. To mitigate the risk, producers are advised to adopt conservation practices such as cover cropping, integrated pest-management and no-till farming. Agricultural organisations and Governments were advised to promote policies and initiatives that supported sustainable land and water-management practices, as well as the restoration of degraded ecosystems.
4. Changes in legislation
This is a new risk for the agricultural sector. The dynamic regulatory environment could impact everything from land-use and environmental standards to trade policies and subsidies. To navigate these changes, businesses were advised to engage with policymakers, stay informed about legislative developments and participate in industry associations.
The Barometer also advised that implementing robust compliance-management systems and seeking legal advice could help ensure adherence to new regulations and minimise potential disruptions.
5. Business interruption
This risk moved down, but is still a concern for the sector. Business interruptions refer to supply chain issues, labour shortages, equipment failures etc. To mitigate the risk, Allianz recommends that agricultural businesses develop comprehensive business continuity plans, diversify their supply chains and invest in modern, reliable equipment. Regular maintenance and contingency planning are also important for minimising downtime and ensuring operational continuity.
Market risk
GRAIN MARKET ANALYSIS
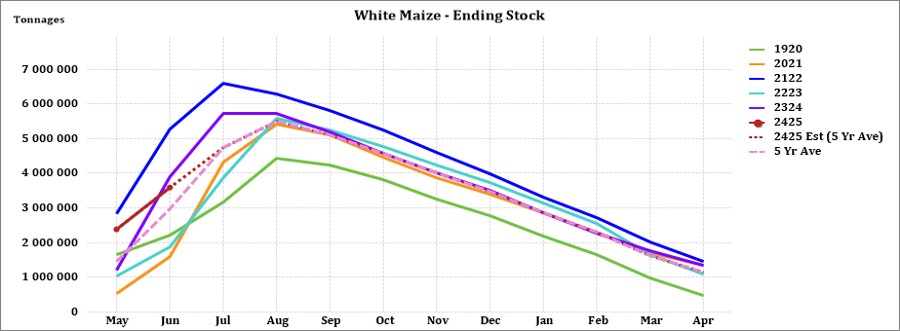
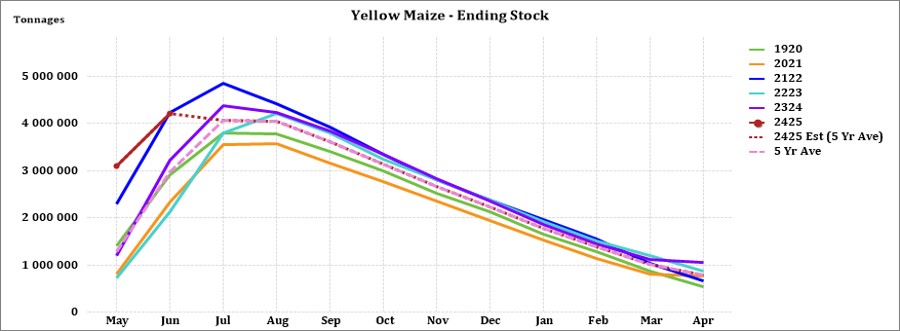
• Ending stock – National
Ending stock data is gathered from the NAMC. The estimates are reassessed and reported by the Grain & Oilseeds supply & demand estimates committee. The following is the projected ending stock for April 2025 in tonnages for the 2024/2025 season:
- White maize => 452 084 t
- Yellow maize => 905 348 t
The following is a summary of September 2024 ending stock projections for the 2023/2024 season:
- Wheat => 620 859 t
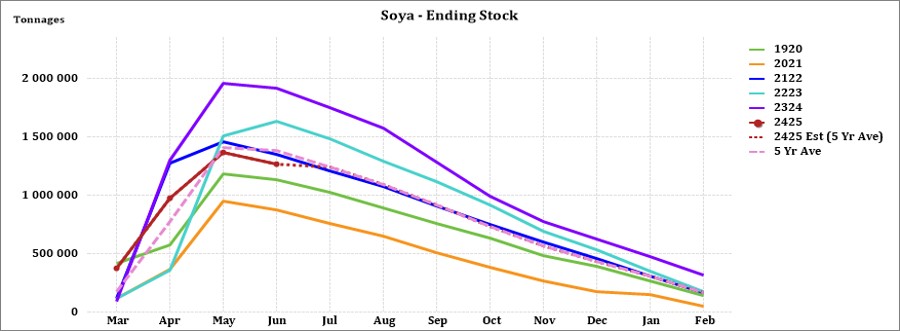
The following is a summary of February 2025 projected ending stock for the 2024/2025 season:
- Sunflower => 65 444 t
- Soybeans => 103 527 t
- Sorghum => 68 588 t
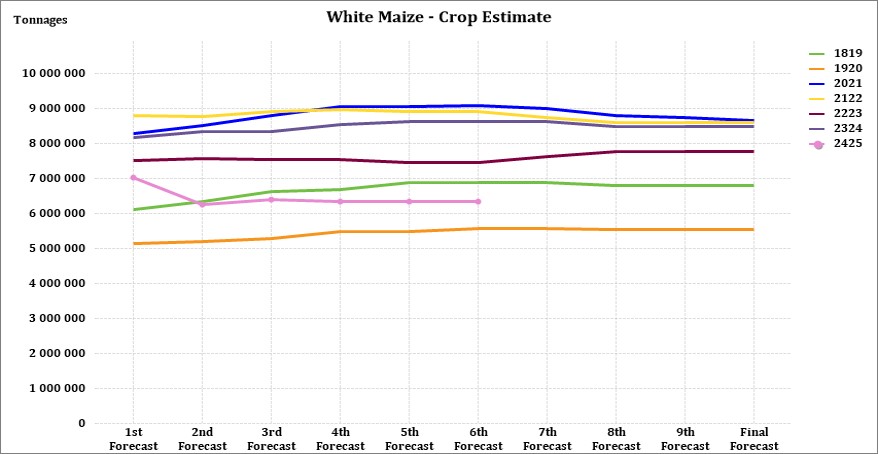
The graphs below show the predicted ending stock for the different commodities according to SAGIS data. A five-year average has been calculated to determine the estimated ending stock for the current season. The predicted white maize in April 2025, is 894 792 t less than the final for the 2023/2024 season. Yellow maize shows a 152 316 t decrease in ending stock compared to the previous season.
The predicted soybean ending stock for 2024/2025 is 151 551 t less than the previous season ending stock.
The predicted sunflower ending stock for the 2024/2025 season is 41 396 t less than the previous season ending stock.
Crop estimations
According to the Crop Estimate Committee (CEC) sixth production forecast for 2024, the total area estimate for maize in South Africa is 2,636 million ha, which is 1,94% more than the actual 2,586 million ha planted for the previous season. The forecasted tons are revised downwards with 71 250 t from the fifth forecast.
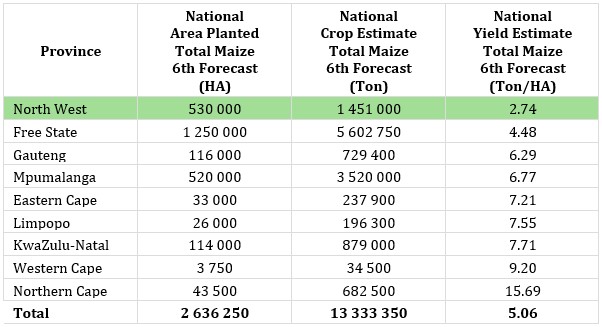
Source: CEC (Crop Estimates Committee)

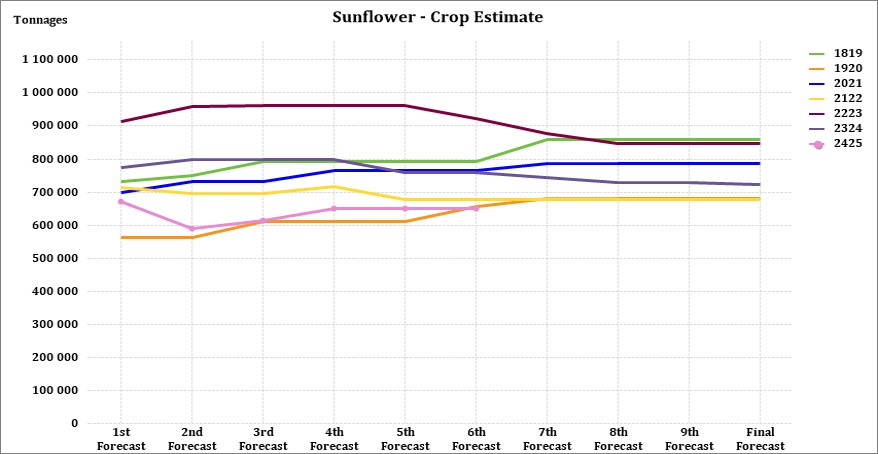
The production forecast for sunflower remained unchanged at 649 250 t, but it is still 9,83% less than the previous forecast of 720 000 tons. The area estimate for sunflower seed is 529 000 ha while the expected yield is 1,23 t/ha.
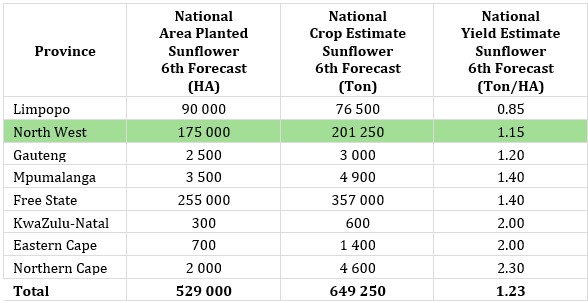
Source: CEC (Crop Estimates Committee)
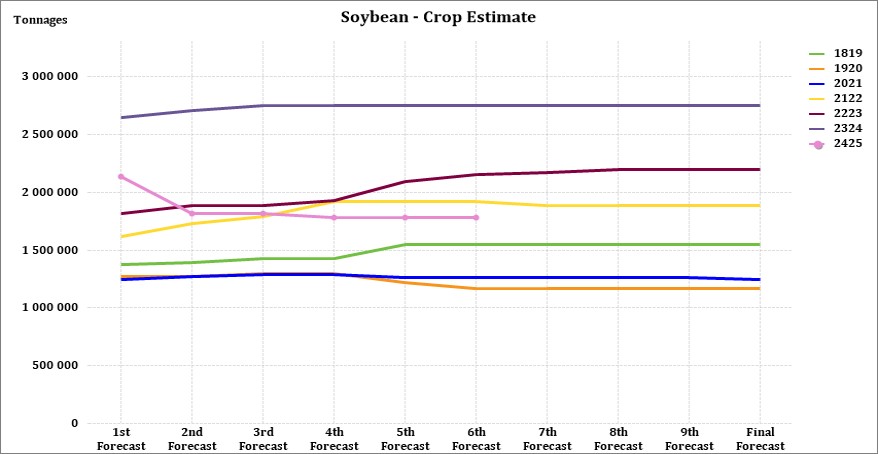
The production forecast for soybeans is 1,778 million tons, 35,78% less than the previous season. The estimated area planted to soybeans is 1,151 million ha with an expected yield of 1,55 t/ha.
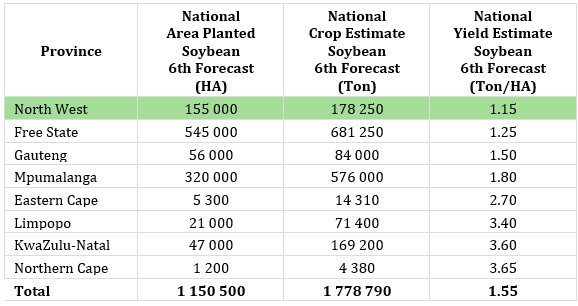
Source: CEC (Crop Estimates Committee)
• Imports and exports – National
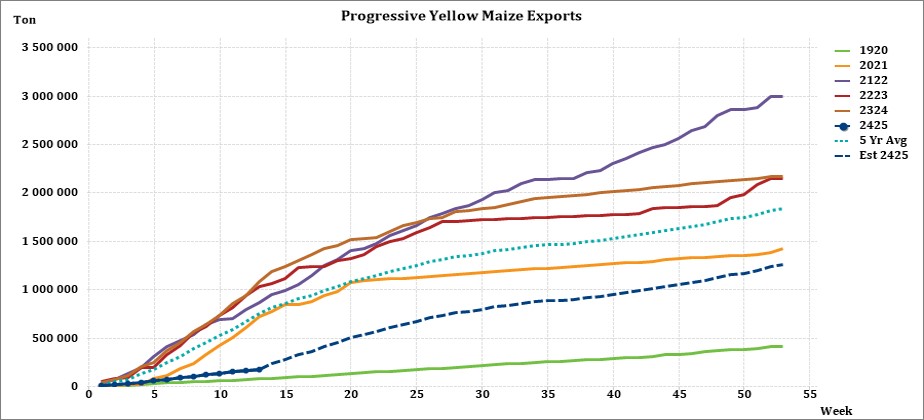
For the production season ending April 2025, 345 902 t of white maize and 179 273 t of yellow maize have been exported to date (week 13 of 52) as seen in the graphs below.
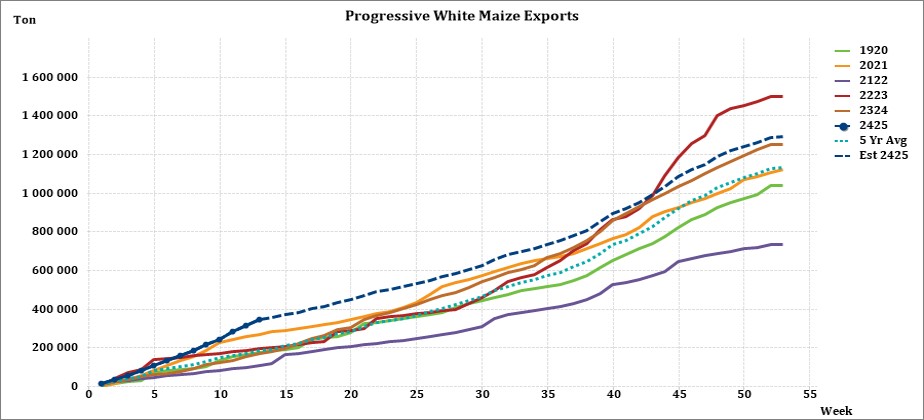
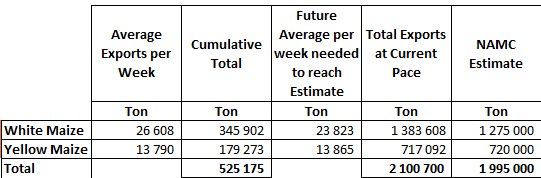
As seen in the table above, the average white maize exports per week are currently 26 608 t. If theoretically, white maize exports remain at the current average per week then there would be 108 608 t more white maize exports than anticipated.
The average yellow maize exports per week are currently 13 790 t. If theoretically, yellow maize exports remain at the current average per week then there would be 2 908 t less yellow maize exports than anticipated.
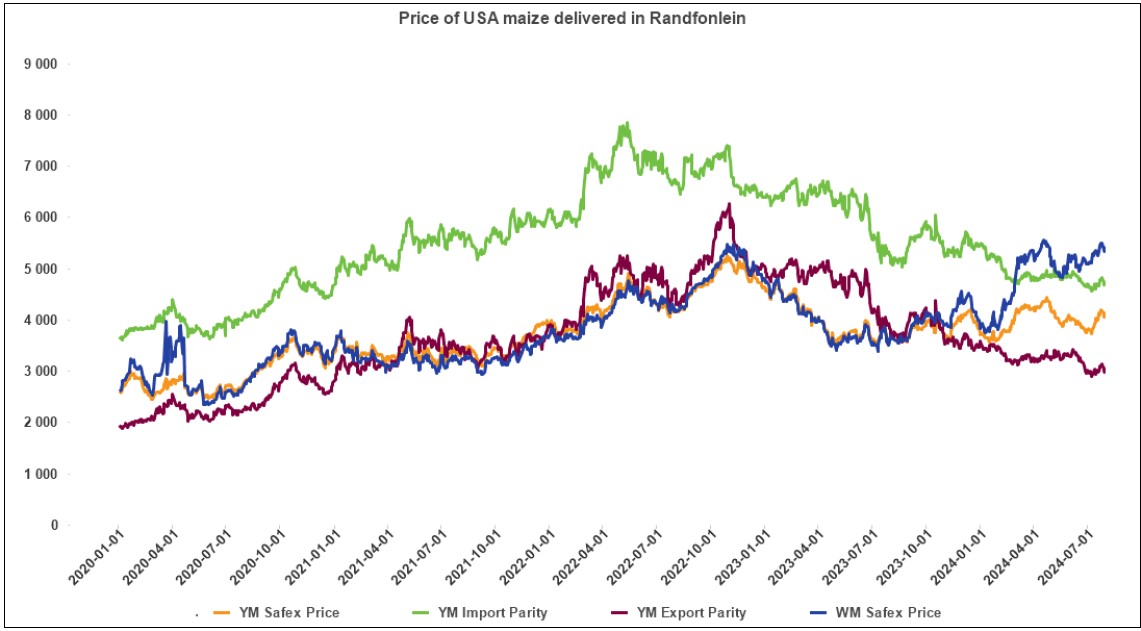
• Parity prices
South Africa is a small producer compared to other countries and is thus a price taker (meaning that we cannot influence world prices). Because of this, our local prices are normally between import and export parity, which is illustrated in the figure below. An import parity price is defined as the price which a buyer will pay to buy the product on the world market. This price will include all the costs incurred to get the product delivered to the buyer’s destination.
An export parity price is defined as the price that a local seller could receive by selling his product on the world market e.g., excluding the export costs. The price which the seller obtains is based on the condition that he delivers the product at the nearest export point (usually a harbour) at his own expense.
The graph below reflects the Safex price, import parity and export parity of yellow maize as well as the SAFEX price of white maize. The import and export parity prices for white maize is not released by Grain SA for this period.
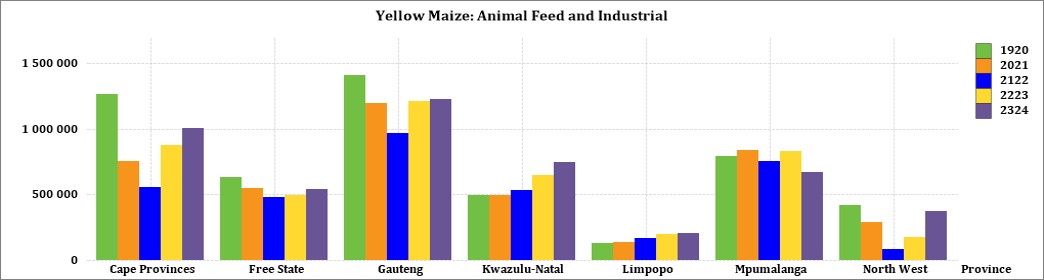
• Grain processing per province
For the marketing year which is May to April (2023/2024), the Free State province dominates the white maize that is used for human consumption and gristing. North West consumed the second most white maize produced for human consumption for the marketing year.
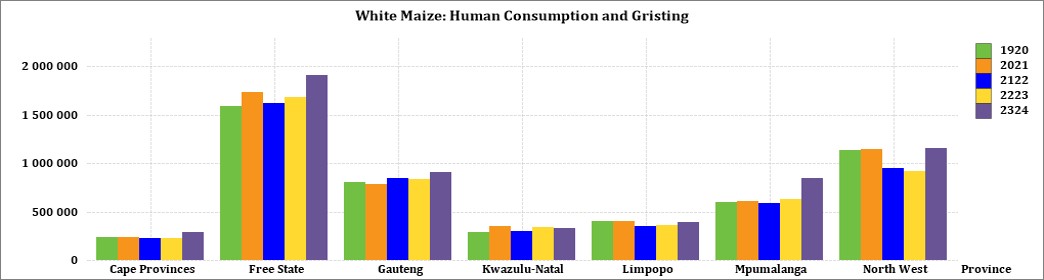
The Cape Provinces used the most white maize for animal feed and industrial usage with North West using the second most.
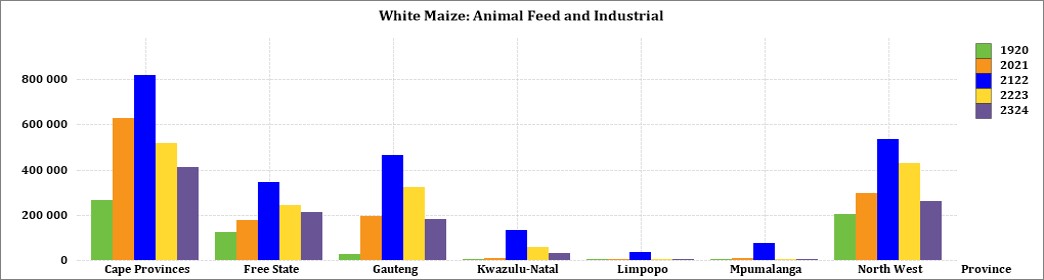
Mpumalanga processed the most yellow maize for consumption and gristing and Gauteng processed the most yellow maize for animal feed and industrial purposes.
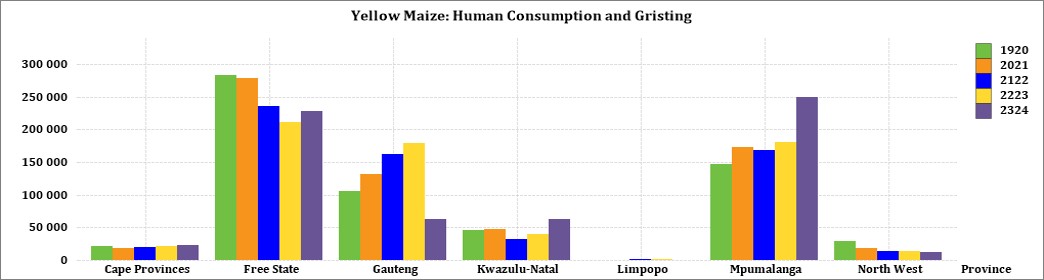
Source: Sagis
• Exchange rate
NWK Group is exposed to foreign exchange rate risk in various business areas, such as commodity prices and trade imports, etc.
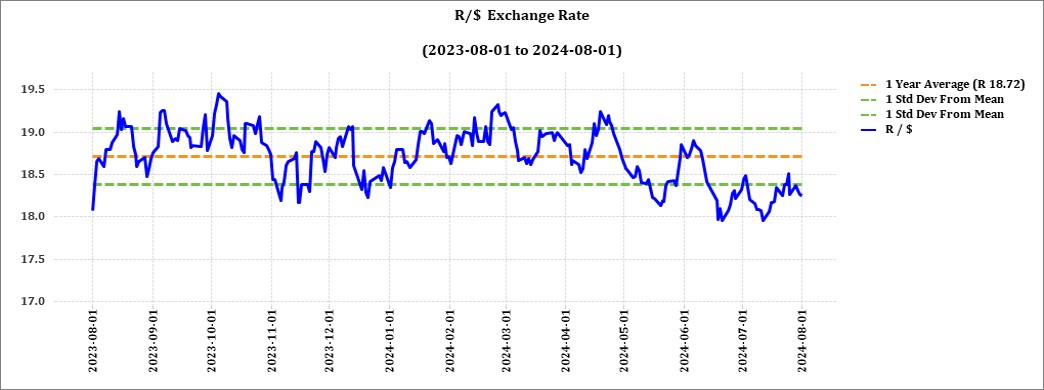
The Rand traded at a monthly average of R18,26 against the dollar for the month of July. This is better than a year earlier in July 2023. In early August the rand tumbled nearly 2% to 18,6 per USD due to growing concerns that the US economy could be heading for a recession. Economists and analysts are predicting an interest rate cut in South Africa next month.
Source: Trading Economics
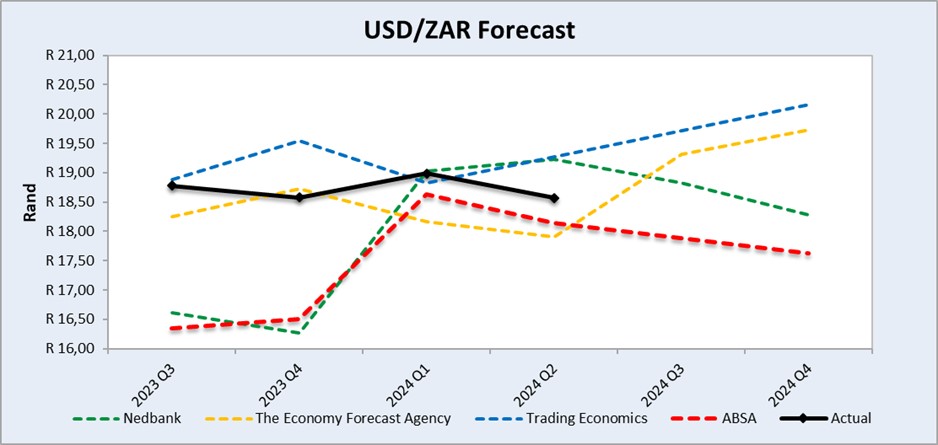
Source: Nedbank CIB; The Economic Forecast Agency; Trading Economics
The graph above shows the actual USD/ZAR for 2023 Quarter 3 (Q3) to 2024 Quarter 4 (Q4) against the forecasted figures.
• Interest rate risk
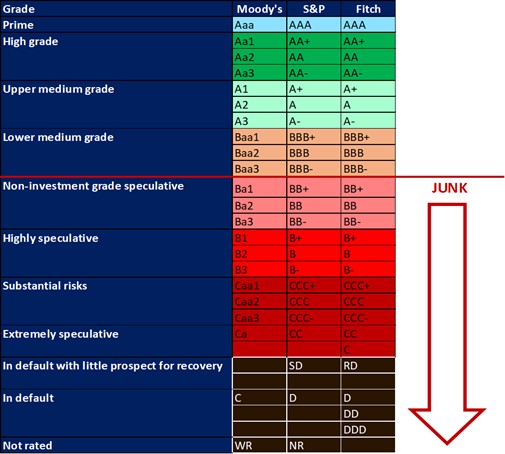
On 27 March 2020, Moody’s downgraded South Africa’s sovereign credit rating to sub-investment grade and placed a negative outlook on the rating. The key drivers for this downgrade include weak economic growth, continuous deterioration in fiscal strength, and slow progress on structural economic reforms. It is now the first time in post-apartheid South Africa that all major rating agencies, i.e., Moody’s, Fitch, and S&P, have South Africa’s credit ratings in sub-investment grade territory. More than a year later and our Moody’s rating remains the same.
During the previous Monetary Policy Committee (MPC) meeting held on 18 July the committee decided that interest rates will remain unchanged. The repo rate is currently 8,25% and the prime rate is 11,75%. The South African Reserve Bank made several interest rates cuts to bring relief to the economy after Covid-19, but since November 2021 borrowing costs rose again by a cumulative 475 bps.
Interest rate movement:
- 26th January 2023 – 10,75%
- 30th March 2023 – 11,25%
- 25th May 2023 – 11,75%
- 20th July 2023 – 11,75%
- 21th September 2023 – 11,75%
- 23rd November 2023 – 11,75%
- 27th March 2024 – 11,75%
- 30th May 2024 – 11,75%
- 18th July 2024 – 11,75%
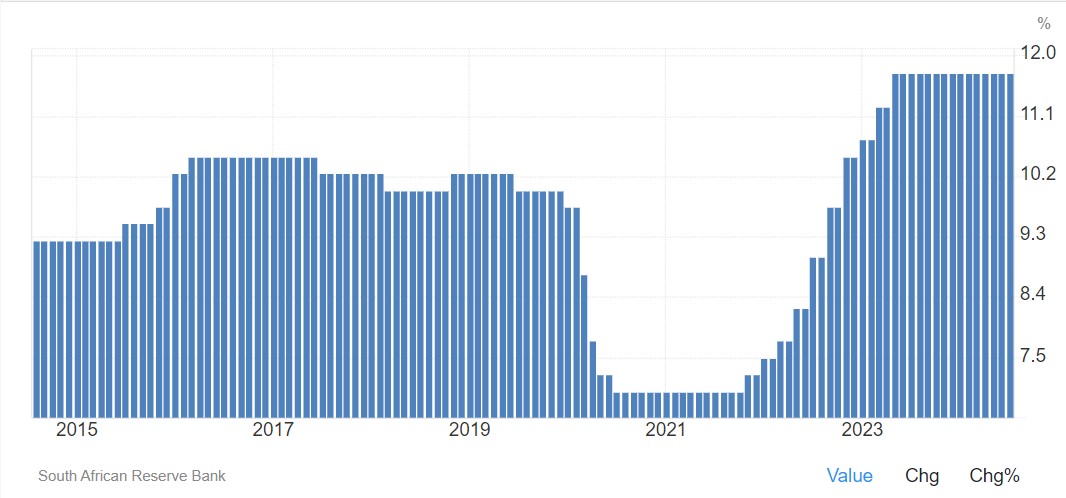
Lending rate in South Africa remained unchanged at 11,75% in July. Lending rate in South Africa averaged 11,43% from 1950 until 2024, reaching an all-time high of 25,5% in August of 1998 and a record low of 5% in February of 1950.
Source: South African Reserve Bank
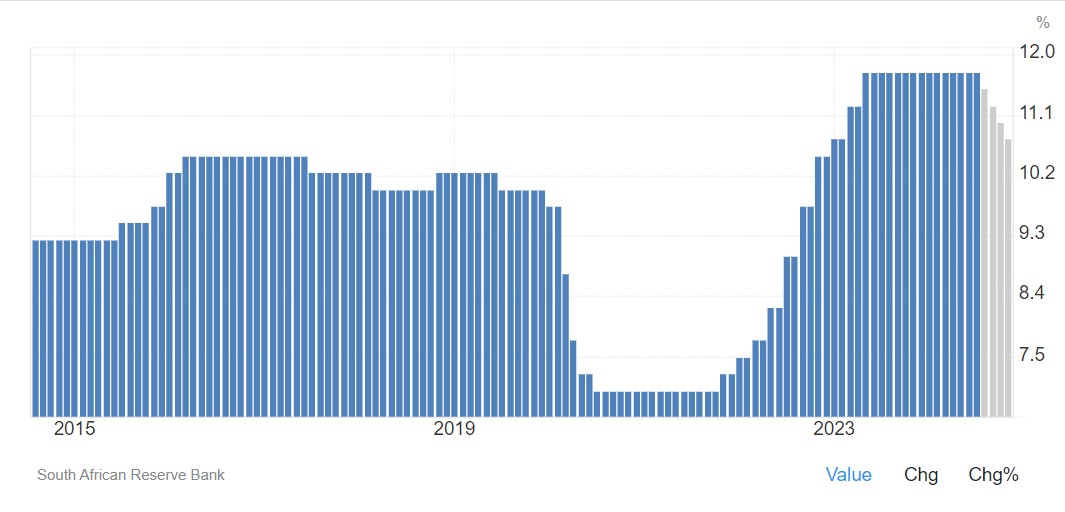
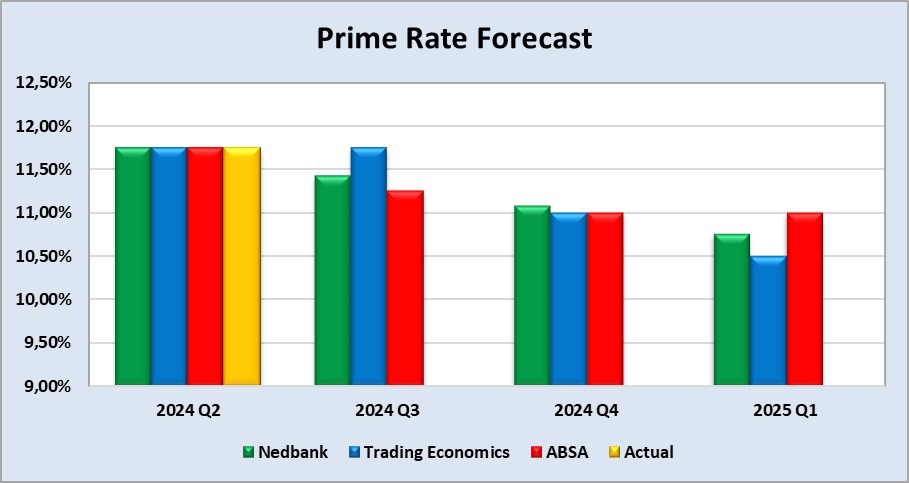
Lending rate in South Africa is expected to be 11,5% by the end of this quarter, according to Trading Economics global macro models and analysts’ expectations. In the long-term, the South Africa lending rate is projected to trend around 10,5% in 2025 and 9,5% in 2026, according to our econometric models.
Source: Trading economics
The following graph shows the prime rate forecast for 2024 Quarter 2 to 2025 Quarter 1.
• Inflation rate
As the inflation rate is a driver for increases and decreases in interest rates the current rate and forecast have to be assessed to foresee further increases in the interest rate.
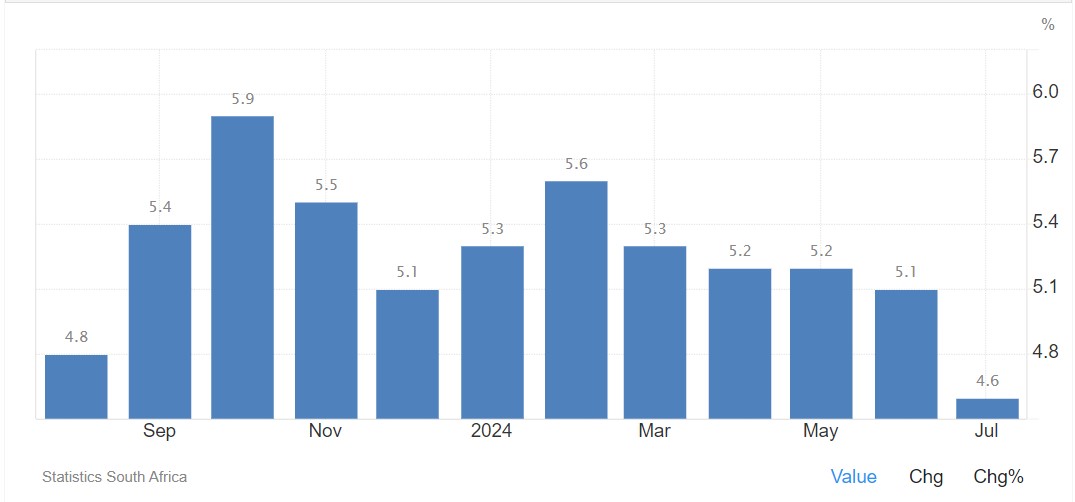
Current: The annual inflation rate for South Africa fell for the second month to 4,6% in July 2024, the lowest in three years, down from 5,1% in June, and edging closer to the central banks preferred target of 4,5%.
The decrease was driven by lower annual rates in several CPI categories, most notably food and non-alcoholic beverages (4,5% in July vs 4,6 in June), transport (4,2% in July vs 5,5% in June), and housing and utilities (5,3% in July vs 5,5% in June).
The annual core inflation rate, which excludes volatile items such as food, non-alcoholic beverages, fuels, and energy, eased to an over two-year low of 4,3% in July, down from 4,5% the previous month. On a monthly basis, the consumer prices grew by 0,4% in July, following a 0,1% increase in the prior period (June).
Source: Statistics South Africa
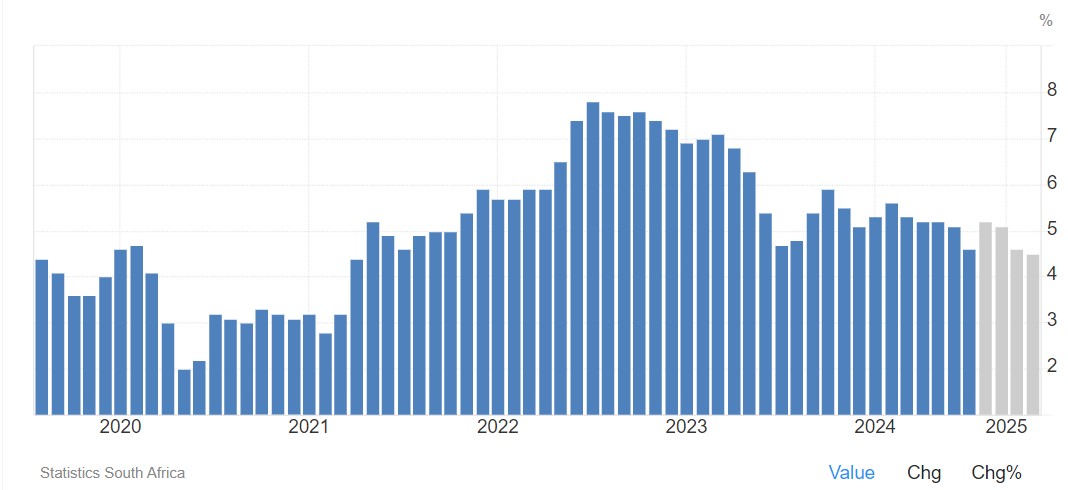
Inflation rate in South Africa decreased to 4,60% in July from 5.10% in June of 2024. The South Africa inflation rate is expected to be 5,20% by the end of this quarter. In the long-term, inflation rate is projected to trend around 4,50% in 2025, according to Trading Economics’ econometric models.
Source: https://tradingeconomics.com/south-africa/inflation-cpi
• Warnings of a possible Black Swan event
Mark Spitznagel, a black-swan investor, warns of an imminent and severe stock market crash. He believes the ongoing market rally has created the “greatest bubble in human history,” similar to the dot-com bubble of 2000. Spitznagel attributes the impending crisis to the government’s $34 trillion debt, which he argues will hinder the Federal Reserve’s ability to mitigate the effects of the crash and stave off a recession. He predicts that stocks could lose over half their value, and his fund, Universa Investments, has profited from previous market downturns. Spitznagel has been forecasting a crash since January 2023 and now sees a clearer timeline, suggesting a recession could occur by the end of the year.
Warren Buffett’s favoured market valuation tool, the Buffett Indicator, which compares the total market cap of US stocks to GDP, is at an all-time high of 200%, indicating that stocks are dangerously overvalued. Historically, when this ratio approaches such levels, it signals a significant risk, as seen during the dot-com bubble in 2000. Analysts like Paul Dietrich and Chris Bloomstran caution that despite some flaws, the indicator suggests the stock market is at a precarious peak. Bloomstran notes that the structural changes in the economy, such as higher corporate profit margins and a more globalized economy, mean the indicator must be interpreted with an understanding of these nuances. Nonetheless, he warns that the current high reading suggests that owning cap-weighted indices like the S&P 500 is particularly risky.
If Mark Spitznagel’s and Warren Buffet’s predictions of an impending market crash were to come true, it would have significant implications for South Africa’s economy. Here are some potential effects:
Economic impact
1. Stock market decline:
- South Africa’s stock market would likely see a decline in line with global markets. This could erode wealth, affect investor sentiment, and reduce the value of retirement and savings funds.
2. Currency depreciation:
- The South African Rand could weaken against major currencies as investors seek safer assets. This would increase the cost of imports and contribute to inflation.
3. Inflation:
- A weaker Rand would make imported goods more expensive, leading to higher inflation. This would affect the cost of living and reduce disposable income for consumers.
4. Interest rates:
- The South African Reserve Bank might increase interest rates to combat inflation and support the currency, making borrowing more expensive for businesses and consumers.
Social and political impact
- Unemployment: Economic downturns typically lead to higher unemployment rates. South Africa, already facing high unemployment, could see even more job losses, particularly in sectors reliant on exports or those sensitive to consumer spending.
- Government debt: Higher interest rates and a weaker economy would increase the cost of servicing South Africa’s debt. This could lead to higher taxes or reduced public spending on services and infrastructure.
- Social unrest: Economic hardship often leads to increased social unrest. Rising unemployment and inflation could lead to protests and increased crime rates, challenging social stability.
Sectoral impact
- Export sectors: Key export sectors, like mining and agriculture, could be negatively impacted by global demand fluctuations and currency volatility. This would reduce export revenues and impact GDP growth.
- Financial services: Banks and financial institutions would face higher default rates on loans and mortgages, reducing their profitability and potentially leading to stricter lending criteria.
- Tourism: A global economic downturn would likely reduce international travel, impacting South Africa’s tourism industry, which is an important source of revenue and employment.
Potential mitigation strategies
- Diversification: Diversifying the economy away from reliance on volatile sectors could help mitigate the impact. This could involve investing in technology, manufacturing, and renewable energy sectors.
- Social support programs: Enhancing social safety nets to support those most affected by economic hardship could help maintain social stability and reduce the impact on the most vulnerable populations.
- Fiscal and monetary policies: The government and the South African Reserve Bank could implement counter-cyclical policies, such as targeted fiscal stimulus and monetary easing, to support the economy and protect against the worst effects of a downturn.
In summary, while a market crash could have profound negative effects on South Africa’s economy, proactive measures and strategic planning could help mitigate some of the impacts and support a more resilient economic framework.
Sources:
https://markets.businessinsider.com/news/stocks/warren-buffett-valuation-signal-flashes-warning-market-cap-gdp-ratio-2024-7
https://fortune.com/2024/07/20/black-swan-investor-mark-spitznagel-greatest-bubble-human-history-stock-market-crash-recession/
• Key focus areas for new agriculture and land reform ministers
Grain SA, an industry body, anticipates improved, depoliticised government service delivery with the newly elected political leaders and Cabinet members. They expect the Government of National Unity to support various departments in achieving goals outlined in comprehensive plans, emphasizing inclusivity through economic growth.
Key focus areas highlighted by Grain SA include:
- Support for new ministers
Ready to assist new Ministers of Agriculture and Land Reform and Rural Development.
Recognizes agriculture’s potential to sustain and create rural jobs. - Commercialisation and export-led growth
Advocates for the commercialisation of farmers and an export-led agricultural sector.
Highlights agriculture’s current contribution to social well-being and economic growth, with potential for more with proper support. - Public-private partnerships
Essential for driving growth, enhancing productivity, and fostering sustainability in agriculture.
Can improve service delivery and infrastructure development (irrigation, storage, transport). - Modern technology adoption
Promotes the adoption of modern farming technologies.
Effective partnerships can stimulate technology use, improve training, and boost competitiveness. - Market access and fair pricing
Collaboration can help access local and international grain and oilseed markets, ensuring fair prices and distribution. - Comprehensive crop insurance
Urges implementation of crop insurance schemes to mitigate agricultural risks and climate change impacts. - Activating rural economies
Emphasizes infrastructure development and rural manufacturing.
Supports rural communities through training and business opportunities, linking them to urban markets. - Safety and security
Stresses the need for creating local opportunities and ensuring safety to counteract urbanization.
Grain SA concludes that the future of South African agriculture relies on collective efforts to nurture and sustain the sector.
Source: Summarised from a Business Week article 3 July 2024
• Highlights in the agrochemical sector
China is currently the largest glyphosate supplier in the world. The dynamics of China’s glyphosate greatly impacts the global supply structure, over 80% of glyphosate produced in China is exported, to more than 20 destinations in the world.
In China, the month-to-month analysis reveals a predominantly downward trend in the prices of most herbicides, insecticides, and fungicides in Dollar terms from June 2024 to July 2024. Specifically, the tables in this section indicate a 3,7% decrease in the rand terms of glyphosate (95%) during the same period.
The depreciation of the rand over the course of a year influences local prices, causing local prices to not decrease as much as in dollar terms. It is important to note that these international decreases in prices have not been experienced in the local market.
Source: Cnchemicals
Herbicides
The following products are the main products regarding herbicides that may have an impact on input costs for producers.
Glyphosate (95%)
Acetochlor (92%)
Atrazine (97%)
Metolachlor (97%)
Trifluralin (95%)
The following comparison is from the August 2024 Grain SA report which reports the previous month’s prices.
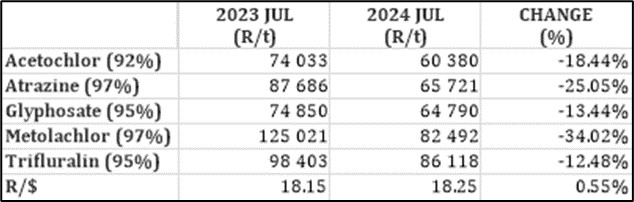
In comparison with the previous year’s prices, all of the products experienced a price decrease. Metolachlor had the biggest decrease with 34%.
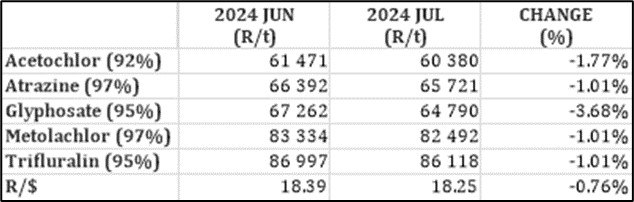
For the two months compared all of the products experienced a price decrease. Three of the products decreased with 1%. Glyphosate experienced the highest price decrease with 3,68%.
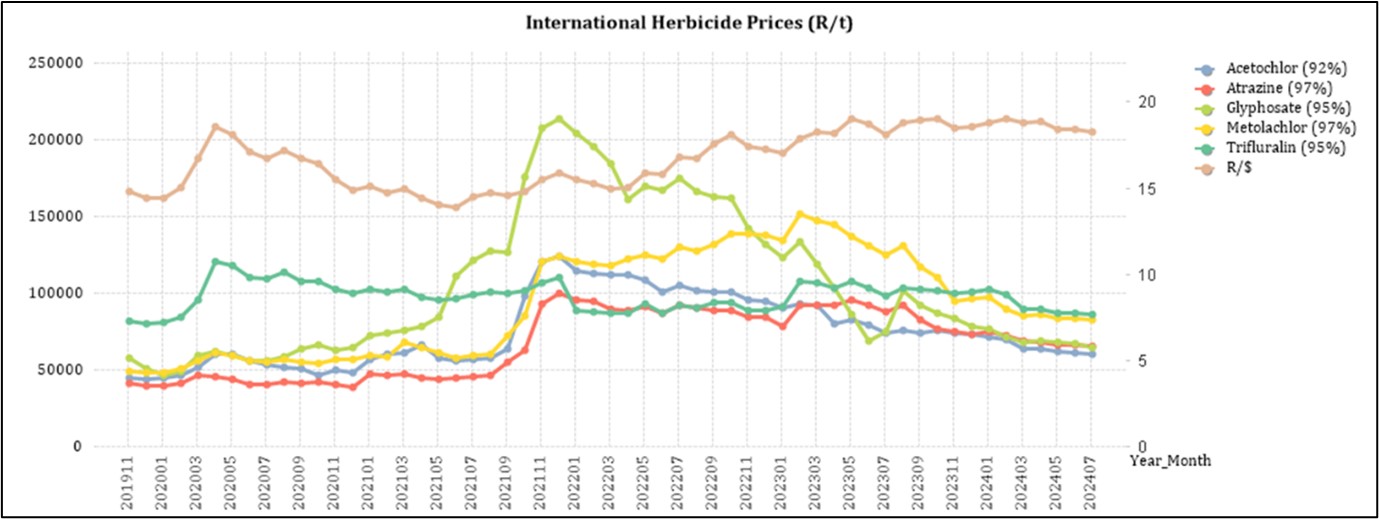
The graph below shows the international herbicides prices (R/t) per product from November 2019 to date.
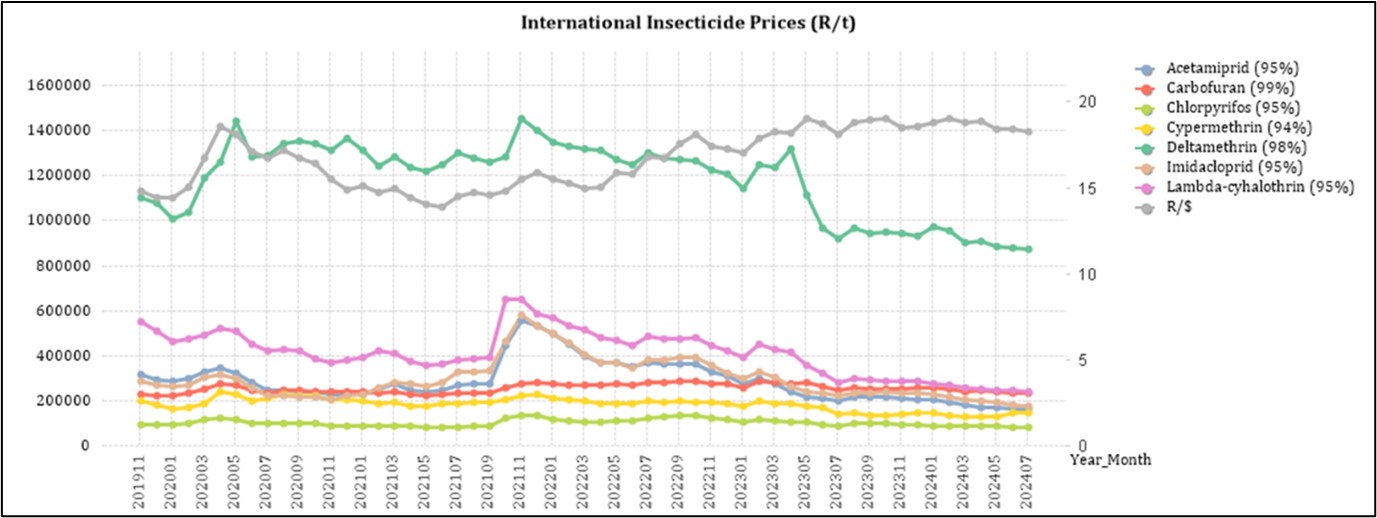
Insecticides
The following products are the main products regarding insecticides that may have an impact on input costs for producers.
Imidacloprid (95%)
Lambda-cyhalothrin (95%)
Carbofuran (99%)
Deltamethrin (98%)
Acetamiprid (95%)
Chlorpyrifos (95%)
Cypermethrin (94%)
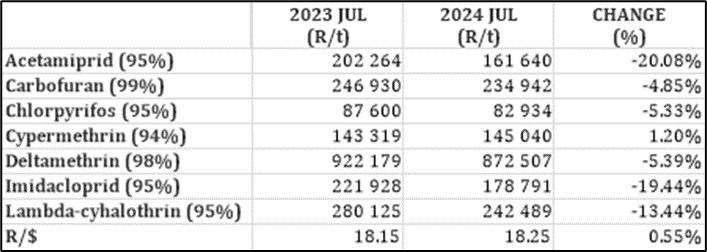
In comparison with the previous year’s prices, most of the products experienced a price decrease. The largest decrease was Acetamiprid with 20,08%.
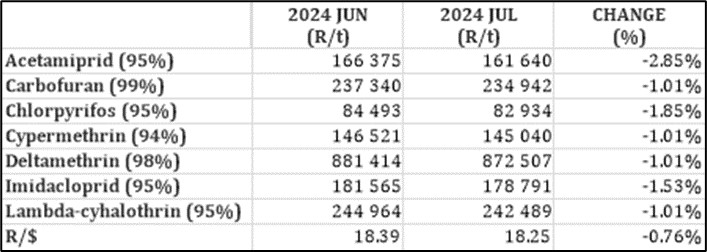
For the two months compared all of the products experienced a price decrease. Acetamiprid had the highest decrease with 2.8%.
The graph below shows the international insecticide prices (R/t) per product from November 2019 to date.
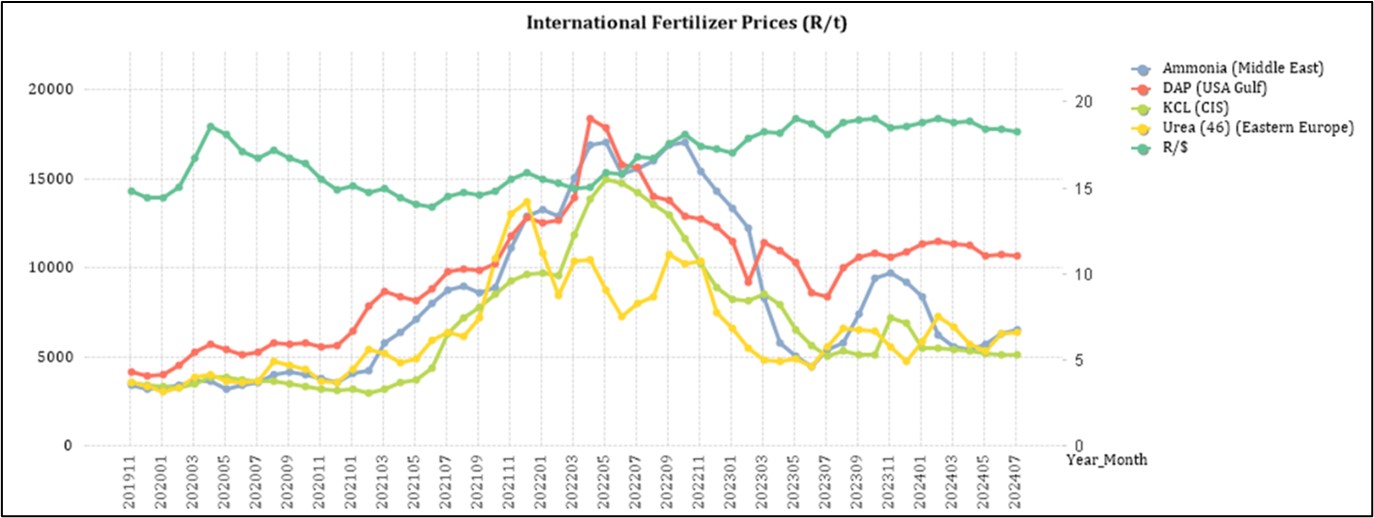
Fertiliser
The following fertiliser products are being analysed:
Ammonia (Middle East)
Urea (46%) (Eastern Europe)
DAP (USA Gulf)
KCL (CIS)
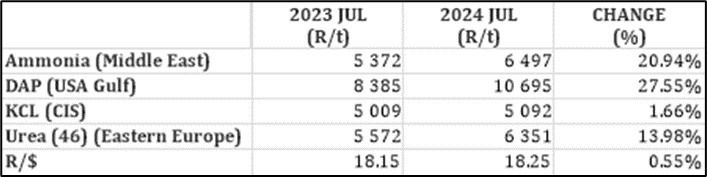
In comparison with the previous year’s prices, all of the products experienced price increases with DAP increasing the most (27,5%).
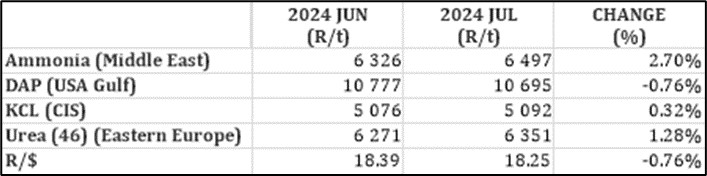
In comparison with the previous month’s prices, DAP decreased with 0,76% while ammonia increased with 2,7%.
The graph below shows the international fertiliser prices (R/t) per product from November 2019 to date.
Urea: Recent narratives about rising urea prices due to the latest Indian tender have been disproven, as prices have actually decreased this week. The market remains oversupplied, with the Indian tender expected to absorb some of the surplus and slightly tighten the market. Prices are anticipated to soften over the next week or two, with a gradual firming expected for the rest of the year.
Ammonia: Asian ammonia prices have fallen by $15/t, making it economically viable for sales from East to West. Although such trade is uncommon due to high freight costs, the current price differential justifies it. The Middle East ammonia price is in the low to mid $330/t, compared to over $560/t in Europe.
Phosphate: India is facing significant pressure to secure phosphate supplies due to strong domestic demand and low stocks. This has led to India paying $30/t more for DAP this week, with prices reaching up to $620/t CFR. While prices in other benchmark locations remain stable, the overall theme across regions is that supply is tight.
Potash: With the major annual contracts now settled, some potash volumes are beginning to increase. However, overall volumes remain lower than usual, and producers are having difficulty boosting sales. In Brazil, prices have remained unchanged this week, but there is a general sentiment that potash prices need to decrease further before significant buying activity resumes.
*CFR: Cost and Freight terms
Sources: FCurve /F Curve Insight
https://www.grainsa.co.za/upload/report_files/Chemical-and-Fertilizer-Report-Aug-2024.pdf
Source: Grain SA
According to the Central Energy Fund (CEF) diesel and petrol prices might decrease with 65c/litre and 82c/litre respectively, on 4 September.
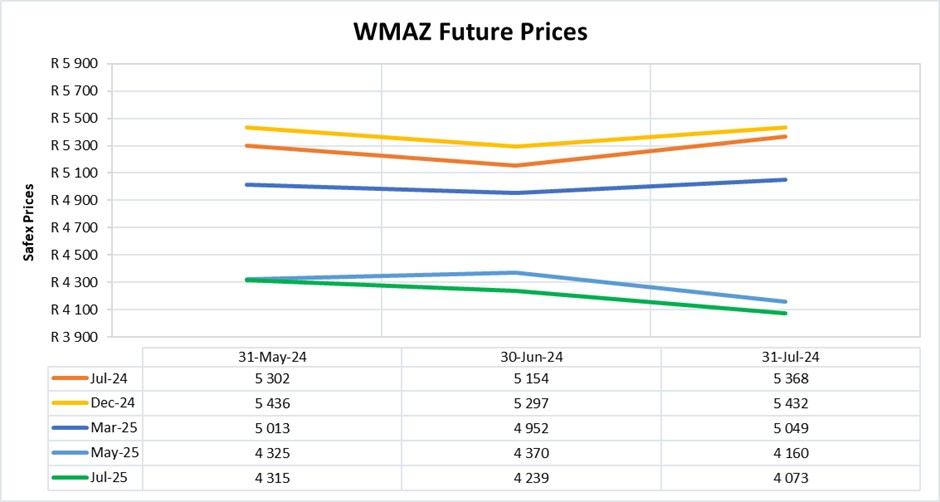
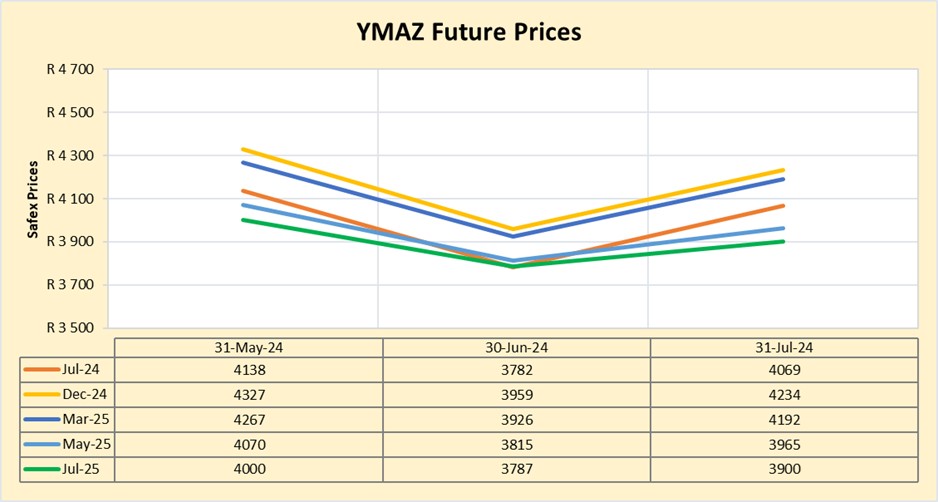
Future prices
The graphs below illustrate the market sentiment for maize, in the form of future contracts, for the upcoming contract months. The market sentiment is the expectation of supply and demand fundamentals relating to white and yellow maize in South Africa.
DOMESTIC MARKET OVERVIEW
The sixth production forecast showed no change in the production forecast for white maize and a 1,01% decrease in the production forecast figure for yellow maize, thus resulting in a 0,53% downward production forecast of total maize. The production forecast may still decrease based on expectations of some market participants due to dry weather conditions that impacted the harvest especially in the Western regions of North West.
Since April, YMAZ has been trading at import parity level in Cape Town, which may act as a domestic price ceiling, while the WMAZ price level is granted more freedom to fluctuate due to the high demand experienced from neighbouring landlocked countries and the supply shortage resulting from a poor harvest. Import parity trading level in Durban for WMAZ has not been reached due to the low availability in Mexico and the US.
Sources: SAGIS/CEC/Senwes/Victor Esterhuizen, Junior Grain Trader, Grain Trading
Fraud risk
FRAUD AWARENESS
Behavioural red flags of fraud: The Association of Certified Fraud Examiners have found that fraudsters commonly display distinct behaviours that can serve as warning signs of their misdeeds. Organisations can improve their anti-fraud programs by taking these behavioural red flags into consideration when designing and implementing fraud and detection measures. Their study showed that 84% of all fraudsters display at least one behavioural red flag.
75% of fraudsters display at least one of the 8 most common behavioural clues; each of these behavioural red flags was observed in at least 10% of cases.
The eight key warning signs are:
- Living beyond means (39%)
- Financial difficulties (27%)
- Unusually close association with vendor/customer (20%)
- Control issues, unwillingness to share duties (13%)
- Irritability, suspiciousness, or defensiveness (12%)
- “Wheeler-dealer” attitude (12%)
- Bullying or intimidation (11%)
- Divorce/family problems (10%)
Living beyond means has consistently been the most common behavioural red flag since ACFE began tracking this data in 2008. These behavioural flags tended to correlate with the fraudster’s gender. The study found that 41% of female fraudsters where living beyond their means and male fraudsters
The study found that the leading gender in the living beyond means behavioural flag was female with 41% with male fraudsters following close at 39%. Female fraudsters surpassed male fraudsters in the financial difficulties red flag with 31% and 26% respectively. 14% of female fraudsters displayed signs of the divorce/family difficulties behavioural red flag while only 8% of male fraudsters displayed this red flag.
Male fraudsters where the leading gender with the following red flag behaviours: unusually close association with customers/ vendors at 22% (female fraudsters at 13%); “wheeler-dealer” attitude at 14% (female fraudsters at 6%) and irritability, suspiciousness, or defensiveness at 13% (female fraudsters at 11%). It was also found that male perpetrators outnumbered female perpetrators almost three to one, with 74% of fraudsters being male and 25% of perpetrators being female.
Source: https://www.acfe.com/-/media/files/acfe/pdfs/rttn/2024/2024-report-to-the-nations.pdf pg68-69


