
The NWK Limited external factors report provides an overview of the main external factors that NWK and its clients are exposed to at a specific point in time. This report opts to aid in a timely basis to foresee external market and other factors that may have an impact on any business and clients. The main focus of this document is to have a closer look at external factors that can affect any business and our customers.
Executive summary
External factors that can affect any business and its customers include various economic factors. This report will focus on monthly or quarterly changes of these economic factors.
The inflation rate increased to 3,2% in January 2025, up from December but still below the 3,3% forecast. Retail trade increased to 3,1% in December 2024. The unemployment rate fell to 31,9% in the fourth quarter of 2024. The GDP growth for the third quarter contracted with 0,3%, following a revised 0,3% rise in Q2. The Policy Uncertainty Index went much further into negative territory to 65,7 in Q4 2024 compared to 53,5 in Q3 2025.
An external factor that is of great concern to any agricultural business is the weather and climate outlook. These factors include long term climate risks, such as drought and heat stress, as well as the current status of the El Niño and La Niña climate phenomenon. The El Niño Southern Oscillation (ENSO) is currently La Niña Advisory. However, some models show preference for neutral ENSO conditions.
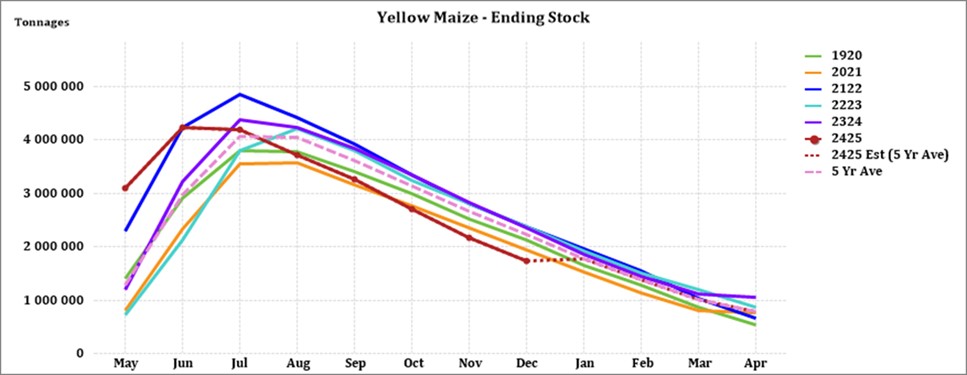
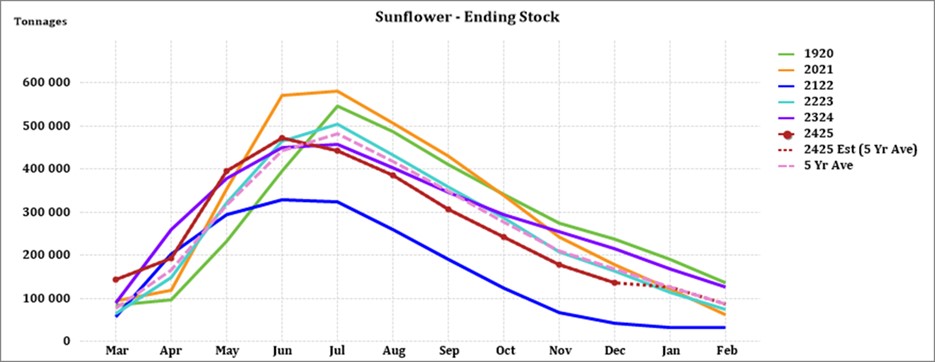
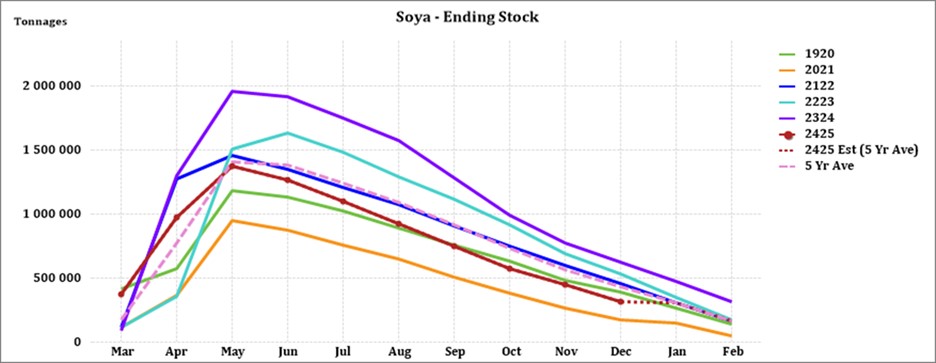
The National Agricultural Marketing Council (NAMC) projected the ending stock for 30 April 2025 of total maize to be less than the 2023/2024 season. The projected soybean ending stock for February 2025 is 128 977 t – that is less than the final for the 2023/2024 season of 320 637 t. The projected sunflower ending stock for February 2025 is 42 724 t – that is less than the final for the 2023/2024 season of 127 144 t.
During the previous Monetary Policy Committee (MPC) meeting held on 30 January the committee decided that interest rates will be cut by 25 basis points. The repo rate is currently 7,5% and the prime rate 11%.
Business climate: Key risk drivers
A few highlights regarding certain risk drivers are mentioned below.
According to Trading Economics, South Africa’s annual inflation rate increased to 3,2% in January 2025 from 3% in December 2024. The inflation rate is expected to be 3,2% by the end of this quarter. In the long-term, the South Africa Inflation Rate is projected to trend around 4,6% in 2026 and 4,5% in 2027, according to Trading Economics.
Brent crude oil monthly average prices decreased by $5,40 per barrel from January to February. The Iron ore prices increased by $4,77 per metric ton on a monthly average from January to February.
South Africa’s retail trade climbed with 3.1% over a year ago in December 2024, following a downwardly revised 7,6% the prior month. According to Statistics SA, South Africa’s unemployment rate fell slightly to 31,9% in Q4.
The GDP growth rate decreased by 0,3% in the third quarter in 2024. Four of the ten industries experienced a decrease. The Finance industry was the largest positive contributor, increasing by 1,3%.
The Safex maize prices followed a decreasing trend for the first two weeks of February, decreasing notably compared to a month ago on the back of improved weather prospects. Safex maise prices remain notably higher year-on-year.
Adverse weather patterns can reduce yields and also affect the Safex price (high regional demand poses an upside price risk). The ENSO is currently at La Niña Advisory, as weak La Niña conditions persist in the equatorial Pacific through mid-February. After March 2025, however the forecast predicts higher chances of neutral conditions. The solar cycle is in an upward trend for the current 11-year cycle which means possible more rain for the following season to come. The turning point is predicted to be in 2025.
The Policy Uncertainty Index went much further into negative territory to 65,7 in Q4 2024 compared to 53,5 in Q3 2025. The PUI is the net outcome of positive and negative factors influencing the calibration of policy uncertainty over the relevant period. It is seen to have important implications for business confidence and the investment climate in the country. Negative factors outweighed positive ones over the last three months of 2024. Although further in negative territory, the PUI nonetheless identified the relevant data confirming SA’s slow but uneven economic recovery.
Sources: https://tradingeconomics.com/south-africa/inflation-cpi
https://tradingeconomics.com/commodity/brent-crude-oil
https://tradingeconomics.com/south-africa/unemployment-rate
https://www.statssa.gov.za/?page_id=737&id=1
https://tradingeconomics.com/south-africa/gdp-growth
https://agrink.co.za/downloads/ABSA%20Agri%20Trends%20Grains%20and%20Veggies.pdf
https://tradingeconomics.com/commodity/iron-ore
PUI_2024Q3.pdf
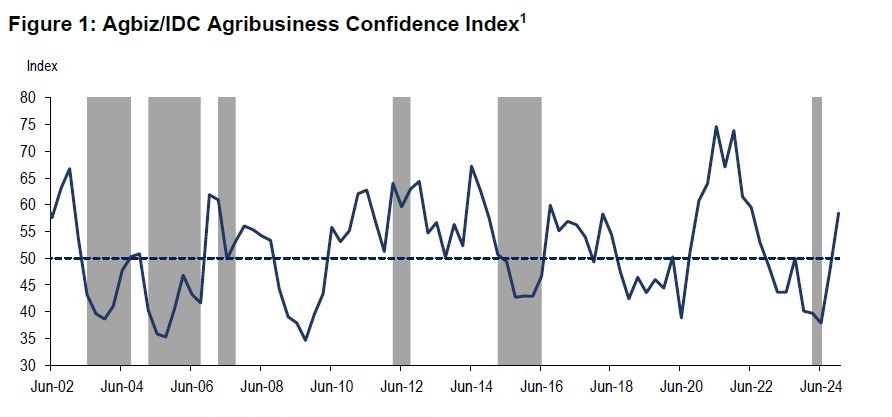
Agribusiness Confidence Index (ACI), Q3 2024
The Agricultural Business Chamber (Agbiz) conducts a quarterly survey to compile the Agribusiness Confidence Index (ACI), reflecting the views of at least 25 decision-makers in the agricultural sector. Released on 6 December 2024, the latest index evaluates ten critical factors impacting agribusiness: turnover, net operating income, market share, employment, capital investment, export volumes, economic growth, general agricultural conditions, debtor provisions for bad debt, and financing costs.
The Agbiz/IDC Agribusiness Confidence Index (ACI) increased by 10 points from Q3 to 58 in Q4. This is the second consecutive improvement and places the ACI at its highest level since Q2 2022. This level of the ACI implies that South African agribusinesses remain generally optimistic about business conditions in the country. This optimism is a result of a combination of factors, including favourable weather conditions, with expectations that La Niña rains will be supportive of the 2024/2025 agricultural season.
Moreover, the stable energy supply, improvements in port efficiency, and the better political climate following the formation of the Government of National Unity (GNE) are some of the aspects the respondents cited as key factors underpinning their optimism. This survey was conducted in the last week of November, covering businesses operating in all agricultural subsectors.
DISCUSSION OF THE SUBINDICES
The ACI is made up of ten subindices, six of which improved in Q3 2024, while the others saw slight declines. Here is the detailed view of the subindices:
Increasing subindices
In Q4 2024, the market share subindex for agribusiness rose by 2 points to 67. Most respondents showed a stable outlook, with those in winter grains regions reporting an increase in confidence.
The capital investments subindex increased by 5 points to 63 in Q4 2024, likely due to easing interest rates, which may allow agricultural businesses and farmers to secure capital at better rates. However, sales of high-frequency items like tractors and combine harvesters have been weak since the start of the year, so it remains to be seen if the improved sentiment translates into actual investment growth.
The export sentiment subindex surged by 69 points to 83 in Q4 2024, marking its highest level since Q1 2022. This improvement was largely driven by respondents in the grains and fruit subsectors and aligns with actual trade trends. South Africa’s agricultural exports reached US$4,12 billion in Q3 2024, a 5% increase from 2023. The cumulative export value for the first three quarters of 2024 was up 4% from the previous year, totalling US$10,55 billion, reflecting both higher export volumes and prices for some products.
The general economic conditions subindex rose by 20 points to 63 in Q4 2024, reflecting improved sentiment, likely due to reduced load-shedding and the implementation of Operation Vulindlela. Although recent GDP growth figures have been disappointing, market analysts remain optimistic about GDP forecasts for 2025.
The general agricultural conditions subindex increased by 17 points to 67 in Q4 2024, reaching its highest level since Q4 2021. This optimism is driven by expectations of beneficial La Niña rains for the 2024/2025 summer season and positive impacts on agricultural conditions. Farmers have already begun planting and are generally optimistic about the season, while the winter crop harvest, particularly in the Western Cape, has exceeded expectations.
Declining subindices
The turnover subindex confidence dropped by 4 points to 46 in Q4 2024. This decline is partly due to the poor summer grains and oilseeds harvest of the 2023/2024 production season. Respondents in sectors like livestock, summer grains, and some in financial services expressed a generally negative outlook. Consistent with the turnover subindex, the net operating income subindex also fell by 5 points, reaching 42.
The employment subindex dropped by 5 points to 42 in Q4 2024, reflecting the challenges faced by the sector after a tough season. Despite this decline in sentiment, recent employment data presents a more positive outlook, with agricultural jobs in South Africa increasing by 4% quarter-on-quarter to 935 000 in Q3 2024.
In Q4 2024, the debtor provision for bad debt subindex fell by 8 points to 42, which is seen as a positive sign, indicating the sector may be nearing recovery. However, the financing costs subindex rose by 33 points to 79, contrary to expectations of a decline due to easing interest rates, suggesting growing financial strain.
Concluding remarks
The ACI results for Q4 2024 indicate a positive outlook in the agricultural sector, driven by hopes for recovery from recent challenges like drought and animal diseases. Wandile Sihlobo, chief economist of Agbiz, emphasizes the need to build on this optimism for long-term growth. He calls for collaboration between businesses and government to improve network industries, municipal management, open new export markets, and enhance biosecurity management.
ISSUED BY:
Wandile Sihlobo
Chief Economist, Agricultural Business Chamber of South Africa (Agbiz)
E-mail: wandile@agbiz.co.za
Source: www.agbiz.co.za, Issued by: Wandile Sihlobo, Chief Economist (AgbizMarch 2024)
Fact of the month
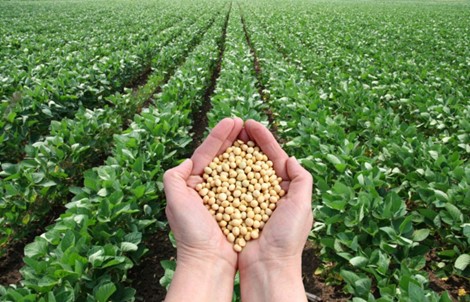
Soybeans create some of their own fertiliser. They are in a class of plants called legumes which have the unique ability to use nitrogen that is in the air. Microorganisms that live on the soybean roots convert atmospheric nitrogen into a form that the plant can use. In turn, the plant feeds the microorganism. When the plant decays, the nitrogen that has been pulled from the air is released into the soil. Growing soybeans in a field can add 33 kg to 56 kf of nitrogen per hectare into the soil.
Source: https://www.bestfoodfacts.org/five-things-you-might-not-know-about-soybeans/
Weather and climate
NATIONAL ASSESSMENT
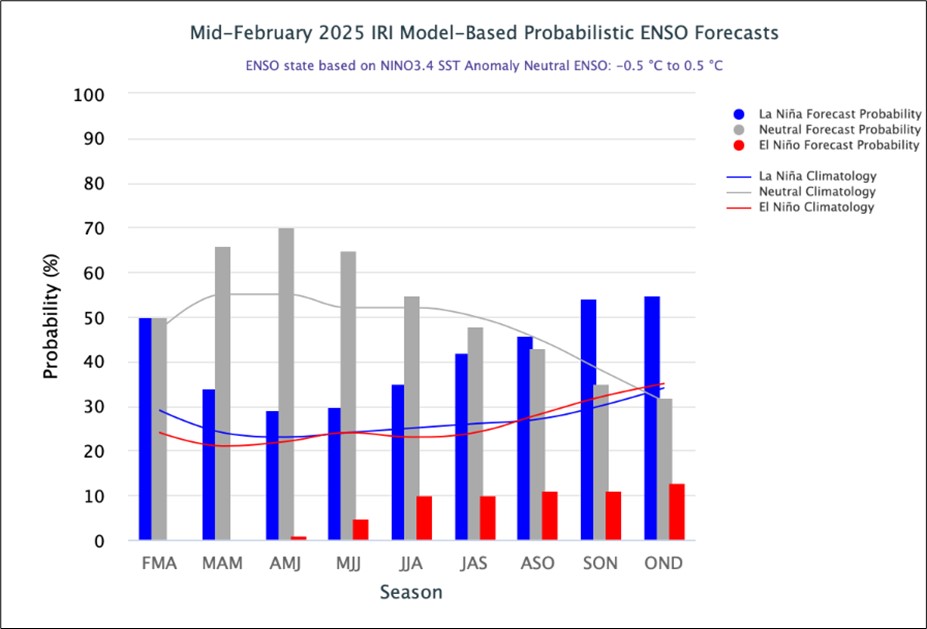
As of mid-February 2025, weak La Niña conditions persist in the equatorial Pacific, marked by cooler-than-average sea surface temperatures in the Niño 3.4 region, which remain slightly below the -0.5°C threshold – a key indicator of La Niña.
The IRI ENSO plume forecasts equal chances for La Niña and ENSO-neutral conditions for February to April 2025. For March to May and June to August 2025, ENSO-neutral conditions are favoured.
The next two forecast seasons, July to September and August to October 2025, do not show a strong preference for La Niña or ENSO-neutral. However, ENSO-neutral conditions are slightly favoured in the earlier period, while La Niña conditions are slightly favoured in the later period. For September to November (54%) and October to December (55%) 2025, La Niña conditions are favoured slightly over ENSO-neutral conditions.
https://iri.columbia.edu/our-expertise/climate/forecasts/enso/current/?enso_tab=enso-iri_plume
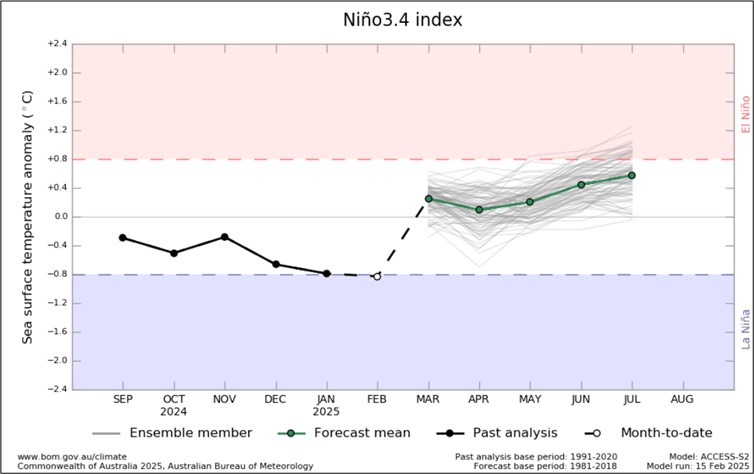
The Bureau of Meteorology’s model suggest SSTs are likely to remain within the ENSO-neutral range (−0.8 °C to +0.8 °C) throughout the forecast period to July 2025.
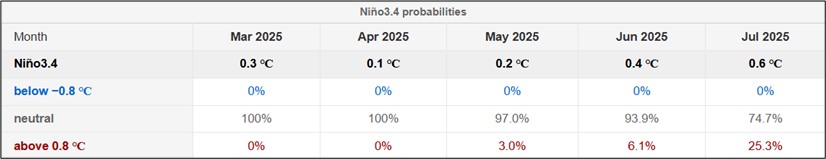
The graph below reflects the current neutral conditions bordering on La Niña conditions and the ocean temperatures that are starting to get cooler. The graph supports the prediction of an ENSO-neutral state throughout the forecast period to July 2025.
http://www.bom.gov.au/climate/ocean/outlooks/?index=nino34
Disclaimer: Please note that due to the South African Weather Services (SAWS) having been breached by a cyberattack and service to the website has not yet been restored, the following section has not been updated and reflects the last reports SAWS released before they were breached by a cyberattack. The section below will be updated as soon as service has been restored to the website.
The latest Climate Watch issued by the SA Weather Service (23 December 2024) predicts above-normal rainfall for parts of the north-eastern central and coastal areas during the late summer season. These above-normal rainfall forecasts would likely have a positive impact on crop and livestock production in these areas. However, below-normal rainfall is predicted over most parts of the summer rainfall areas. Therefore, the relevant decision-makers are encouraged to advise farmers in these regions to implement soil and water conservation measures, proper water harvesting and storage techniques, establish effective drainage systems, and other appropriate farming practices.
The critical period for rainfall for South Africa’s summer grains and oilseed is between October and the end of February the following year. This is a period between planting and pollination of the crop. The months after are essential, but the crop could still have decent yields even if there is less rain after the pollination.
Minimum and maximum temperatures are expected to be mostly above-normal countrywide for the forecast period. However, the southern coastal areas indicate that below-normal maximum temperatures are more likely throughout the summer period.
Source: https://www.weathersa.co.za/Documents/SeasonalForecast/SCOLF202407_01082024095021.pdf
SUNSPOTS
Sunspots are darker, cooler areas on the surface of the sun that arise due to disturbances in the sun’s magnetic field. Every eleven years, the number of spots dotting the surface of the sun increases and decreases and forms the solar cycle.
Sources:
https://www.sciencedirect.com/science/article/abs/pii/S136468262200116X#:~:text=It%20was%20observed%20that%20rainfall,an%20increasing%20effect%20on%20rainfall
https://www.space.com/solar-cycle-frequency-prediction-facts May 27,2022.
https://eos.org/articles/why-did-sunspots-disappear-for-70-years-nearby-star-holds-clues 10 June, 2022.
According to science direct the rainfall rate is directly related to the sunspot number, but shows different characteristics during solar maximum years. Though a lag correlation exists between sunspot number and rainfall, sunspots have an increasing effect on rainfall. Studies show that the more sunspots are present the higher the rainfall and the less sunspots the lower the rainfall.
ENSO occurs at irregular intervals between three and seven years causing global climate system variation. Considering this event occurs periodically, it might be triggered by the eleven-year solar cycle as an energy source.
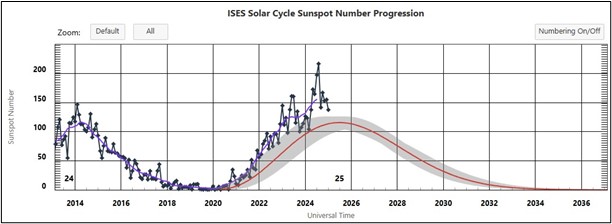
The graph below shows the eleven-year solar cycles since before the 2000s. As the graph is in an upward trajectory higher rainfall can be expected – La Niña. As the graph reaches its turning point and moves in a downward trajectory less rainfall is expected characteristic of an El Niño.
ENSO indicators are currently at neutral and a La Niña is expected to form during summer. Since October 2020 to January 2025 the actual sunspot numbers were higher than the predicted values. The monthly sunspot values for January 2025 were 137.
The conclusion can be made that the sunspots are not yet at their downward turning point. When the sunspots are in an increasing phase it means more rainfall and when in a decreasing phase it usually means less rainfall.
https://www.swpc.noaa.gov/products/solar-cycle-progression
Market risk
GRAIN MARKET ANALYSIS
• Ending stock – National
Ending stock data is gathered from the NAMC. The estimates are reassessed and reported by the Grain and Oilseeds supply and demand estimates committee. The following is the projected ending stock for April 2025 in tonnages for the 2024/2025 season:
- White maize => 324 284 t
- Yellow maize => 340 548 t
The following is a summary of September 2025 ending stock projections for the 2024/2025 season:
- Wheat => 673 128 t
The following is a summary of February 2025 projected ending stock for the 2024/2025 season:
- Sunflower => 42 724 t
- Soybeans => 128 977 t
- Sorghum => 75 975 t
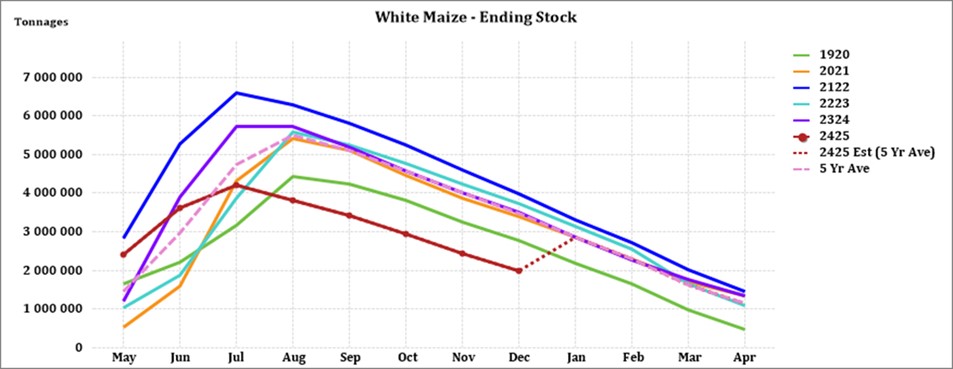
The graphs below show the predicted ending stock for the different commodities according to SAGIS data. A five-year average has been calculated to determine the estimated ending stock for the current season.
The predicted five-year average white maize in April 2025, is 202 082 t less than the final for the 2023/2024 season. Yellow maize shows a 282 419 t decrease in ending stock compared to the previous season.
The predicted five-year average sunflower ending stock for the 2024/2025 season is 41 396 t less than the previous season ending stock.
The predicted five-year average soybean ending stock for 2024/2025 is 151 551 t less than the previous season ending stock.
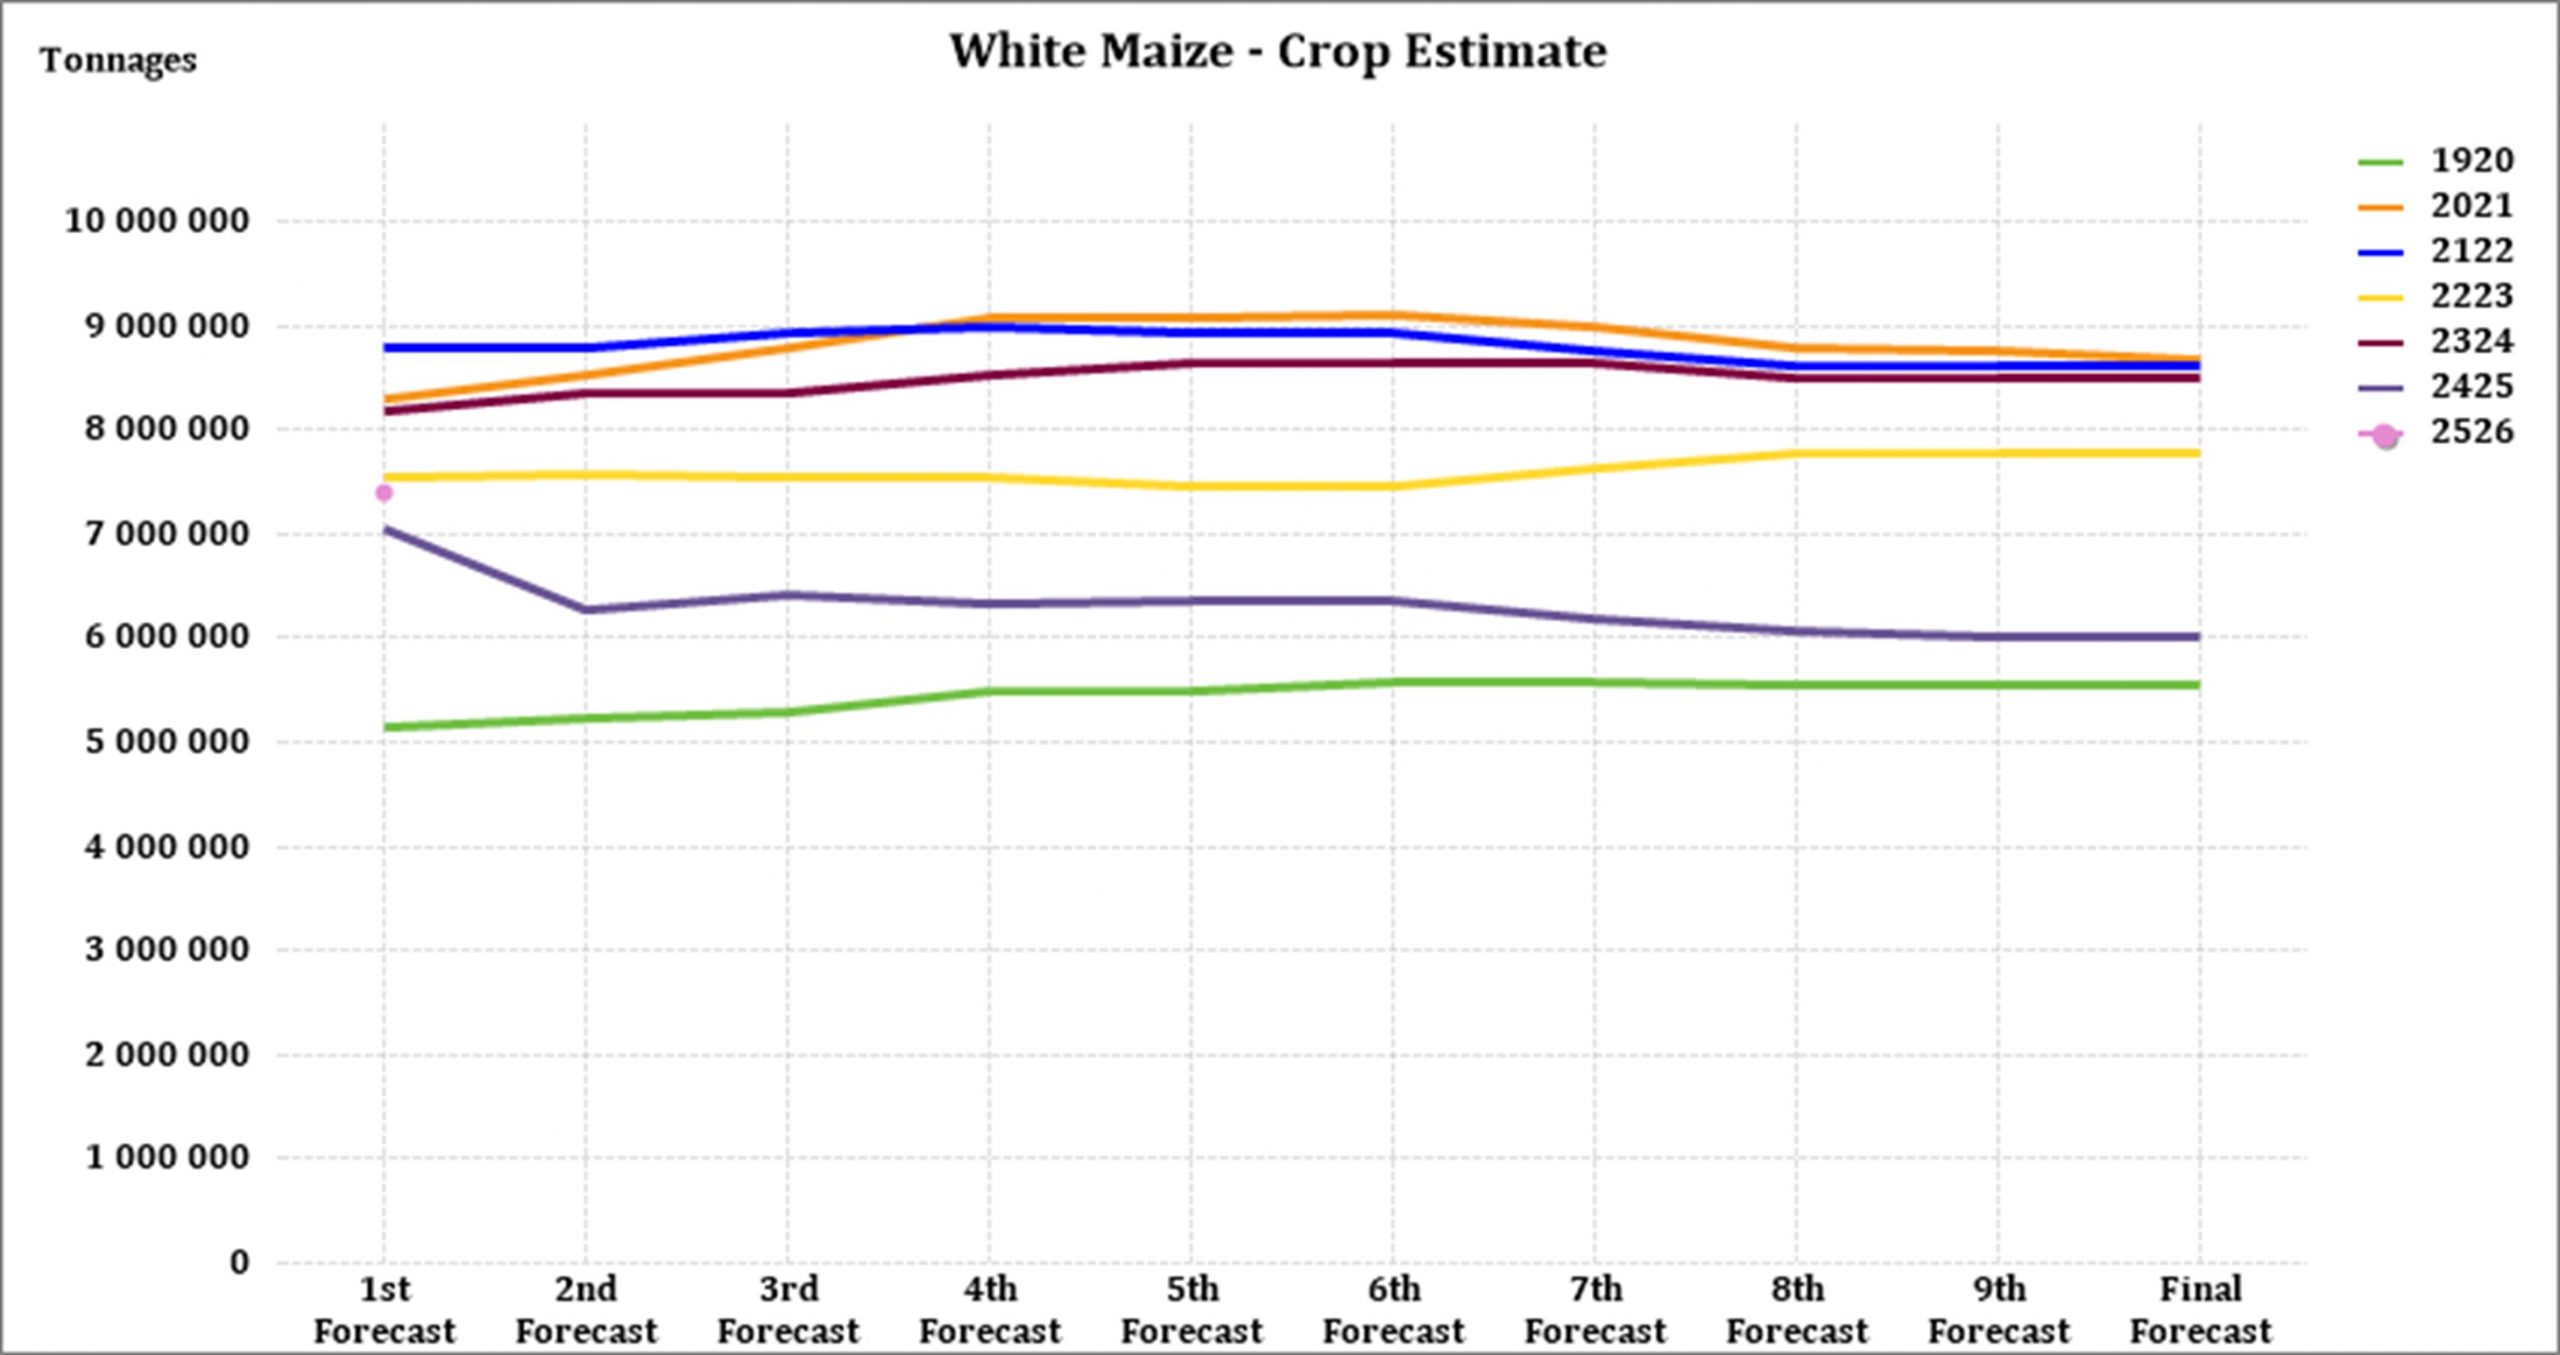
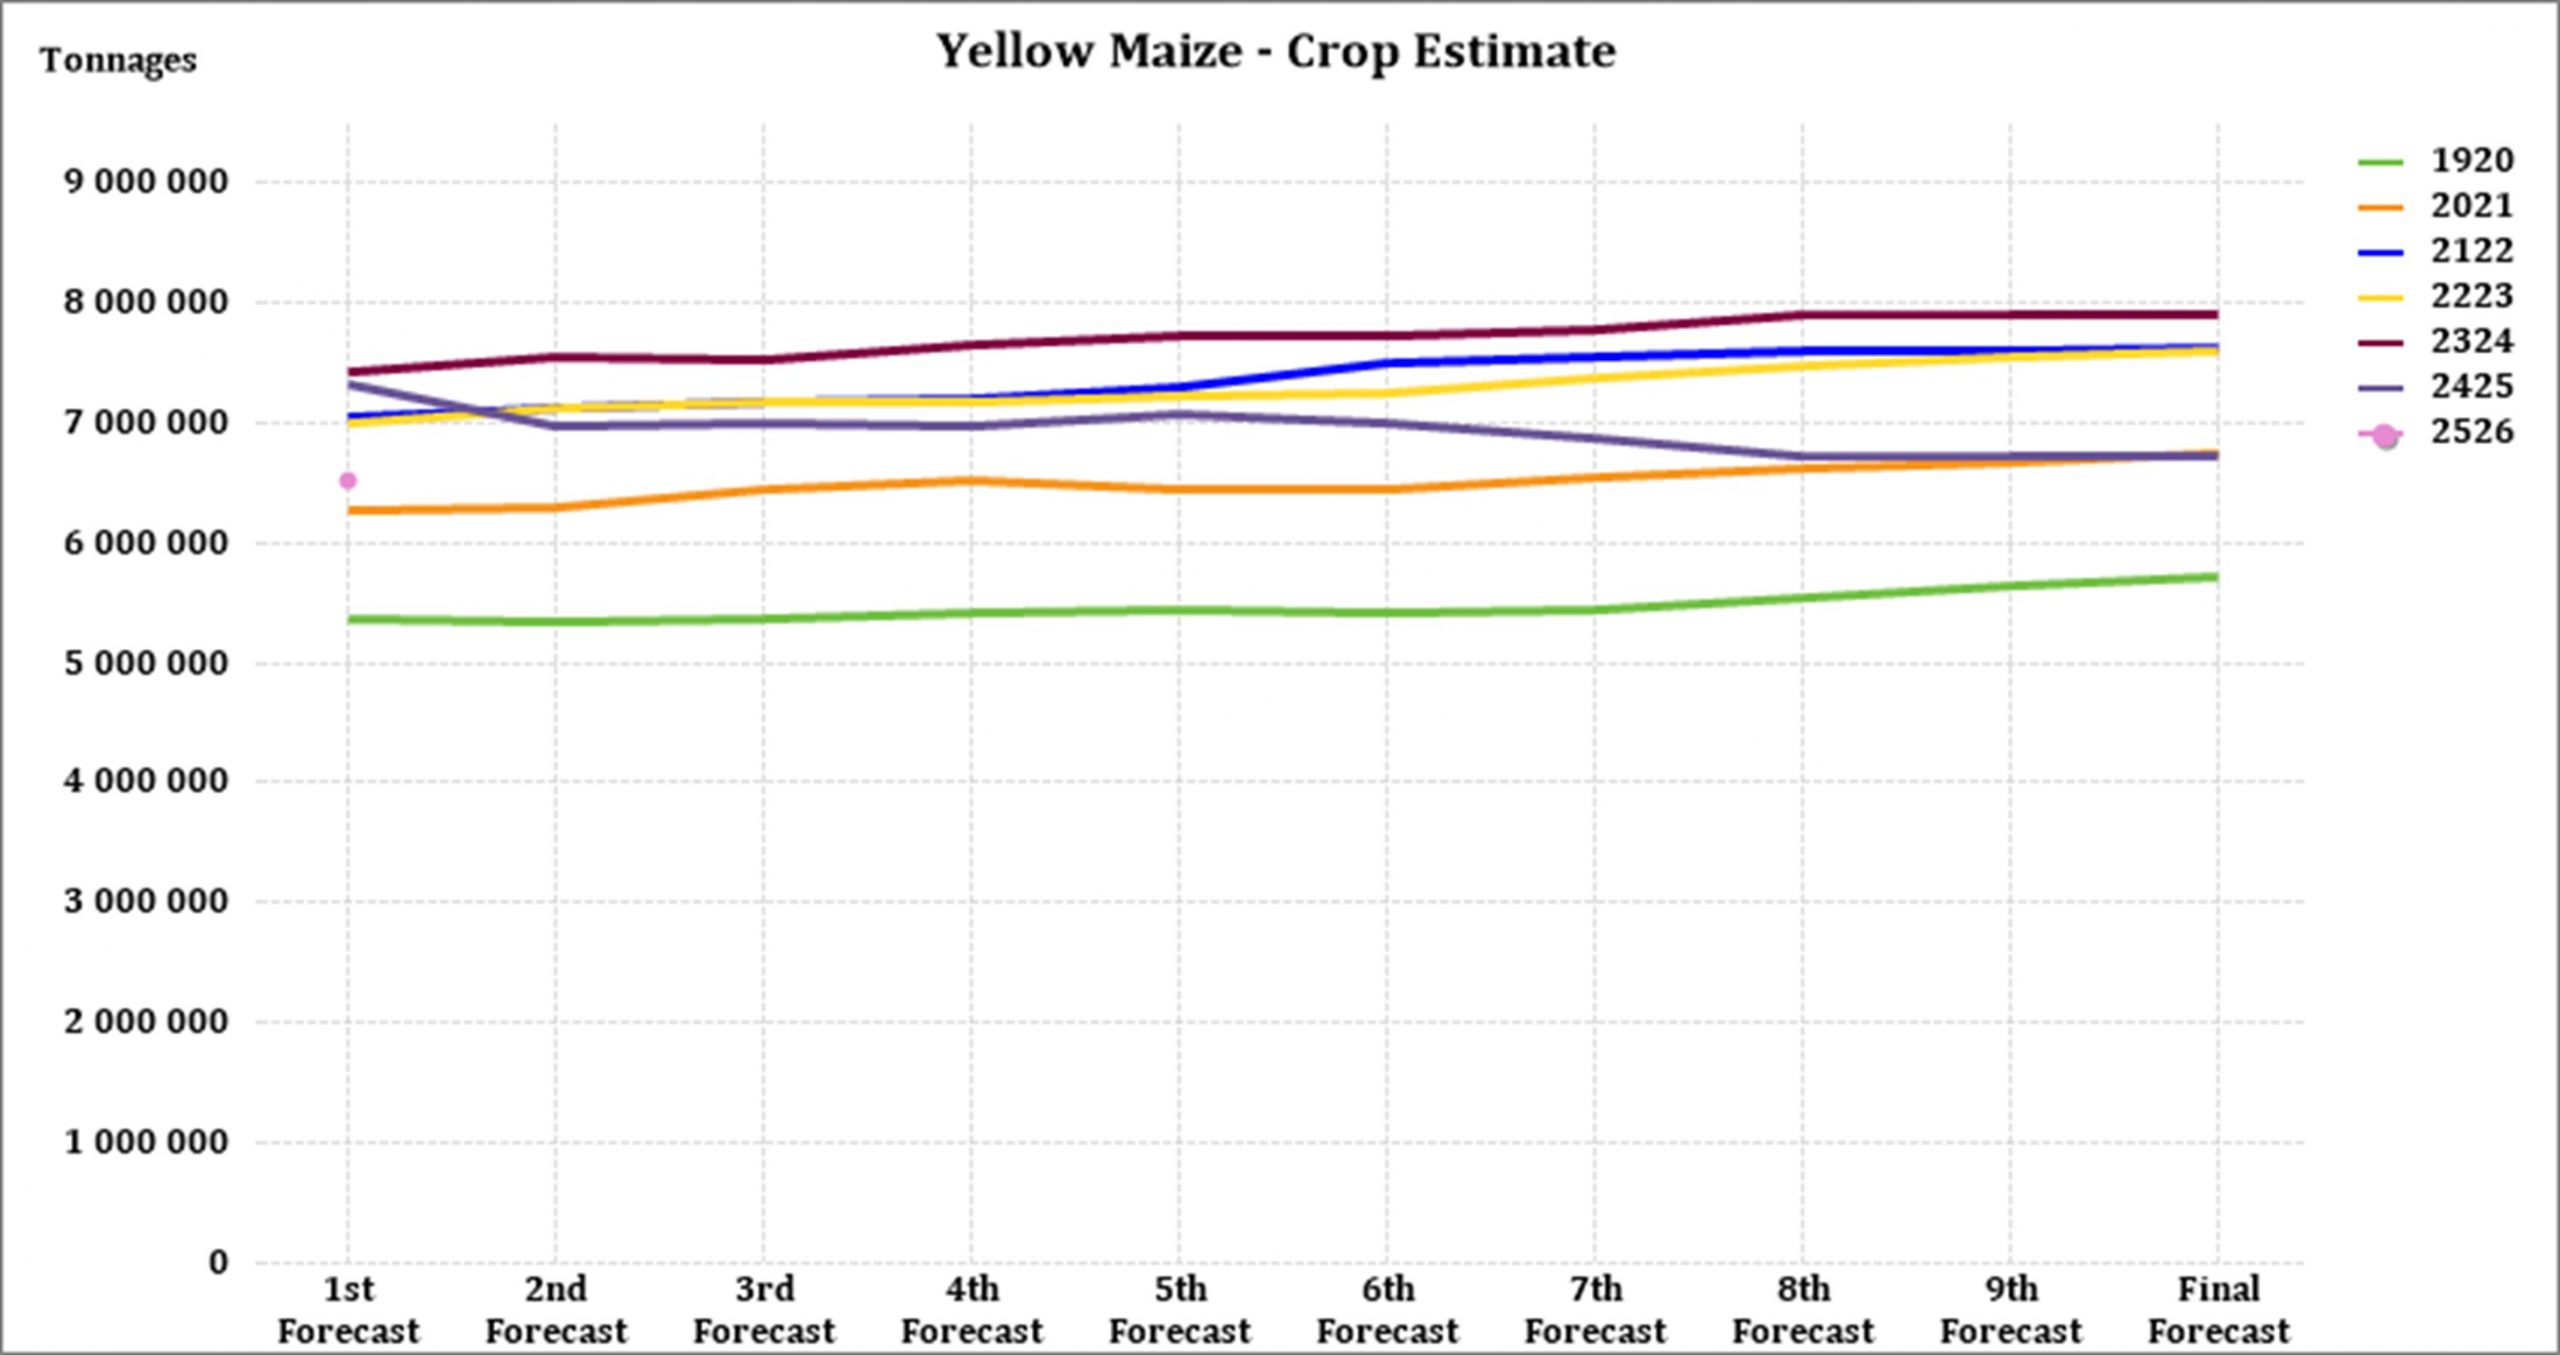
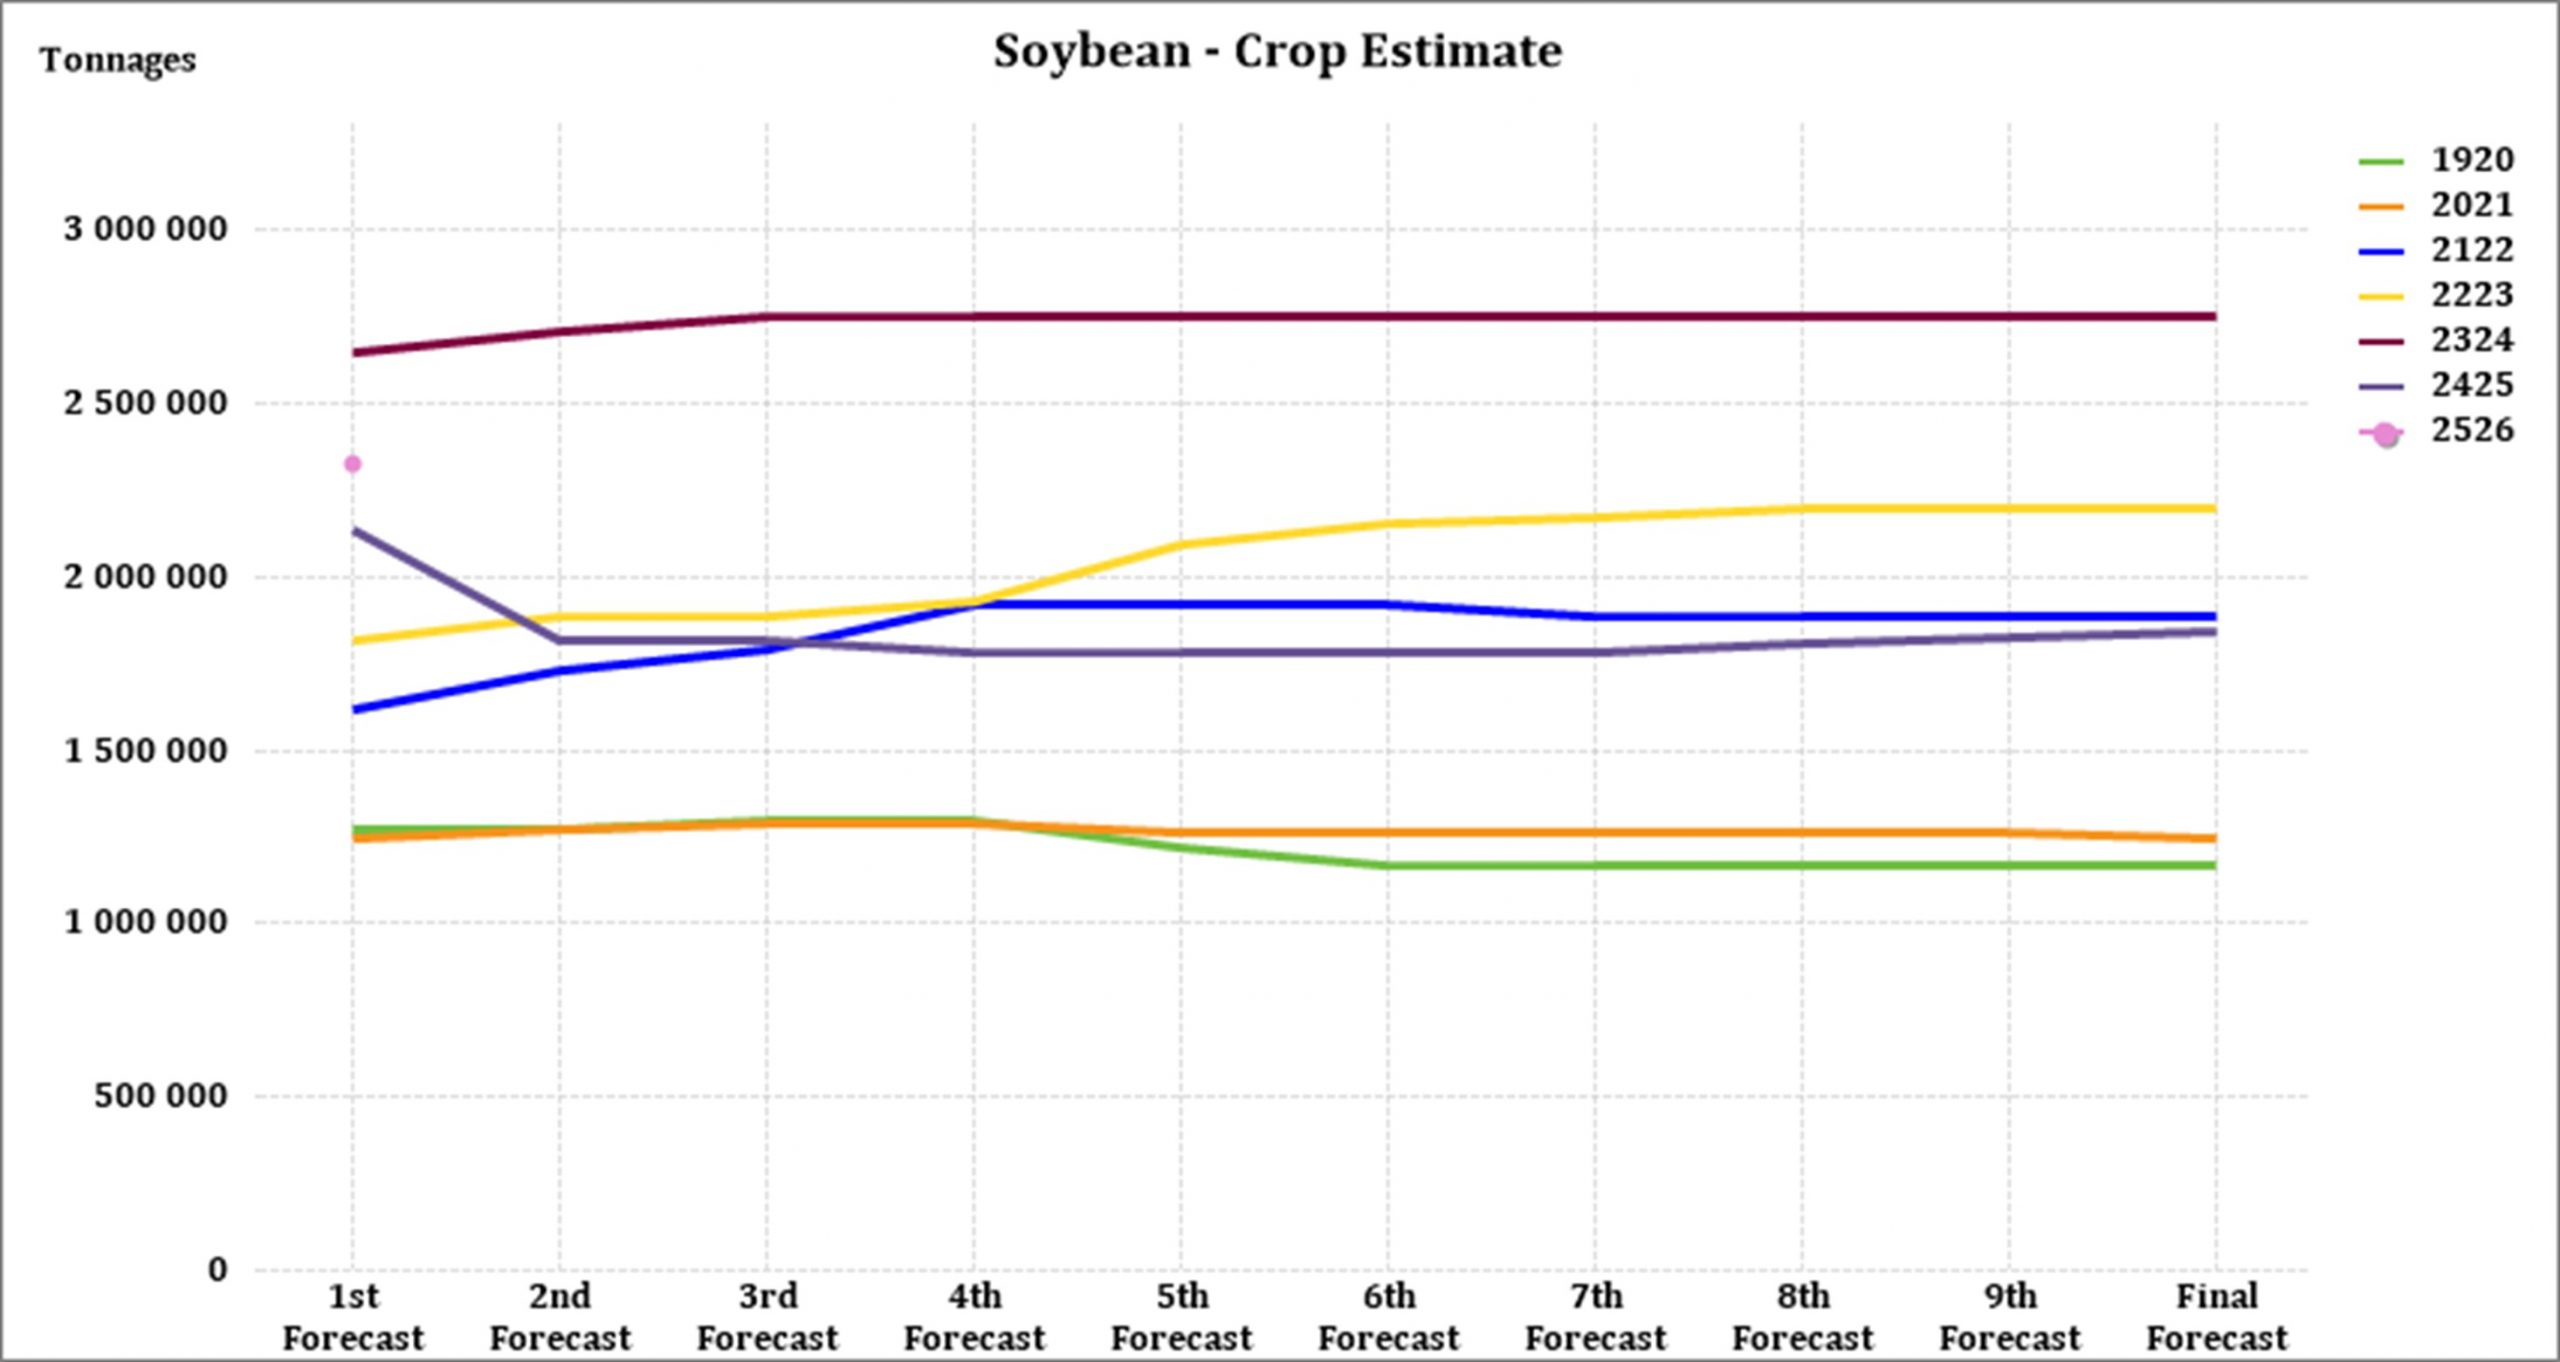
• Crop estimations
According to the Crop Estimate Committee (CEC) first production forecast for 2025, the total area estimate for maize in South Africa is 2,596 million ha, which is 1,5% less than the actual 2,636 million ha planted for the previous season. The total forecasted tons for white maize and yellow maize are 13,911 million tons from the first forecast.
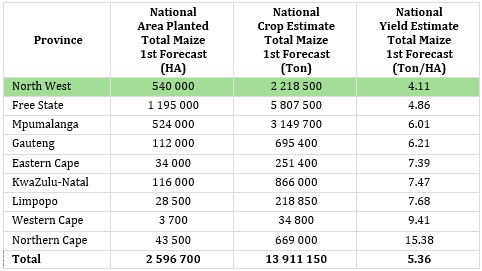
Source: CEC (Crop Estimates Committee)
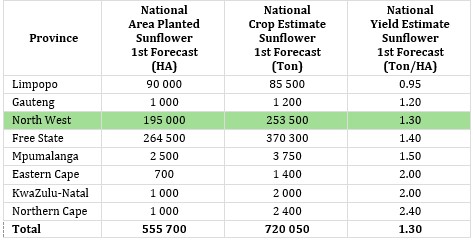
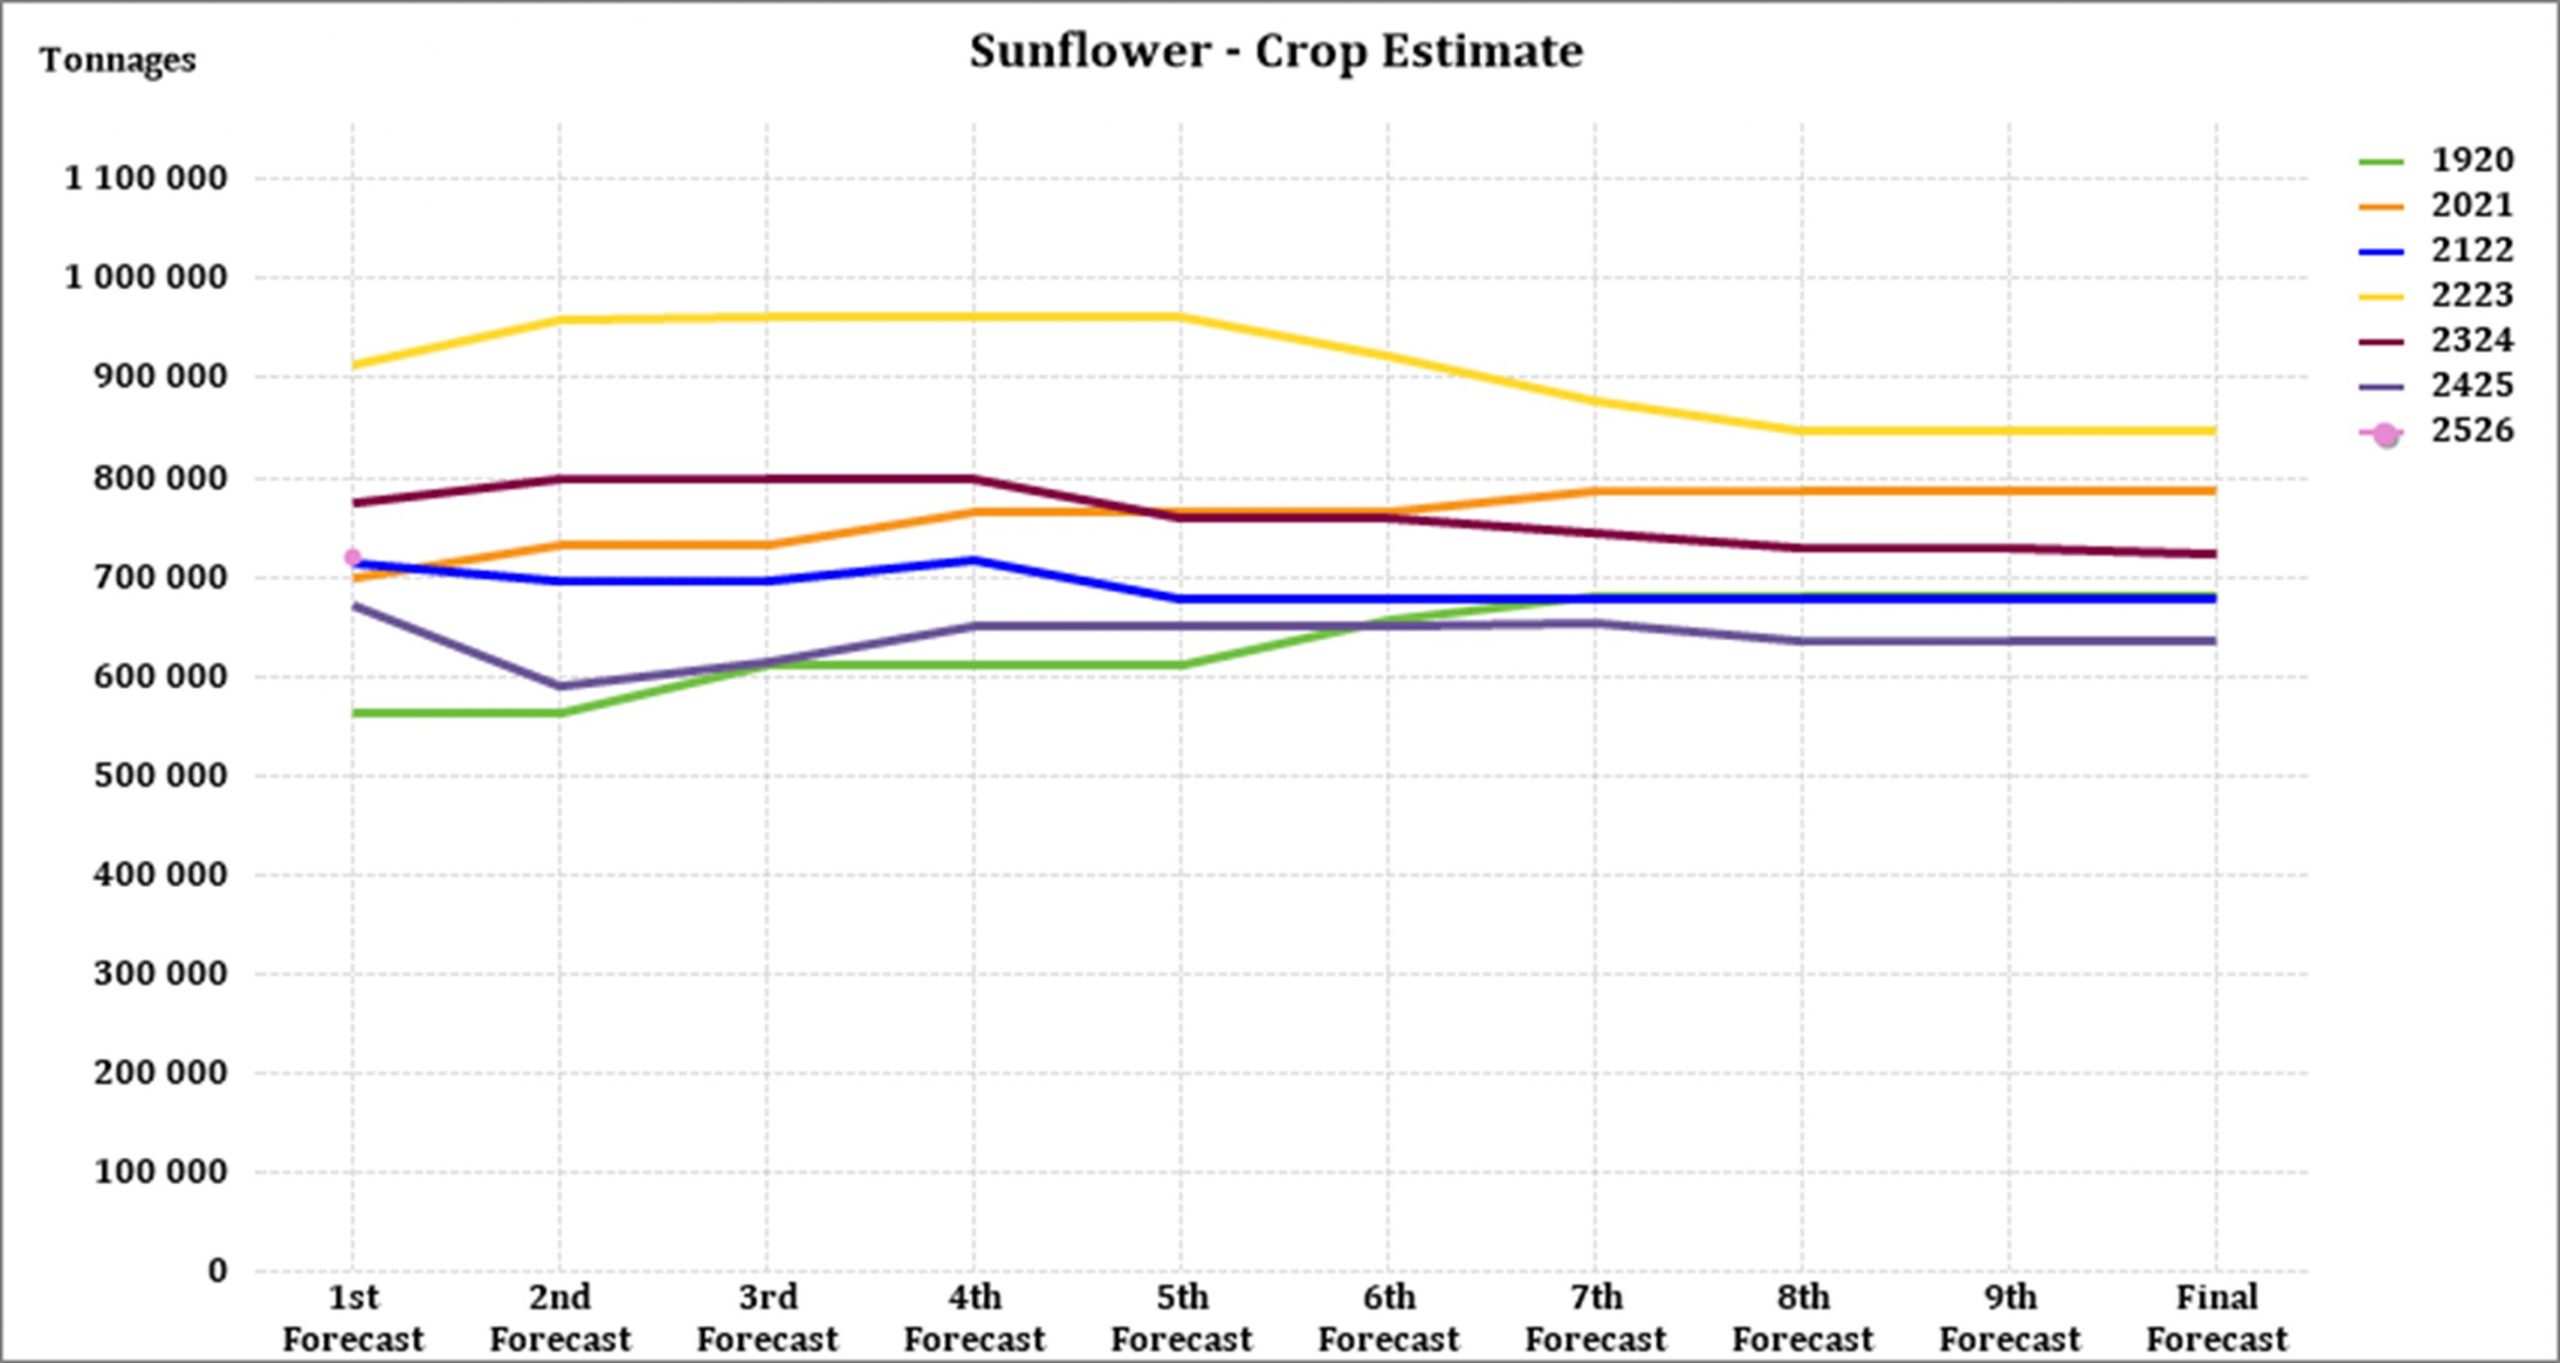
The production forecast for sunflower seed remained unchanged at 720 050 tons. The area estimate for sunflower seed is 555 700 ha while the expected yield is 1,3 t/ha.
Source: CEC (Crop Estimates Committee)
The production forecast for soybeans is 2,325 million tons, 25,82% more than the previous season. The estimated area for soybeans is is 1,151 million ha with an expected yield of 2,02 t/ha.
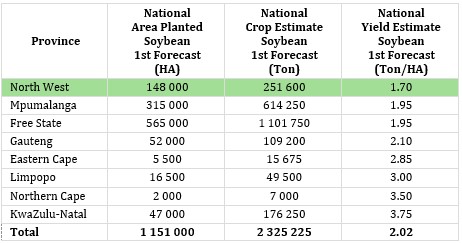
Source: CEC (Crop Estimates Committee)
• Imports and exports – National
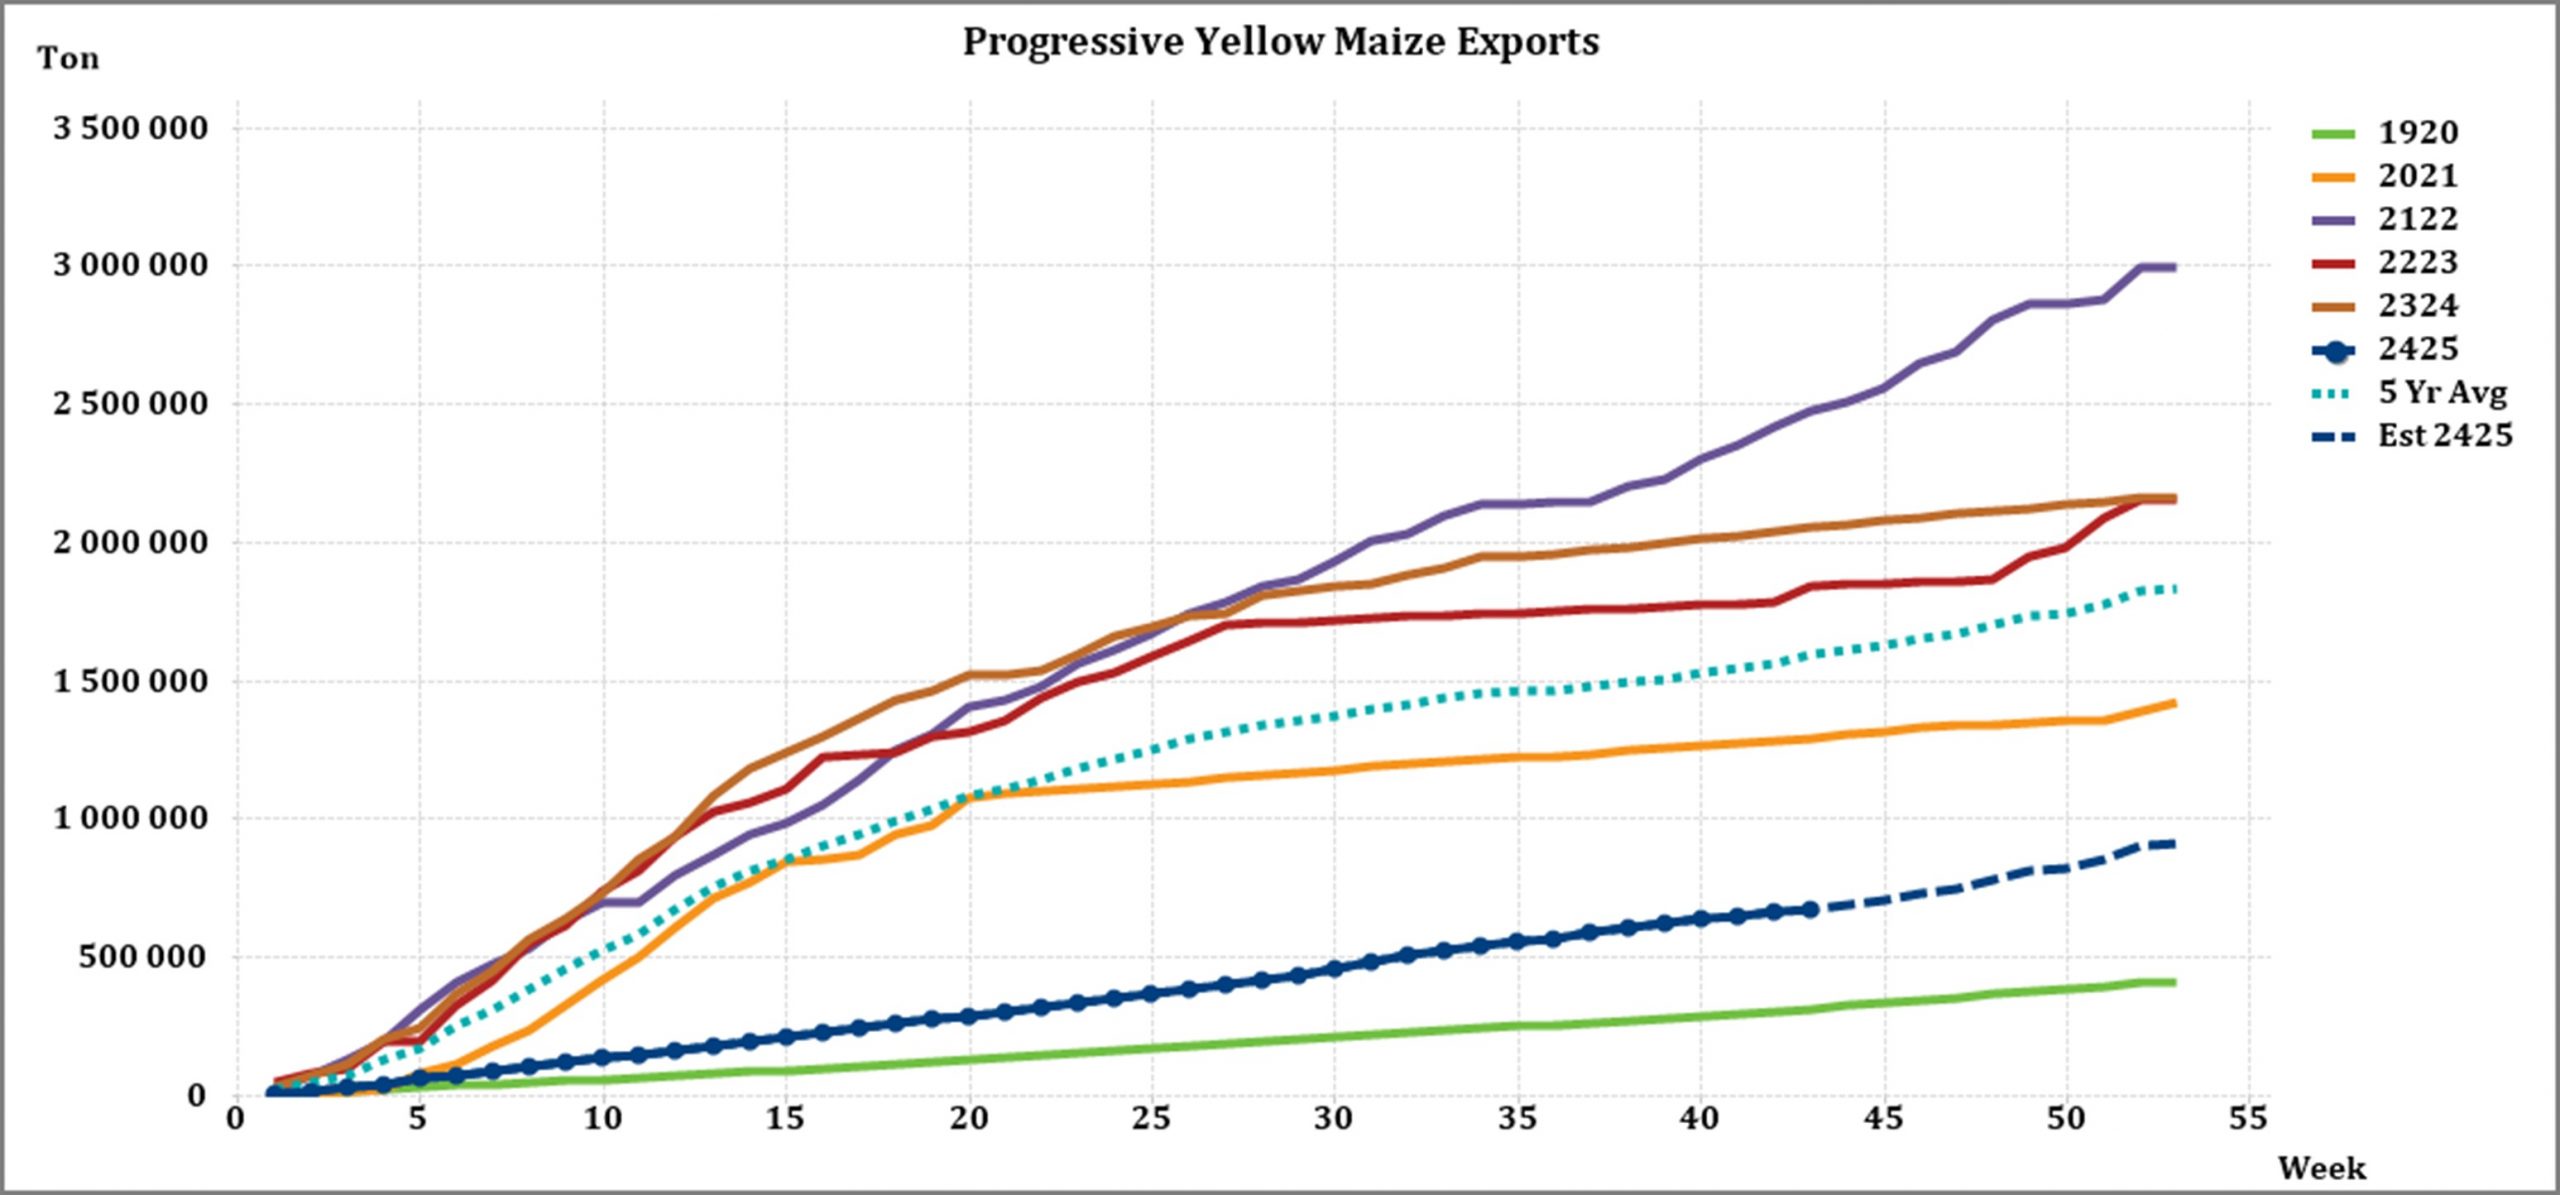
For the production season ending April 2025, 1 268 119 t of white maize and 674 505 t of yellow maize have been exported to date (week 43 of 52) as seen in the graphs below.
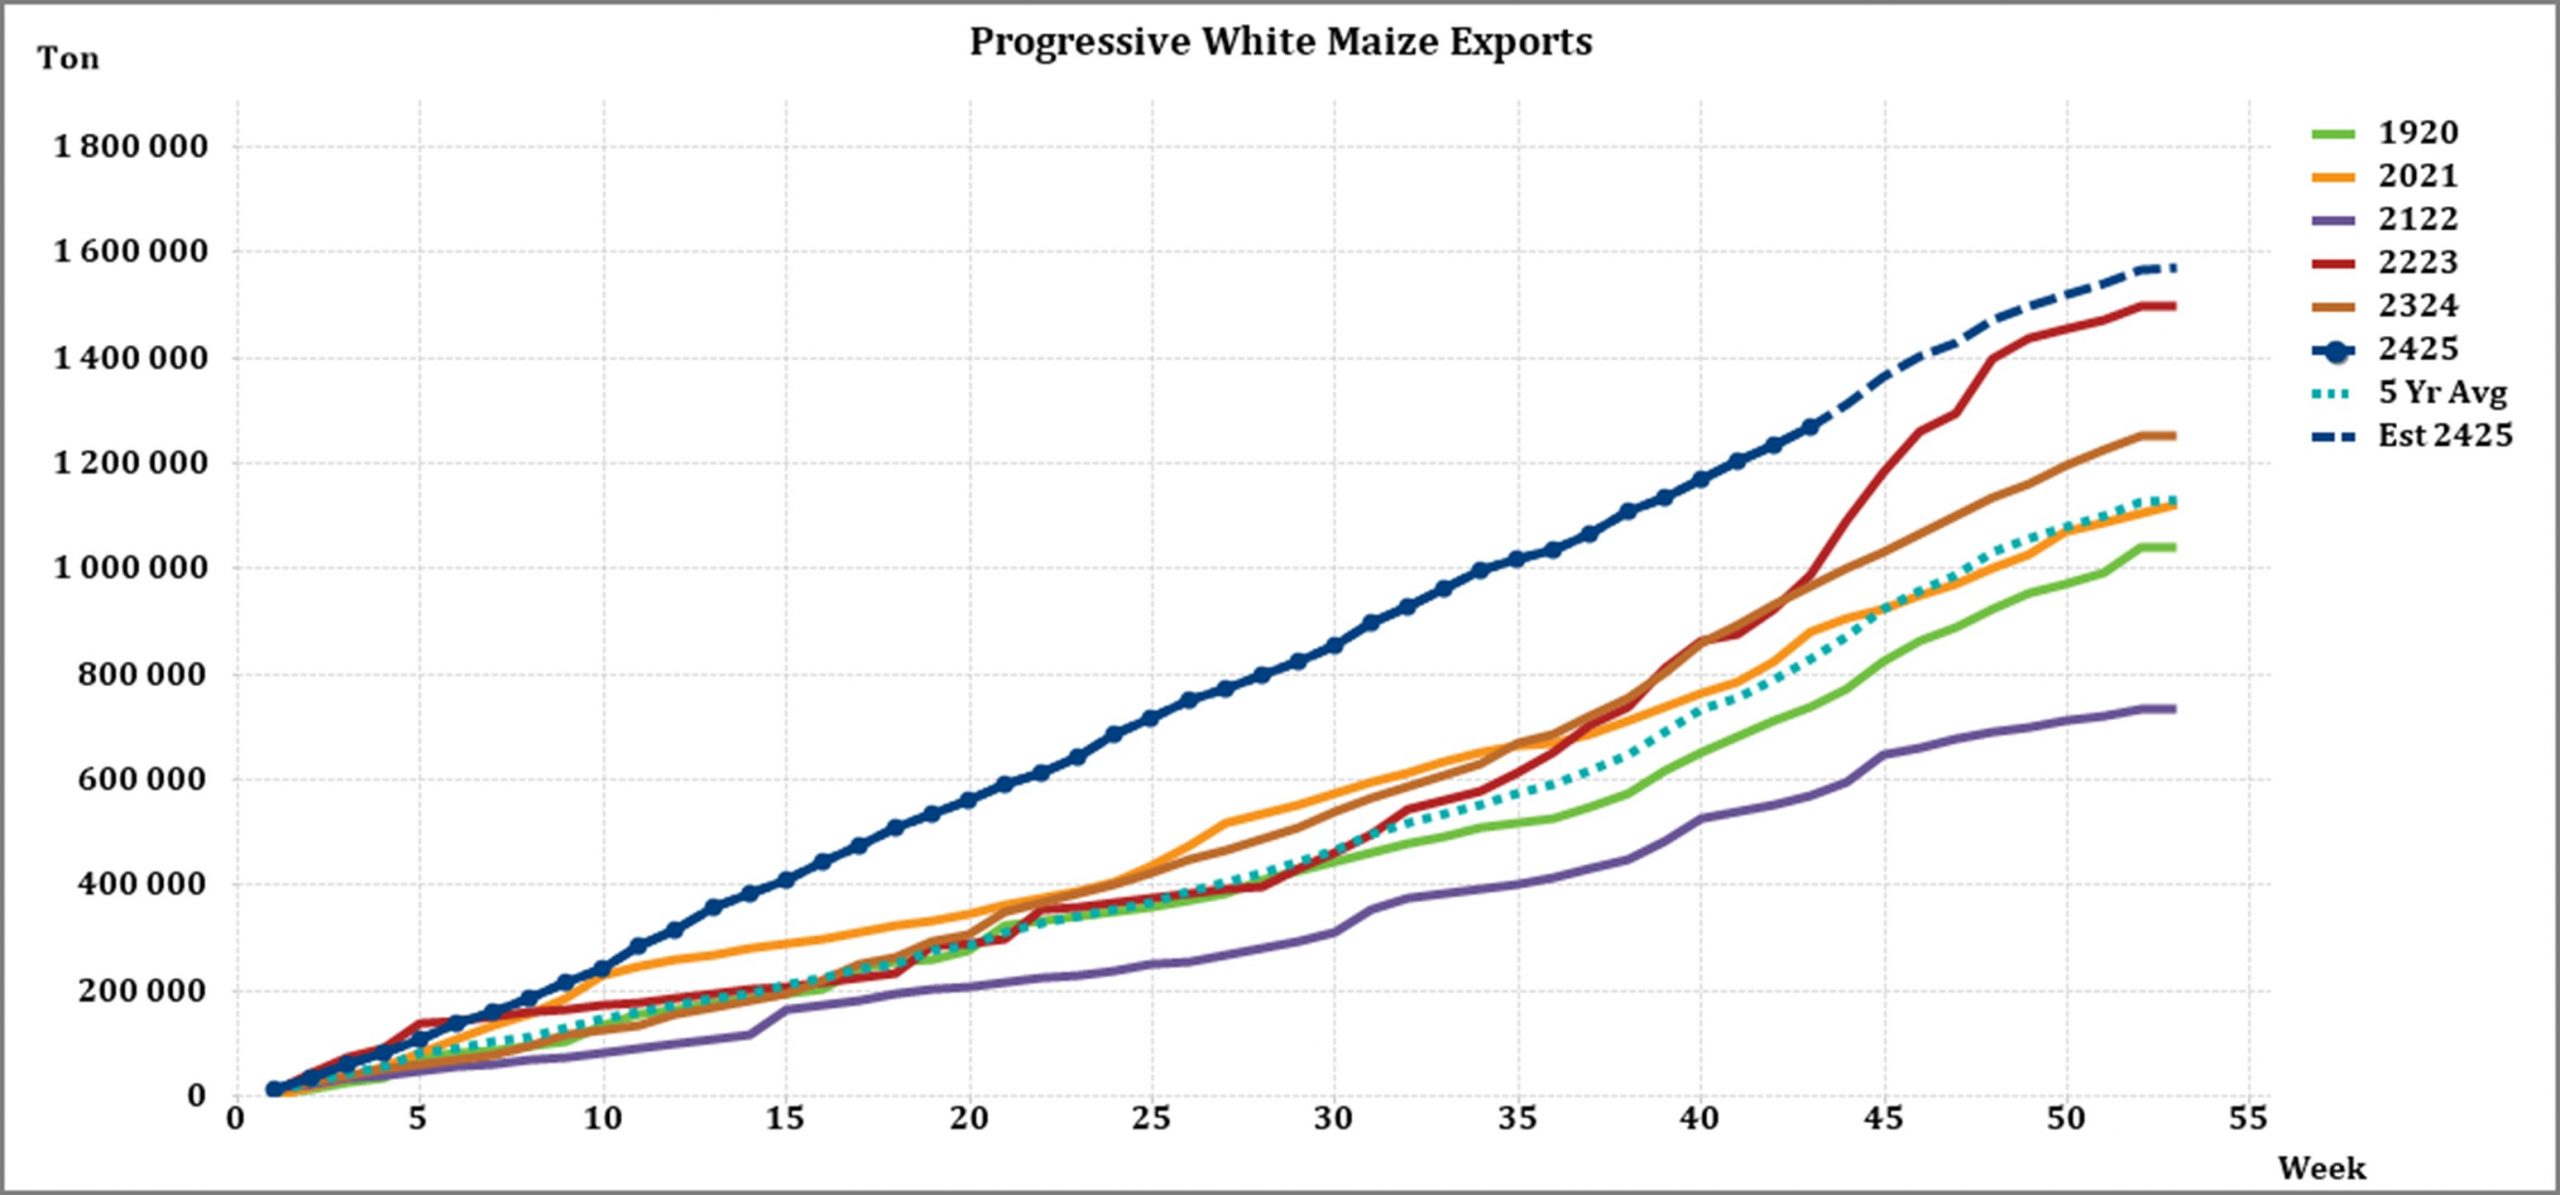
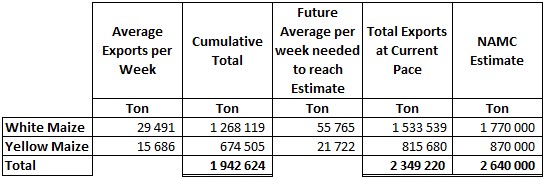
As seen in the table above, the average white maize exports per week is currently 29 491 t. If theoretically, white maize exports remain at the current average per week then there would be 236 461 t less white maize exports than anticipated.
The average yellow maize exports per week are currently 15 686 t. If theoretically, yellow maize exports remain at the current average per week then there would be 54 320 t less yellow maize exports than anticipated.
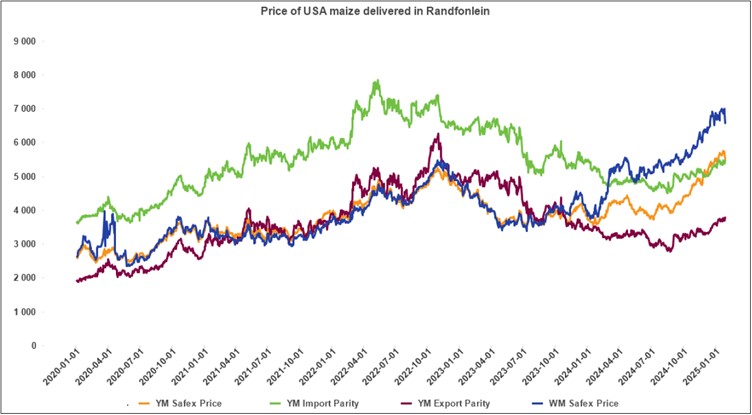
• Parity prices
South Africa is a small producer compared to other countries and is thus a price taker (meaning that we cannot influence world prices). Because of this, our local prices are normally between import and export parity, which is illustrated in the figure below. An import parity price is defined as the price which a buyer will pay to buy the product on the world market. This price will include all the costs incurred to get the product delivered to the buyer’s destination.
An export parity price is defined as the price that a local seller could receive by selling his product on the world market e.g., excluding the export costs. The price which the seller obtains is based on the condition that he delivers the product at the nearest export point (usually a harbour) at his own expense.
The graph below reflects the Safex price, import parity and export parity of yellow maize as well as the Safex price of white maize. The import and export parity prices for white maize is not released by Grain SA for this period.
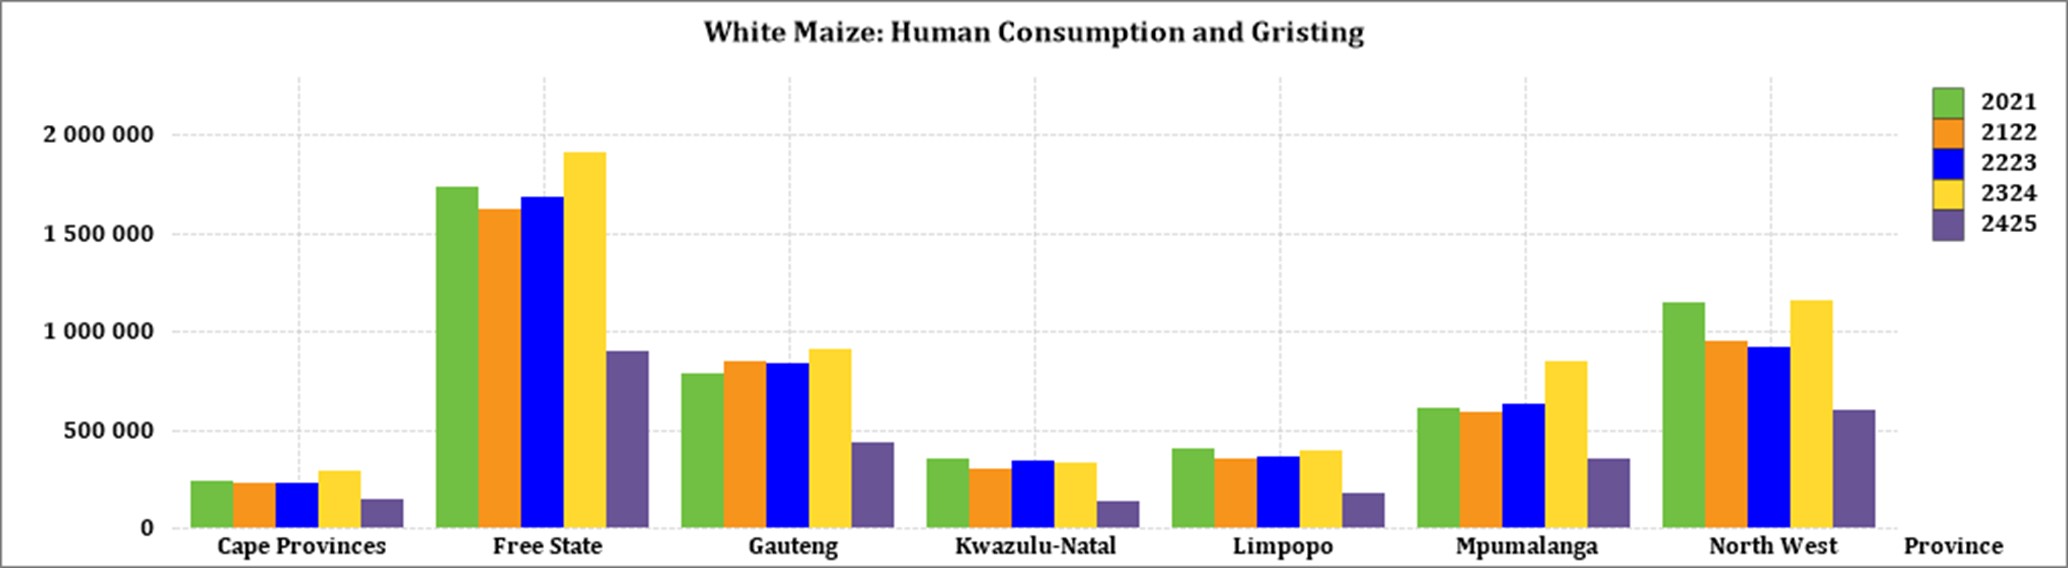
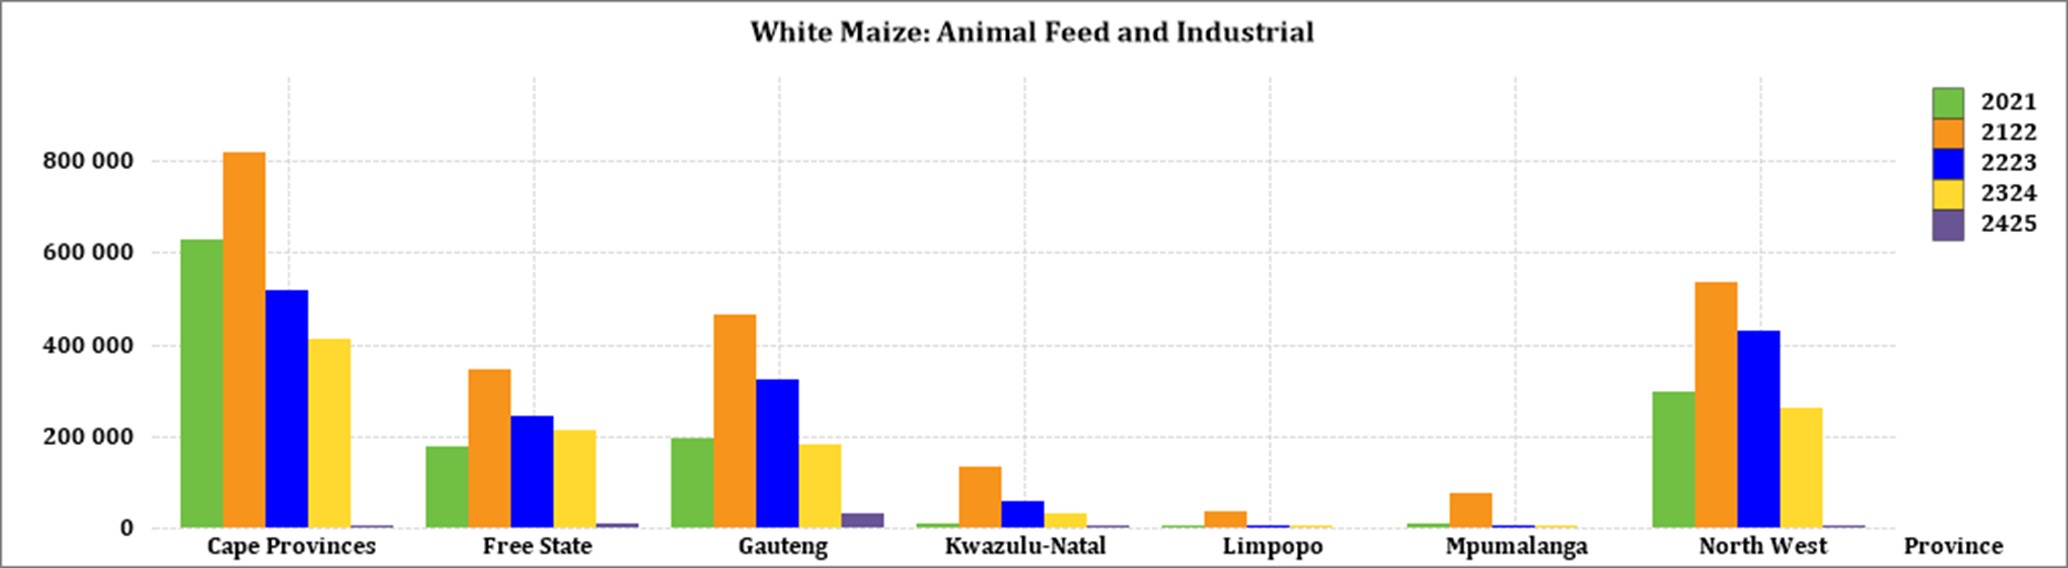
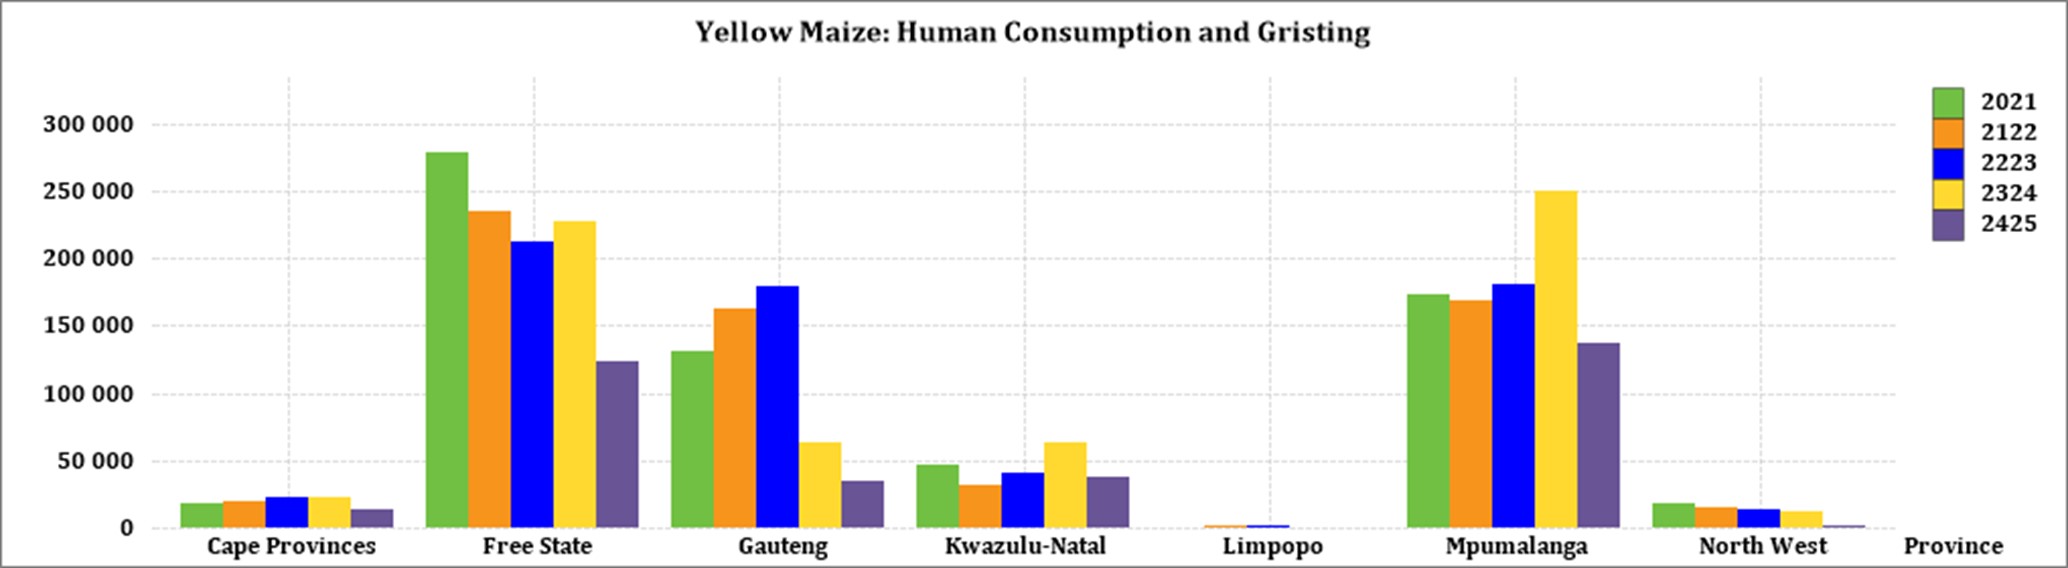
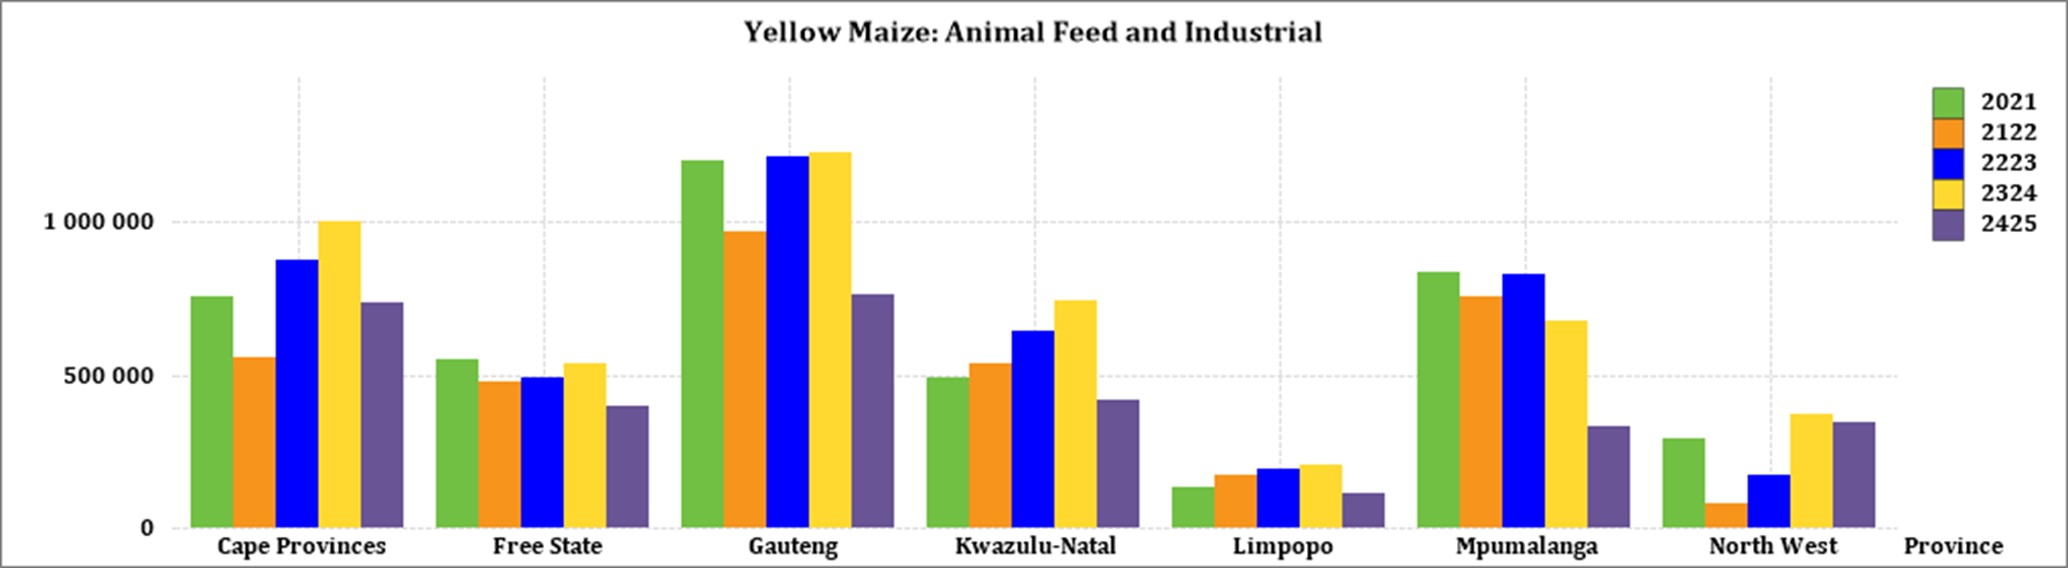
• Grain processing per province
For the marketing year which is May to April (2024/2025), the Free State province dominates the white maize that is used for human consumption and gristing. North West consumed the second most white maize produced for human consumption for the marketing year, 2024/2025.
Gauteng used the most, white maize for animal feed and industrial usage with the Free Sate using the second most.
Mpumalanga processed the most yellow maize for consumption and gristing and Gauteng processed the most yellow maize for animal feed and industrial purposes.
• Exchange rate
NWK Group is exposed to foreign exchange rate risk in various business areas, such as commodity prices and trade imports, etc.
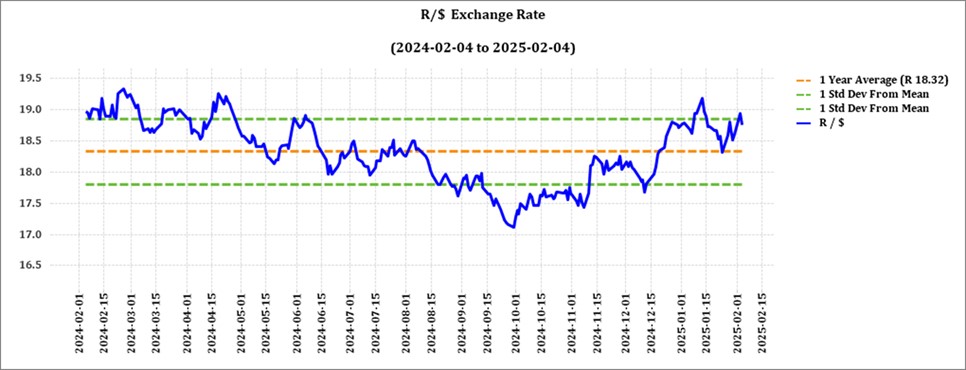
The rand traded at a monthly average of R18,72 against the dollar for the month of January. Although not great, it is slightly better than a year earlier.
Dawie Roodt mentioned that South African markets are acting strange. Markets performed well despite Trump’s order and threats of losing its AGOA benefits, tariffs and sanctions. On 15 February 2025, the rand strengthened from R18,99 to R18,37.
Equity markets also performed well as the JSE Top 40 Index increased significantly in February and reached an all-time high last week. The only explanation he could see was that the market expects South Africa to reach an agreement with the Trump administration and that South Africa will agree to most of Trump’s demands.
Source: Trading Economics
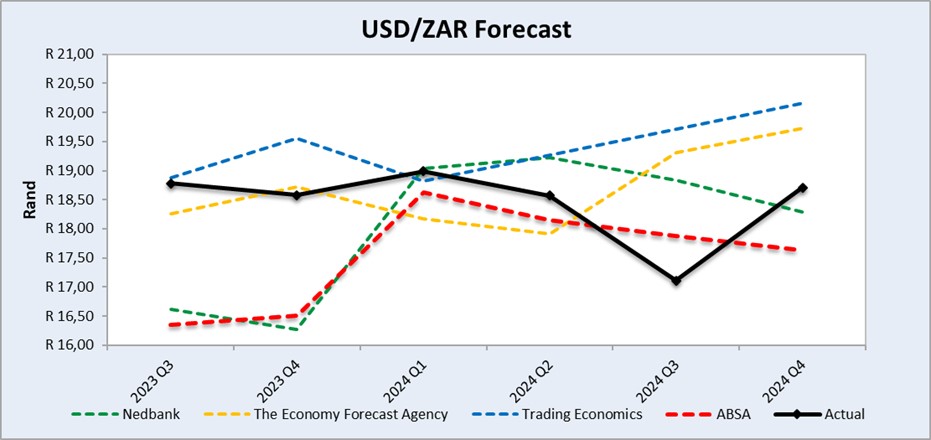
Source: Nedbank CIB; The Economic Forecast Agency; Trading Economics.
The graph above shows the actual USD/ZAR for 2023 Quarter 3 (Q3) to 2024 Quarter 4 (Q4) against the forecasted figures.
• Interest rate risk
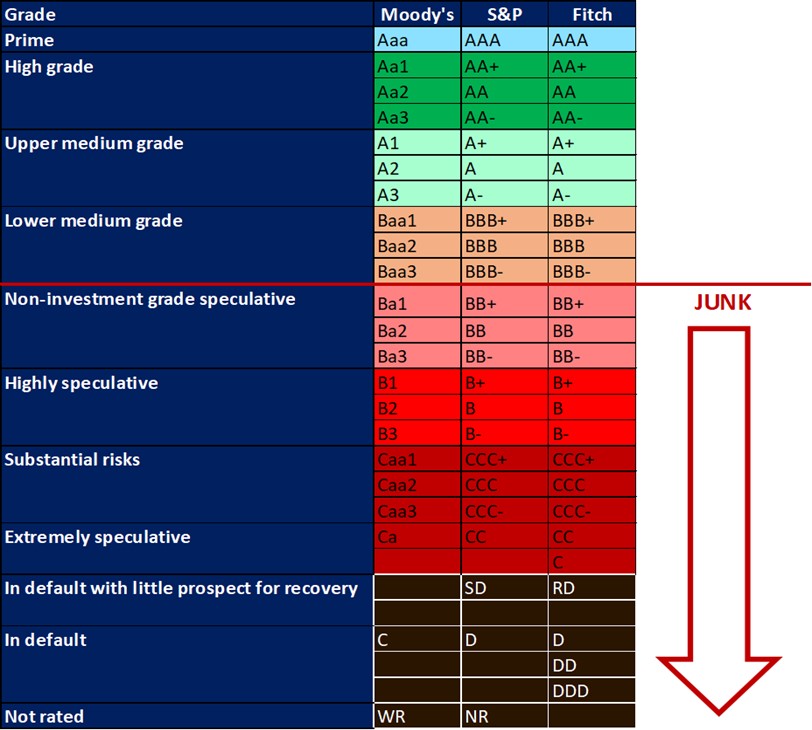
On 27 March 2020, Moody’s downgraded South Africa’s sovereign credit rating to sub-investment grade and placed a negative outlook on the rating. The key drivers for this downgrade include weak economic growth, continuous deterioration in fiscal strength, and slow progress on structural economic reforms. It is now the first time in post-apartheid South Africa that all major rating agencies, i.e., Moody’s, Fitch, and S&P, have South Africa’s credit ratings in sub-investment grade territory. More than a year later and our Moody’s rating remains the same.
During the previous Monetary Policy Committee (MPC) meeting held on 230 January the committee decided that interest rates will decrease with 25-basis points. The repo rate is currently 7,5% and the prime rate is 11%.
Interest rate movement:
26th January 2023 – 10,75%
30th March 2023 – 11,25%
25th May 2023 – 11,75%
20th July 2023 – 11,75%
21th September 2023 – 11,75%
23rd November 2023 – 11,75%
27th March 2024 – 11,75%
30th May 2024 – 11,75%
18th July 2024 – 11,75%
19th September 2024 – 11,50%
21st November 2024 – 11,25%
30th January 2025 – 11,00%
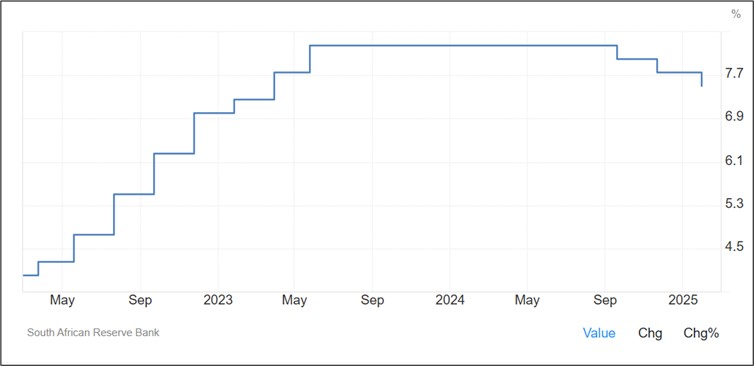
Source: South African Reserve Bank
The South African Reserve Bank reduced its key interest rate by 25 basis points to 7,5% on 30 January 2025, as anticipated, marking the third successive reduction. While inflation remained well-contained, the central bank noted that the medium-term outlook was more uncertain than usual. Inflation is expected to remain in the bottom half of the target range during the first half of this year, but the medium-term projections are closer to 4,5%, with upside risks, especially from global factors.
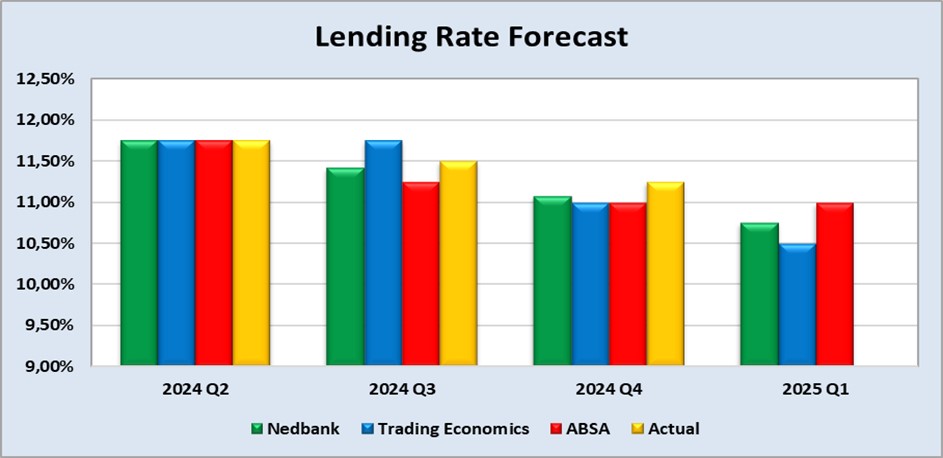
Interest rate (lending rate) forecast
The benchmark interest rate in South Africa was last recorded at 7,5%. Interest rate in South Africa is expected to be 7,5% by the end of this quarter, according to Trading Economics global macro models and analysts’ expectations. In the long-term, the South African interest rate is projected to trend around 5,5% in 2026, according to our econometric models.
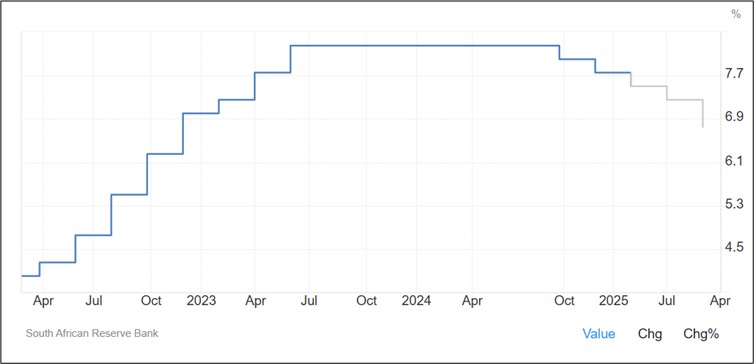
The following graph shows the prime rate forecast for 2024 Quarter 2 to 2025 Quarter 1.
• Inflation rate
As the inflation rate is a driver for increases and decreases in interest rates the current rate and forecast have to be assessed to foresee further increases in the interest rate.
Current: South Africa’s inflation rate rose for the third month to 3,2% in January 2025, the highest in four months, compared with market forecasts of 3,3%. The inflation rate remains below the South African Reserve Bank’s preferred midpoint target of 4,5%.
The primary drivers of the increase were food and non-alcoholic beverages (+2,3%), housing and utilities (+4,5%), and restaurant and hotels (+4,9%). The core inflation rate eased to 3,5% in January 2025, the lowest since February 2022, from 3,6% in December 2024. On a monthly basis, consumer prices increased by 0,3%, after a 0,1% rise in the prior month.
Source: Statistics South Africa.
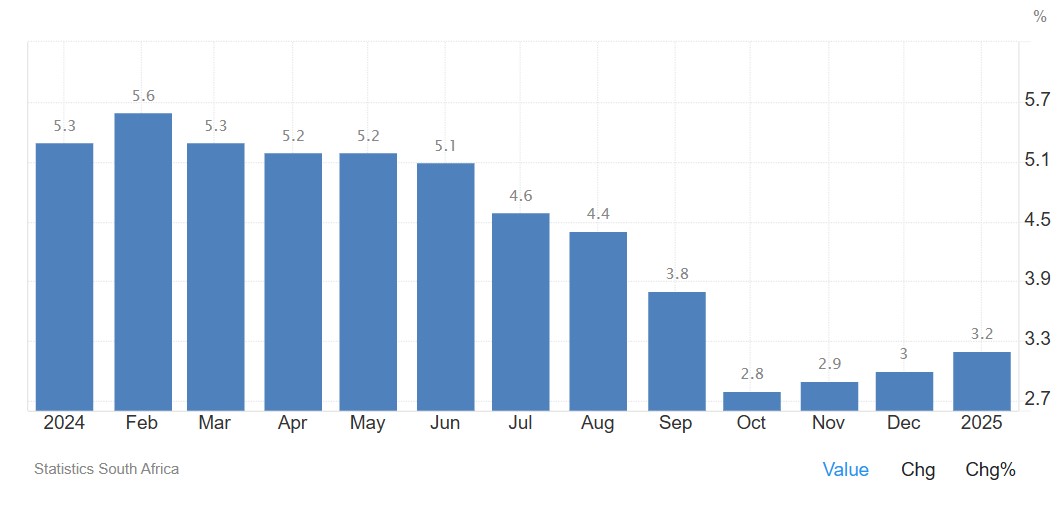
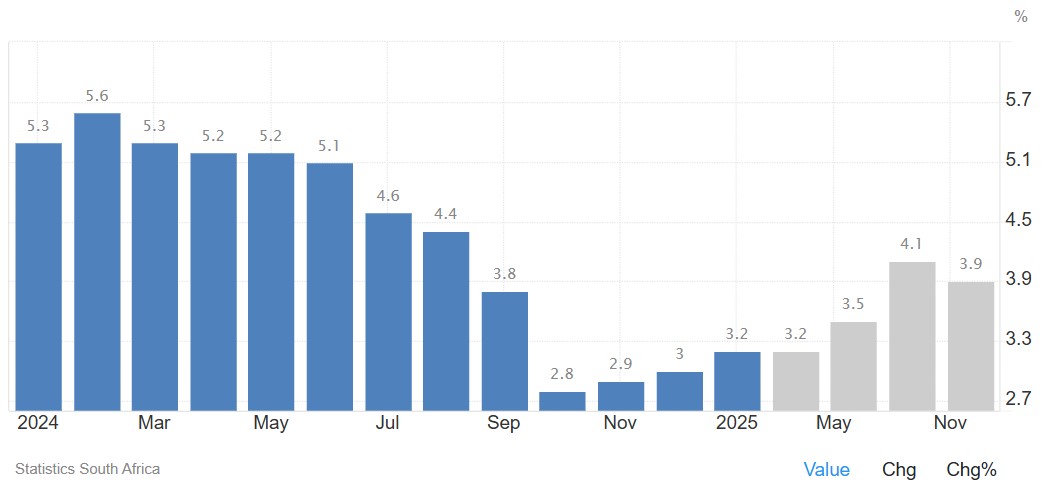
Inflation rate in South Africa increased to 3,2% in January 2025 from 3% in December of 2024. It is expected to be 3,2% by the end of this quarter, according to Trading Economics global macro models and analysts’ expectations.
In the long-term, the South African inflation rate is projected to trend around 4,6% in 2026 and 4,5% in 2027, according to their econometric models.
Source: https://tradingeconomics.com/south-africa/inflation-cpi
• Highlights in the agrochemical sector
In August 2024, herbicide prices saw a 20% decrease compared to August 2023, primarily due to the appreciation of the South African rand and a drop in international market prices for these chemicals. Insecticide prices also decreased, but by a smaller margin of about 15% year-on-year. This was partly influenced by similar global pricing trends, but the situation surrounding cypermethrin, an insecticide from India, played a significant role.
China launched an anti-dumping investigation into cypermethrin imports from India, which increased costs for Indian suppliers. This move, reduced competitive pressure from Indian exports, potentially benefiting domestic producers in South Africa by limiting cheaper foreign competition. While herbicide and insecticide prices are down, fertiliser prices on the other hand are rising.
Source: Mordorintelligence.com
Researchandmarkets.com
1. HERBICIDES
The following products are the main products regarding herbicides that may have an impact on input costs for producers.
Glyphosate (95%)
Acetochlor (92%)
Atrazine (97%)
Metolachlor (97%)
Trifluralin (95%)
The following comparison is from the January 2025 Grain SA report which reports the previous month’s prices.

In comparison with the previous year’s prices, all of the products experienced a price decrease. Acetochlor had the biggest decrease with 31,81%.
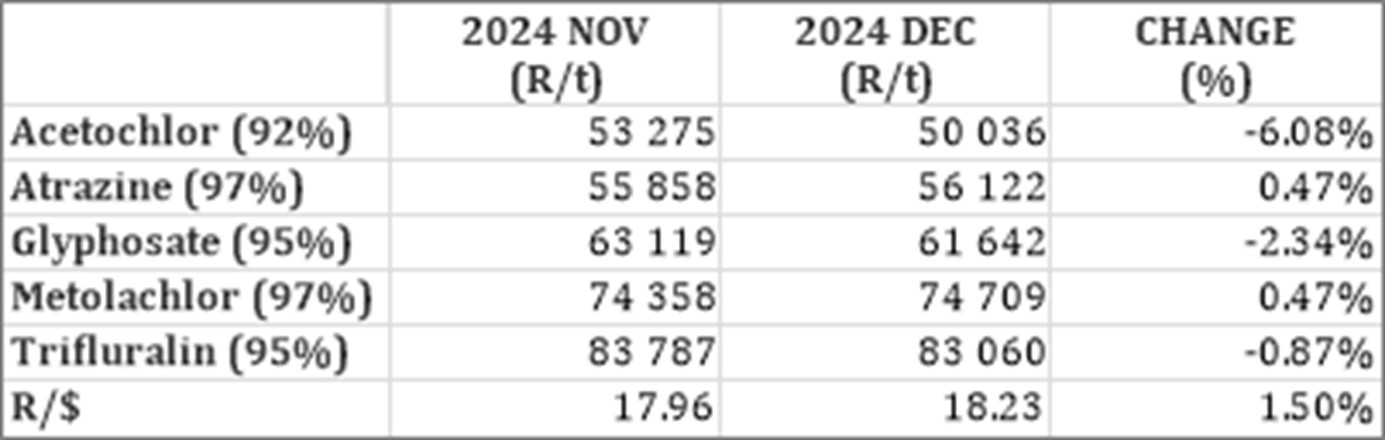
For the two months compared most of the products experienced a slight price decrease. Acetochlor experienced the biggest decrease with 6,08%.
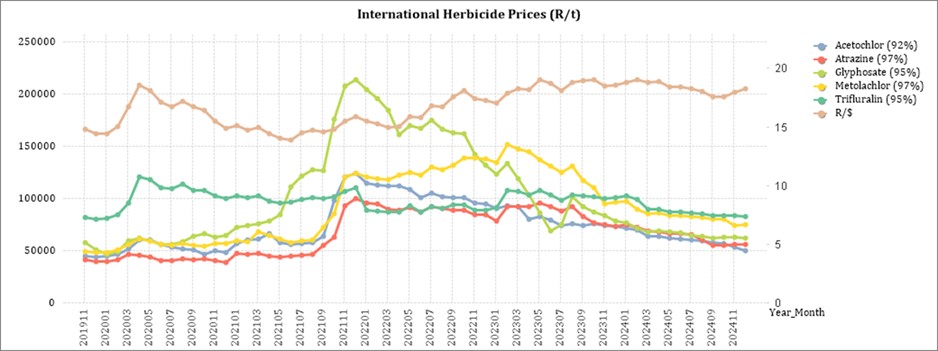
The graph below shows the international herbicides prices (R/t) per product from November 2019 to date.
2. INSECTICIDES
The following products are the main products regarding insecticides that may have an impact on input costs for producers.
Imidacloprid (95%)
Lambda-cyhalothrin (95%)
Carbofuran (99%)
Deltamethrin (98%)
Acetamiprid (95%)
Chlorpyrifos (95%)
Cypermethrin (94%)
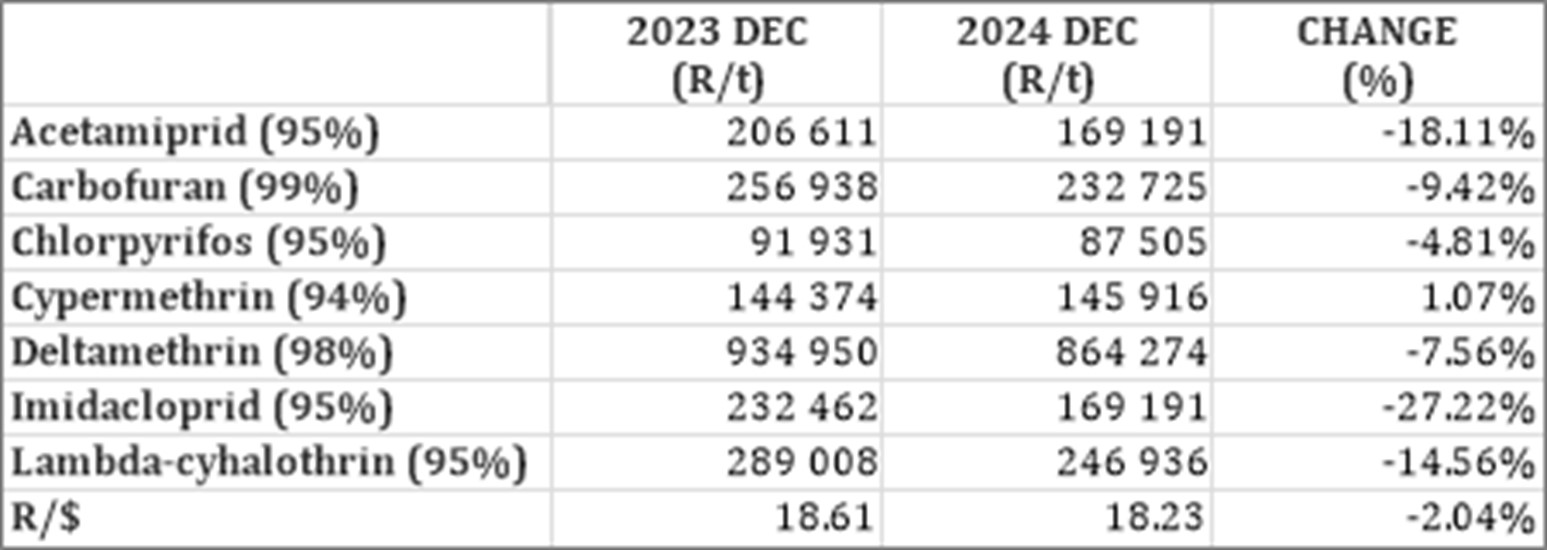
In comparison with the previous year’s prices, six of the products experienced a price decrease. One of the products, however, experienced an increase. Cypermethrin increased with 1,07%.
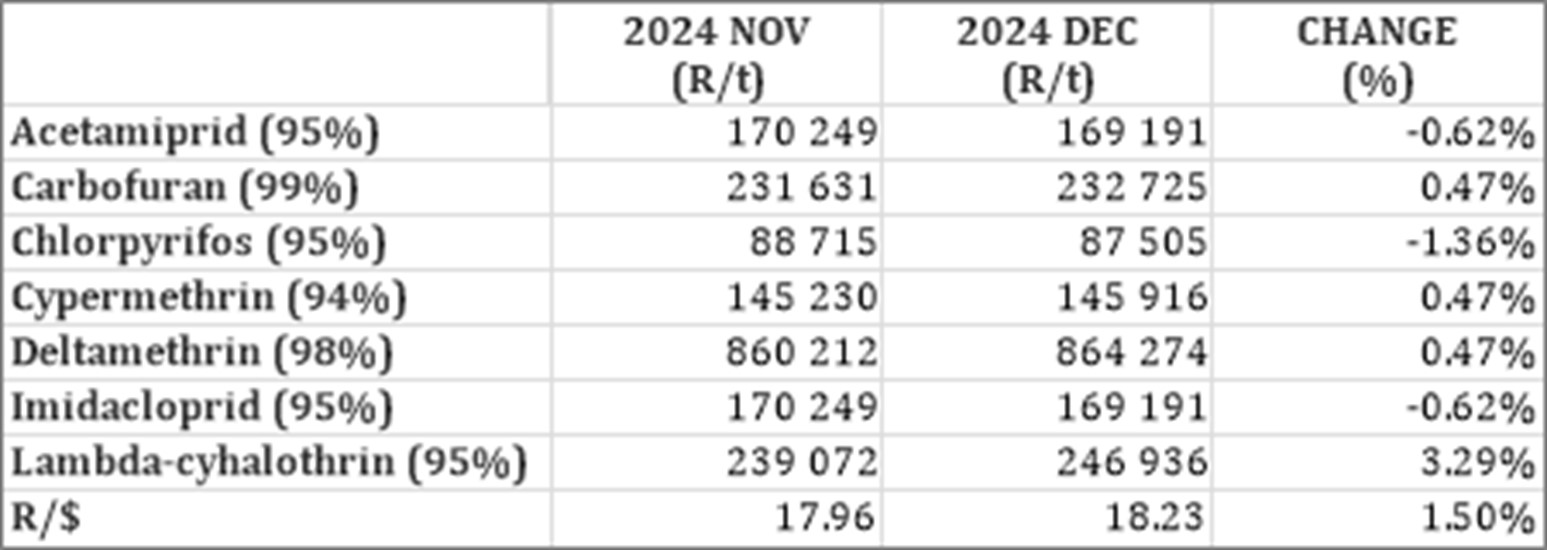
For the two months compared three of the products experienced a price decrease. The rest of the product prices increased, Lamda-cyhalothrin experienced the biggest increase of 3,29%.
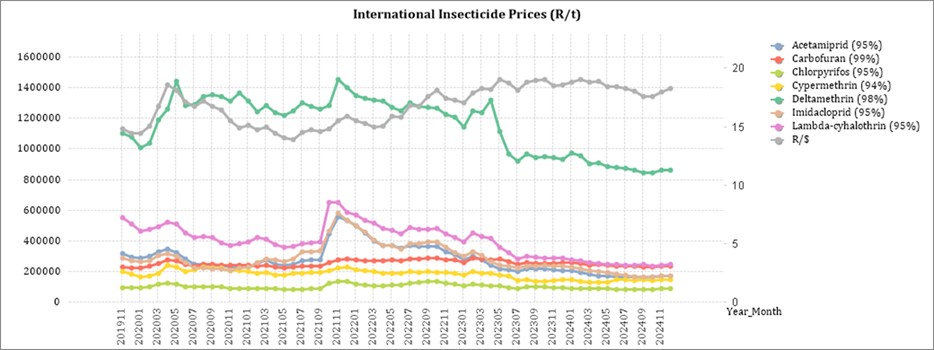
The graph below shows the international insecticide prices (R/t) per product from November 2019 to date.
3. FERTILISER
The following fertiliser products are being analysed:
Ammonia (Middle East)
Urea (46%) (Eastern Europe)
DAP (USA Gulf)
KCL (CIS)
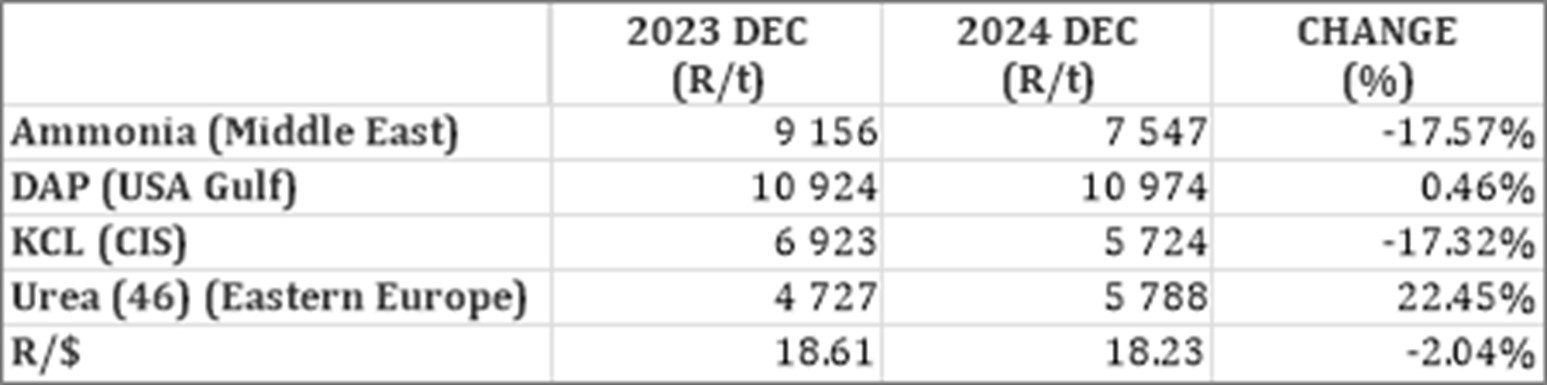
In comparison with the previous year’s prices, two of the products experienced price decreases with Ammonia decreasing the most 17,57%. Urea on the other hand increased with 22,45%.
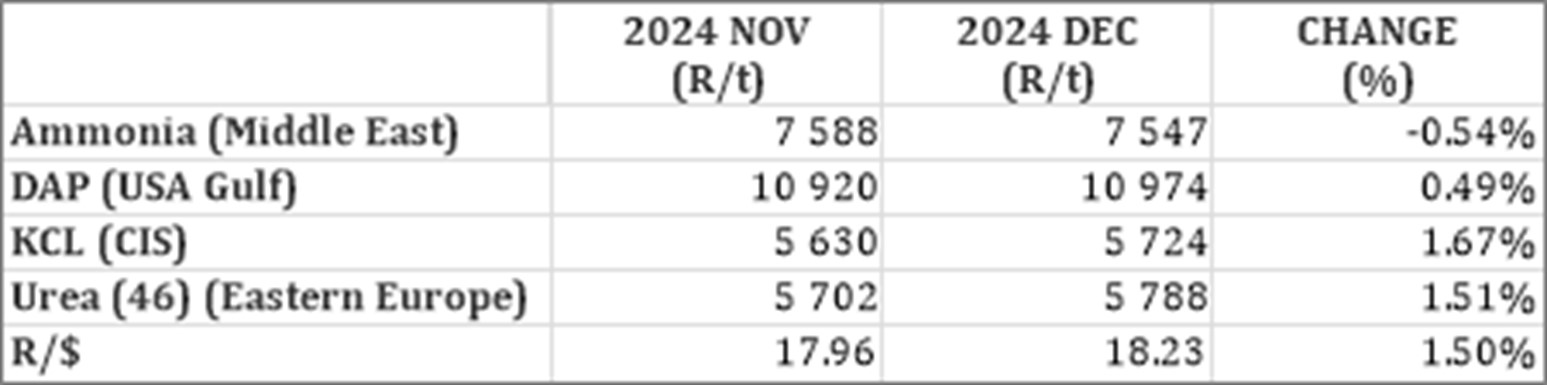
In comparison with the previous month’s prices, most of the products experienced slight price increases with KCL increasing the most with 1,67%.
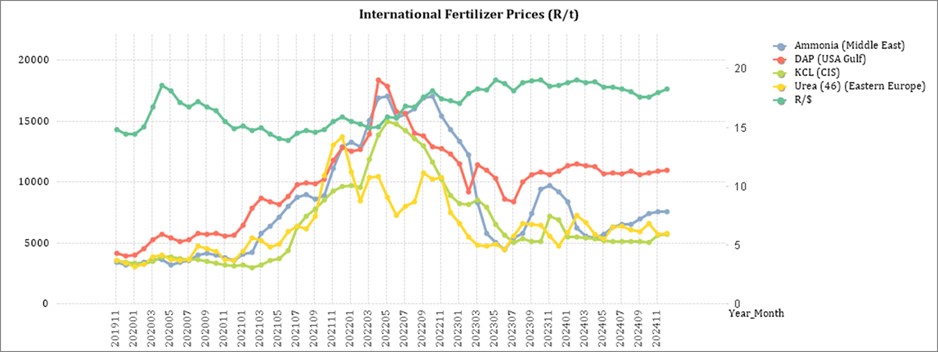
The graph below shows the International Fertiliser prices (R/t) per product from November 2019 to date.
Nitrogen:
Urea: Iran and China reduced their urea exports and due to increased demand in North America, Europe and Asia, prices have increased. Prices are expected to increase to $400. Looking at nitrates, prices are increasing as factories are closing as input costs are too high. South Africa has an adequate supply of fertiliser for now. Fertiliser are rising and remain higher than pre-Covid levels.
Ammonia: Globally prices are declining, with the East leading the way.
Phosphate: China have constricted their supply as they are saving it for their own farmers. Brazil farmers are purchasing less MAP fertiliser due to lower crop prices.
Potash: Brazil’s planting season is starting soon and as a result Brazil purchased a lot of potash and this caused prices to increase. South Africa has enough potash reserves for now.
*CFR: Cost and Freight terms
Sources: FCurve /F Curve Insight
https://www.grainsa.co.za/upload/report_files/Chemical-and-Fertilizer-Report-Aug-2024.pdf
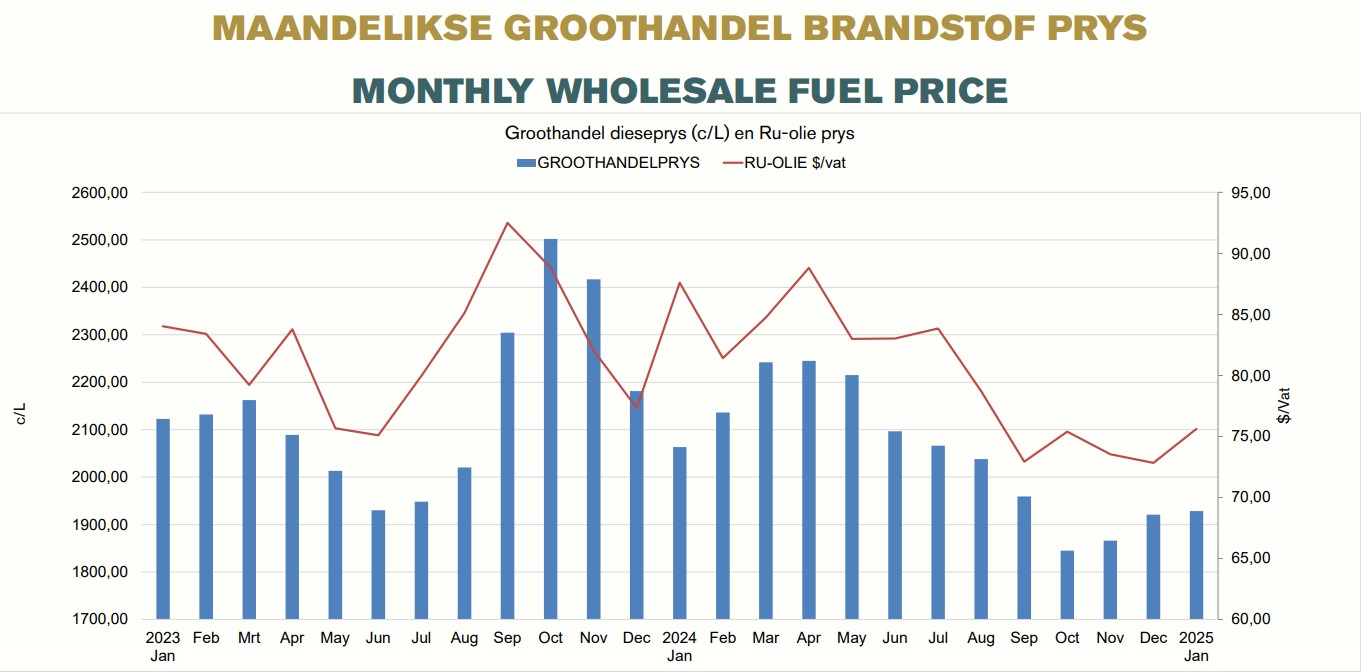
Monthly wholesale fuel price
Fuel prices are expected to rise in February 2025, with diesel facing the largest increase. As of January 15, 2025, diesel has a 101,4 c/liter under-recovery, while petrol (95) has an 83,76 c/liter under-recovery.
US sanctions on Russian vessels and oil insurers are threatening supply, while the US dollar strengthens due to expectations of higher interest rates. This has caused the rand to remain near the R19/$ level.
Additionally, tensions in the Middle East and colder winter conditions in the Northern Hemisphere, increasing demand for heating fuel, are further straining global oil supply. As a result, crude oil prices have surpassed $80 per barrel.
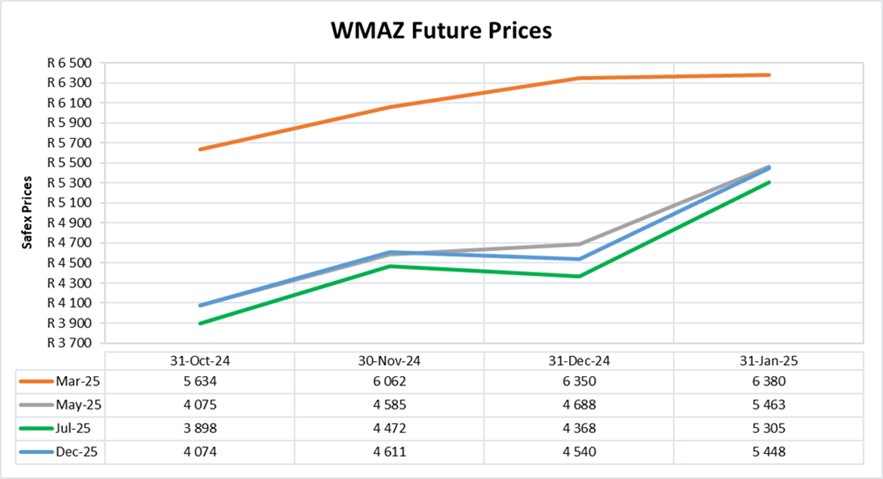
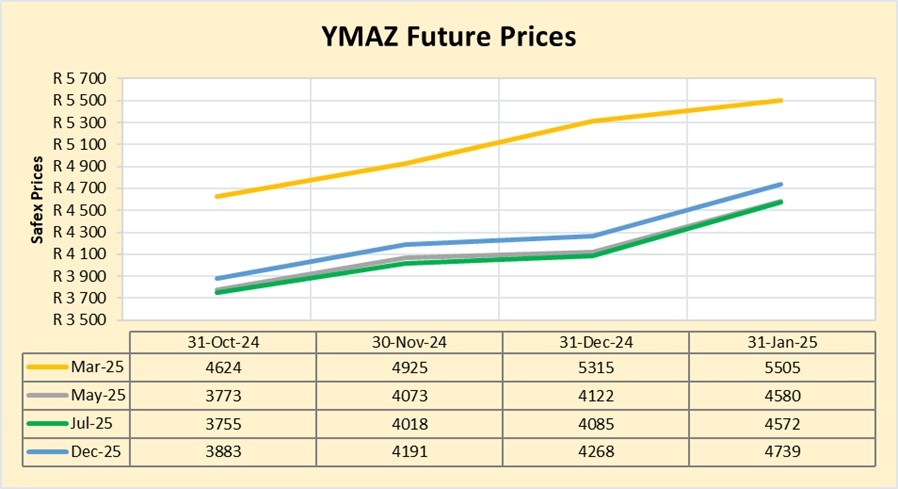
Future prices
The graphs below illustrate the market sentiment for maize, in the form of future contracts, for the upcoming contract months. The market sentiment is the expectation of supply and demand fundamentals relating to white and yellow maize in South Africa.
DOMESTIC MARKET OVERVIEW
The situation with white maize prices in South Africa sounds quite concerning, especially with the projected tight stocks for the 2024/2025 marketing year. The 55% increase in the price compared to the previous year signals some significant supply constraints. With stock levels at just 277 884 t by 30 April 2025, it’s clear that South Africa might face some major challenges in meeting demand, especially given the higher consumption rates.
The forecast for relief in the second quarter of 2025, as production picks up, offers a glimmer of hope. As seen in the graphs above prices are predicted to ease later this year compared to higher spot prices in March 2025. Early deliveries for the 2025/2026 marketing year could also help alleviate some of the pressure on the market, assuming the new crop is sufficient to meet the demand.
It will be interesting to see how the market responds as we move into the second quarter and whether the anticipated relief materializes in time. The imported white maize will also bring some relief.
Sources: https://agbiz.co.za/article/south-african-white-maize-prices-may-remain-high-for-some-time-143
https://www.moneyweb.co.za/news/south-africa/sa-receives-first-shipment-of-imported-white-maize-since-2017/
Fraud risk
FRAUD AWARENESS
Fraud comes in many shapes and sizes, but the hassle to reclaim what was stolen remains the same. For the next few months, this section will be identifying several types of cyber fraud with an example and a few tips on prevention strategies that might come in handy one day.
Type of cyber fraud:
Business Email Compromise (BEC): BEC occurs when cybercriminals infiltrate business email accounts to carry out fraudulent schemes. Typically, attackers use these compromised accounts to approve unauthorised wire transfers or deceive employees into completing financial transactions. One common variation, known as CEO fraud, involves criminals impersonating top executives to persuade employees to transfer funds, underscoring the susceptibility of organizations to these advanced attacks.
Cyber fraud example
BEC scam on Toyota Boshoku Corporation: In 2019, Toyota Boshoku Corporation, a subsidiary of Toyota, was targeted by a Business Email Compromise (BEC) scam. Cybercriminals posed as a legitimate business partner and successfully deceived the company into transferring around $37 million to fraudulent accounts. This incident underscored the financial risks and complexity of BEC attacks, even for large corporations.
Cyber fraud prevention strategies:
- Hold regular cybersecurity awareness training sessions to inform employees about the dangers of phishing emails, the need to verify sender information, and the threat of BEC attacks.
- Implement email authentication protocols to confirm the legitimacy of incoming messages.
- Ensure that all software is up-to-date. Keep email servers, antivirus programs, and other security tools current to safeguard against potential vulnerabilities.
Source: https://www.tookitaki.com/glossary/phishing
https://staysafeonline.org/resources/business-email-compromise-what-it-is-and-how-to-prevent-it/


