The NWK Limited external factors report provides an overview of the main external factors that NWK and its clients are exposed to at a specific point in time. This report opts to aid in a timely basis to foresee external market and other factors that may have an impact on any business and clients. The main focus of this document is to have a closer look at external factors that can affect any business and our customers.
Executive summary
External factors that can affect any business and its customers include various economic factors. This report will focus on monthly or quarterly changes of these economic factors.
The inflation rate inched up to 3,5% in July 2025, marking the second consecutive monthly increase. Retail trade decreased moderately to 1,6% in June 2025. The unemployment rate rose further to 33,2% in the second quarter of 2025. The GDP growth for the first quarter of 2025 expanded with 0,1%, following a revised 0,4% contraction in Q4 of 2024. The Policy Uncertainty Index eased to 75,9 in Q2 2025 compared to its record high of 78,6 in Q1 2025, but for now remains well in negative territory.
An external factor that is of great concern to any agricultural business is the weather and climate outlooks. These factors include long term climate risks, such as drought and heat stress, as well as the current status of the El Niño and La Niña climate phenomenon. The El Niño Southern Oscillation (ENSO) is currently ENSO neutral, neutral conditions are expected to persists until summer.
The National Agricultural Marketing Council (NAMC) projected the ending stock for 30 April 2026 for white and yellow maize to be more than that of the 2024/2025 marketing season. The projected soybean ending stock for February 2026 is 437 979 t – that is more than the final for the 2024/2025 season of 140 704 t. The projected sunflower ending stock for February 2026 is 72 579 t which is less than the final for the 2024/2025 season of 72 789 t.
During the previous Monetary Policy Committee (MPC) meeting held on 31 July the committee decided that interest rates will remain the same. The repo rate is currently 7% and the prime rate 10,5%.
Business climate – key risk drivers
A few highlights regarding certain risk drivers are mentioned below.
According to Trading Economics, South Africa’s annual inflation rate inched up to 3,5% in July 2025. The inflation rate is expected to be 3.6% by the end of this quarter. In the long-term, the South Africa Inflation Rate is projected to trend around 3,3% in 2026 and 3% in 2027.
Brent crude oil monthly average prices decreased by $0,78 per barrel. Iron ore increased by $1,.90 per metric ton on a monthly average.
South Africa’s retail trade increased to 1,6% compared to a year ago in June 2024, moderating from a 4,3% surge in the prior month. According to Statistics SA, South Africa’s unemployment rate rose further to 33,2% in Q2 2025.
The GDP growth rate increased by 0,1% in the first quarter of 2025. Four of the ten industries experienced an increase. The Agriculture sector was the largest positive contributor, increasing by 15,2%.
The Safex maize prices decreased month-on-month by about 5,1% for white maize and 3,7% for yellow maize. The latest production forecast from the Crop Estimates Committee (CEC) reflected a 1,68% upward revision in maize production compared to the previous estimate, bringing total production to 15 million tons and well above domestic consumption needs.
The El Niño–Southern Oscillation (ENSO) is currently ENSO Neutral. As of mid-August 2025, the equatorial Pacific is in an ENSO-neutral state. Neutral conditions are predicted to persist until January 2026. The solar cycle is in a downward trend for the current 11-year cycle which means possible less rain for the following season to come. The turning point is predicted to be in 2025.
The Policy Uncertainty Index (PUI) eased to 75,9 in Q2 2025 compared to its record high of 78.6 in Q1 2025. Externally, while the global outlook is highly uncertain, in the trade front there has been partial respite as the US administration has suspended most, but not all, tariff hikes until July 9, pending further negotiations. Internally, although there have been some positive developments, they were outweighed by negative factors.
Sources
https://tradingeconomics.com/south-africa/inflation-cpi
https://tradingeconomics.com/commodity/brent-crude-oil
https://tradingeconomics.com/south-africa/unemployment-rate
https://www.statssa.gov.za/?page_id=737&id=1
https://tradingeconomics.com/south-africa/gdp-growth
https://agrink.co.za/downloads/ABSA%20Agri%20Trends%20Grains%20and%20Veggies.pdf
https://tradingeconomics.com/commodity/iron-ore
PUI_2025Q2.pdf
Agribusiness Confidence Index (ACI) Q2, 2025
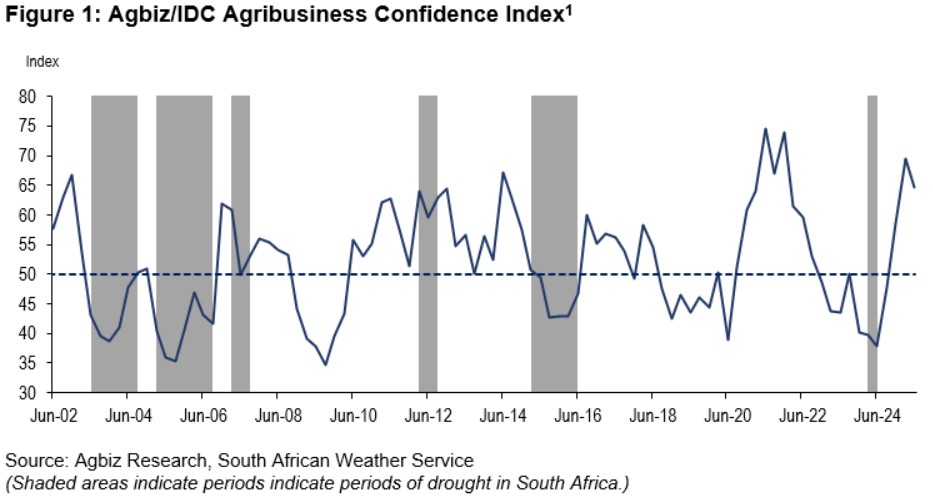
The Agricultural Business Chamber (Agbiz) conducts a quarterly survey to compile the Agribusiness Confidence Index (ACI), reflecting the views of at least 25 decision-makers in the agricultural sector. Released on 17 March 2025, the latest index evaluates ten critical factors impacting agribusiness: turnover, net operating income, market share, employment, capital investment, export volumes, economic growth, general agricultural conditions, debtor provisions for bad debt, and financing costs.
After a notable uptick in Q1 2025, the Agbiz/IDC Agribusiness Confidence Index (ACI) fell by five points in Q2 2025 to 65. Most respondents pointed to the uncertain global trade environment, lingering geopolitical tensions, and the domestic animal disease challenge as some of the key factors constraining the sector.
Despite the slight decline, the current level of the ACI, implies that South African agribusinesses remain optimistic about business conditions in the country. The better summer rains and improvements at the ports which have enabled exports with minimal interruptions, are some of the positives. This survey was conducted in the second week of June, covering various agribusinesses operating in all agricultural subsectors across South Africa.
DISCUSSION OF THE SUBINDICES
The ACI comprises ten subindices; six of them declined in Q2 2025, while the rest remained unchanged. Here is the detailed view of the subindices:
The turnover subindex confidence is down by 5 points to 55 in Q2 2025. We observed a deterioration in sentiment among agribusinesses operating in the red meat sector, while others maintained a roughly unchanged view from the previous quarter. Similarly, the net operating income subindex fell by 5 points to 65 points in Q2 2025. The drivers were the same as the turnover.
The sub-index measuring export sentiment volume fell by 40 points to 60 in Q2 2025. This is still a relatively favourable level. For example, in Q1 2025, South Africa’s agricultural exports totalled US$3,36 billion, up 10% from the same period a year ago, according to data from Trade Map. Thus, the decline in sentiment in Q2 is a normalisation.
The general economic conditions subindex fell by 15 points to 50 in Q2 2025. This indicates concerns about growth prospects this year due to both domestic and global constraints.
The market share of the agribusiness subindex fell by 5 to 65 points in Q2 2025. Most respondents maintained an essentially unchanged view, which enabled the high base to lead to a mild decline in sentiment.
Unchanged view
The employment subindex remained flat from the previous quarter at 55 points in Q2 2025. The generally favourable sentiment reflects the upbeat production conditions in field crops and horticulture.
The capital investments subindex was unchanged from Q1 2025 at 75 points. This is unsurprising, as high-frequency data, such as tractor and combine harvester sales, have remained strong in the first five months of this year.
The general agricultural conditions subindex was unchanged from Q1 2025 at 75 points. This is unsurprising, as high-frequency data, such as tractor and combine harvester sales, have remained strong in the first five months of this year.
Changes in interpretation
The subindices of the debtor provision for bad debt and financing costs are interpreted differently from the abovementioned indices. A decline is viewed as a favourable development, while an increase signals growing financial strain.
In Q2 2025, the financing costs indices increased by 10 points to 85. This came as a surprise, as the easing interest rates in the country would have made the financing environment better.
However, the debtor provision for bad debt was unchanged from Q1 2025 at 50. The subindex remaining at this level suggests that some farmers may still face financial pressures from the previous season, and there will likely be more from the livestock industry, which is currently struggling with foot-and-mouth disease.
Concluding remarks
The Q2 2025 ACI results show continued optimism in South Africa’s agricultural sector, though recovery is expected to be uneven due to animal disease in some subsectors. Geopolitical concerns highlight the sector’s reliance on exports and the need to diversify into markets like China, India, Saudi Arabia, and Egypt, while maintaining access to existing ones in the EU, UK, Africa, Asia, the Middle East, and the Americas.
Agbiz chief economist Wandile Sihlobo emphasizes the importance of public-private collaboration to address biosecurity, improve infrastructure and municipal management, and implement the Agriculture and Agro-processing Master Plan for long-term growth.
ISSUED BY:
Wandile Sihlobo
Chief Economist, Agricultural Business Chamber of South Africa (Agbiz)
E-mail: wandile@agbiz.co.za
Source: https://agbiz.co.za/content/economic-research?page=agribusiness-confidence
Fact of the month
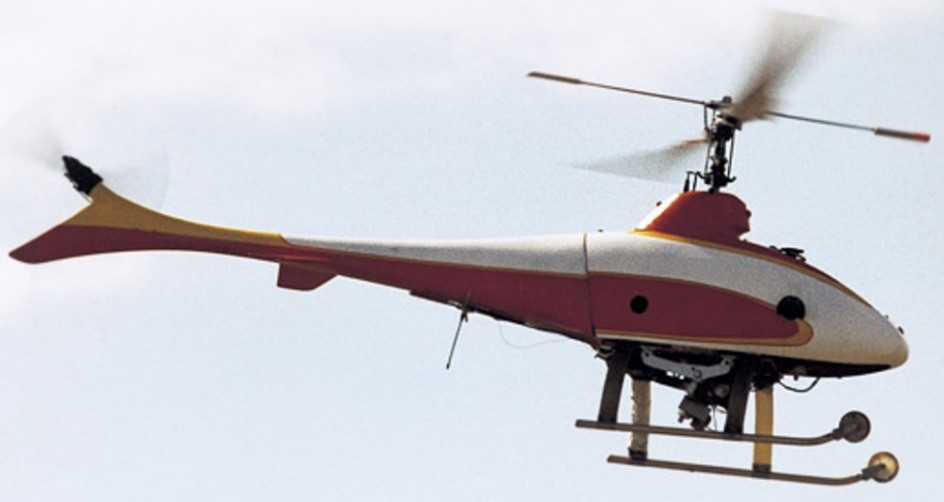
The first unmanned agricultural drone was invented in 1987. The Japanese manufacturer, Yamaha Motors, invented the revolutionary R-50 unmanned agricultural drone. It was designed to assist farmers with field analysis and crop mapping.
Equipped with a GPS and camera, the R-50 could gather valuable data on crop size, health and development. This information proved to be a game-changer, allowing farmers to make informed decisions about their crops. The R-50 was the milestone that helped with the rapid advancements of drone technology, leading to a wider range of agricultural drones for various purposes.
Today’s agricultural drones can be used for tasks like sowing seeds, monitoring crop health, and spraying crops.
Source
https://www.thedroneu.com/blog/history-of-drones-in-agriculture/#A_History_of_Drones_and_their_Agricultural_Evolution
https://global.yamaha-motor.com/stories/history/stories/0028.html
Weather and climate
NATIONAL ASSESSMENT
As of mid-August 2025, the equatorial Pacific remains in an ENSO-neutral state, with sea surface temperatures in the Niño 3.4 region close to average. The IRI ENSO plume forecast indicates a moderate probability (68%) of ENSO-neutral conditions for August to October 2025. These neutral conditions are expected to persist through the end of the forecast period.
However, during September to November and October to December, the probabilities for ENSO-neutral decrease slightly to 49% and 50%, respectively, but remain higher than those for either La Niña or El Niño. During these two overlapping seasons (SON and OND), the probability of La Niña development increases to 39% and 44%, respectively. Looking ahead to the 2025/2026 winter and spring periods, ENSO-neutral once again becomes the dominant category, with gradually increasing probabilities.
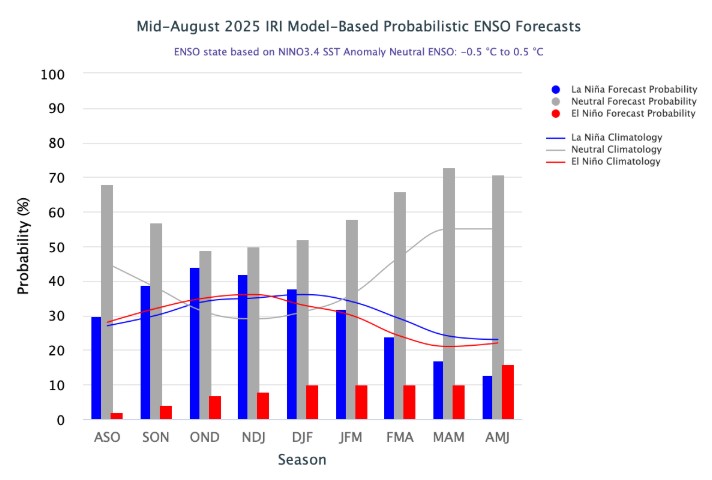
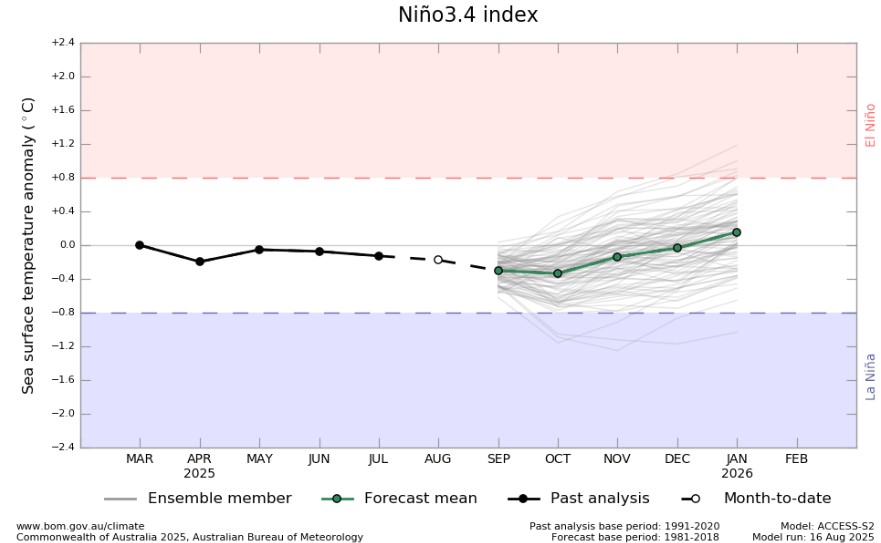
The Bureau of Meteorology’s model suggest SSTs are likely to remain within the ENSO-neutral range (-0.8 °C to +0.8 °C) throughout the forecast period to January 2026.

The graph below reflects the current neutral conditions and the ocean temperatures that are substantially above average, but still within the ENSO neutral range. The graph supports the prediction of an ENSO-neutral state throughout the forecast period to January 2026.
http://www.bom.gov.au/climate/ocean/outlooks/?index=nino34
The latest Climate Watch issued by the SA Weather Service (5 August 2025) states that above-normal rainfall is predicted for the eastern and south-eastern parts of the country early and mid-spring, which will is likely to benefit crop and livestock production. Conversely, below-normal rainfall is expected in most other areas of the country during early and mid-spring seasons.
However, below-normal rainfall is predicted for most parts of the country during the late-spring season, which could have a negative impact on agriculture. Therefore, the relevant decision-makers are encouraged to advise farmers to practice soil and water conservation, proper water harvesting and storage, and other appropriate farming practices.
Minimum and maximum temperatures are largely expected to be above-normal for the most parts during the spring seasons.
Source: https://www.weathersa.co.za/Documents/SeasonalForecast/SCOLF202503_31032025122337.pdf
SUNSPOTS
Sunspots are darker, cooler areas on the sun’s surface that arise due to disturbances in the sun’s magnetic field. Sunspots vary in numbers throughout the 11-year solar cycle.
According to a study published on Science Direct the rainfall rate can be directly related to the sunspot number, but shows different characteristics during solar maximum (the peak of the sun’s 11-year solar cycle) years. Though a lag correlation exists between sunspot number and rainfall, sunspots have an increasing effect on rainfall. Studies show that the more sunspots are present the higher the rainfall and the less sunspots the lower the rainfall.
ENSO (El Niño Southern Oscillation) occurs at irregular intervals between three and seven years causing global climate system variation. Considering this event occurs periodically, it might be triggered by the 11-year solar cycle as an energy source.
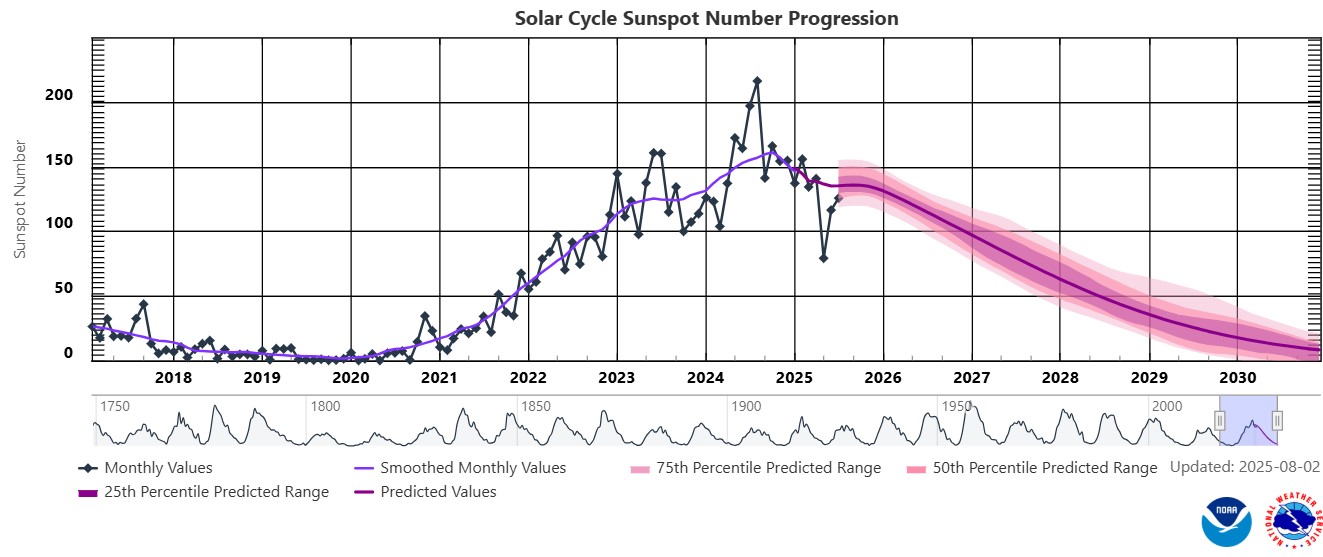
The graph below shows the latest 11-year solar cycle. An upward trajectory suggests that higher rainfall can be expected, characteristic of a La Niña. A downward trajectory suggests that lower rainfall can be expected, characteristic of an El Niña.
Since October 2020 to February 2025 the actual sunspot numbers were higher than the predicted values. July 2025 falls inside of the predicted range, with a monthly mean sunspot value for July 2025 is 125,6.
Sources
https://www.spaceweatherlive.com/en/solar-activity/solar-cycle.html https://www.sciencedirect.com/science/article/abs/pii/S136468262200116X#:~:text=It%20was%20observed%20that%20rainfall,an%20increasing%20effect%20on%20rainfall
https://www.space.com/solar-cycle-frequency-prediction-facts
https://eos.org/articles/why-did-sunspots-disappear-for-70-years-nearby-star-holds-clues https://aip.scitation.org/doi/abs/10.1063/1.4930679?journalCode=apc#:~:text=ENSO%20occurs%20at%20irregular%20interval,cycle%20as%20an%20energy%20source
Market risk
GRAIN MARKET ANALYSIS
- Ending stock – National
Ending stock data is gathered from the NAMC. The estimates are reassessed and reported by the Grain & Oilseeds supply & demand estimates committee. The following is the projected ending stock for April 2026 in tonnages for the 2025/2026 season:
- White maize => 974 712 t
- Yellow maize => 871 905 t
The following is a summary of September 2025 ending stock projections for the 2024/2025 season:
- Wheat => 624 138 t
The following is a summary of February 2026 projected ending stock for the 2025/2026 season:
- Sunflower => 72 579 t
- Soybeans => 437 979 t
- Sorghum => 79 687 t
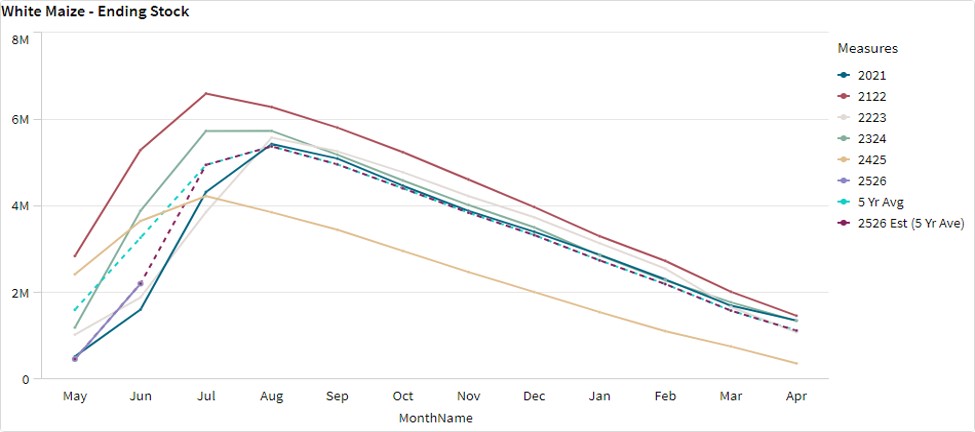
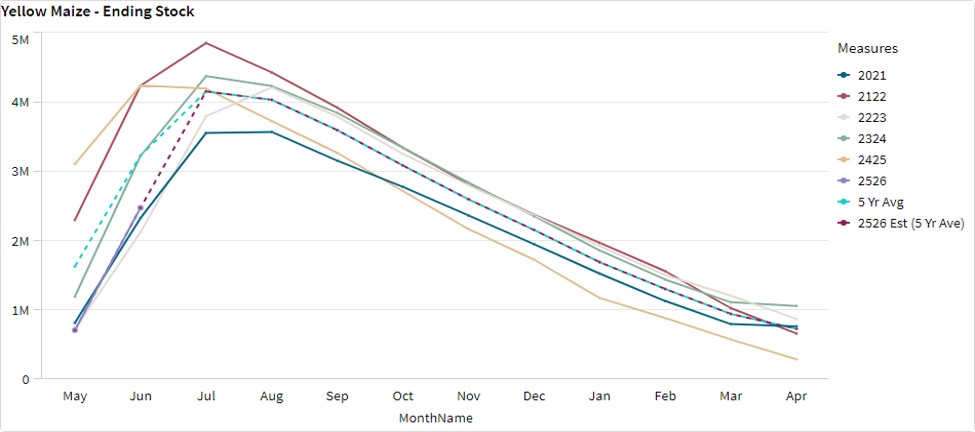
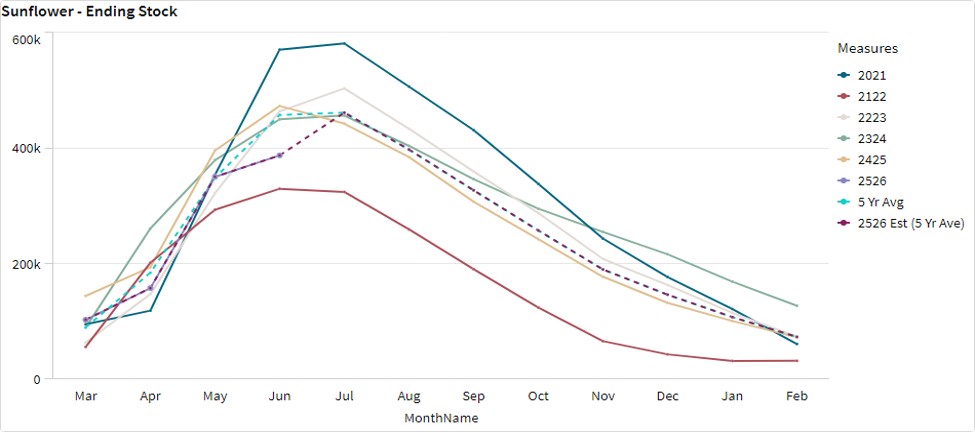
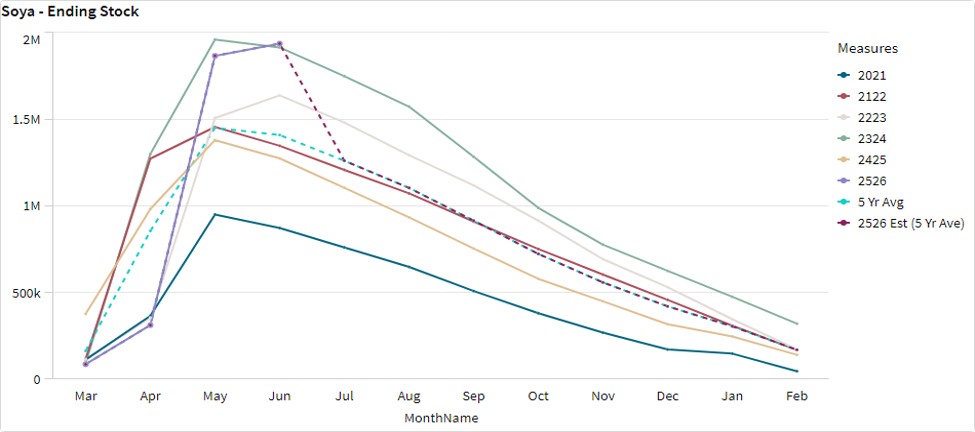
The graphs below show the predicted ending stock for the different commodities according to SAGIS data. A five-year average has been calculated to determine the estimated ending stock for the current season.
The estimated white maize ending stock for April 2026 is 974 712 t. That is 757 603 t more than the final ending stock for the 2024/2025 season. The final yellow maize ending stock for April 2026 is 871 905 t. That is 439 284t more than the final ending stock for the 2024/2025 season.
The predicted five-year average sunflower ending stock for the 2025/2026 season is 452 t more than the previous season ending stock.
The predicted five-year average soybean ending stock for the 2025/2026 season is 28 832 t more than the previous season ending stock.
- Crop estimations
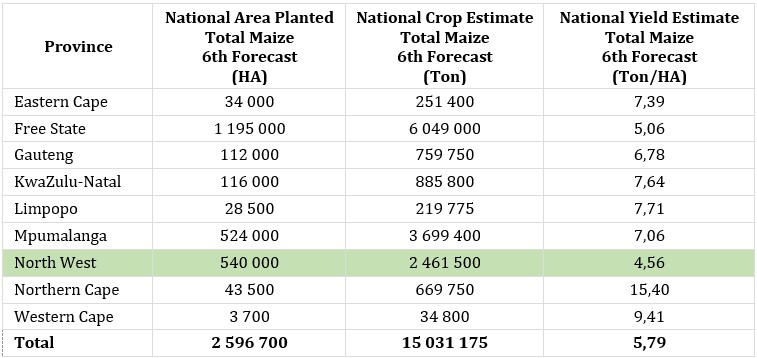
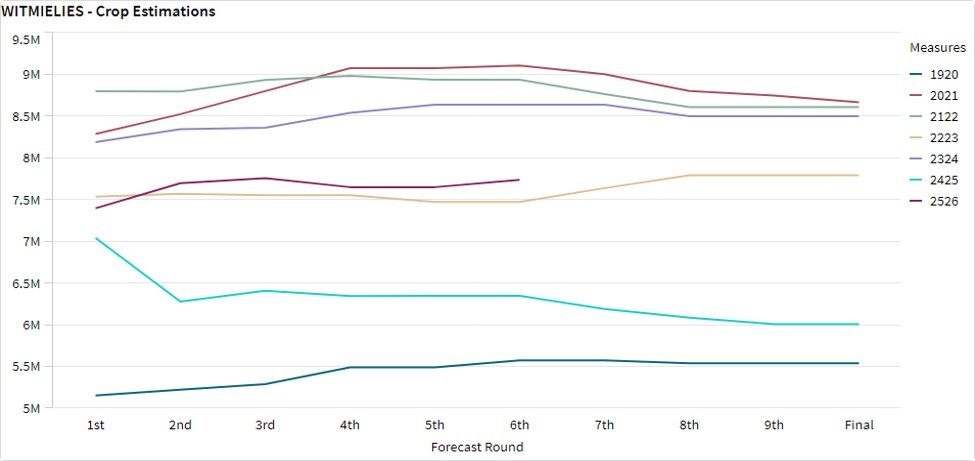
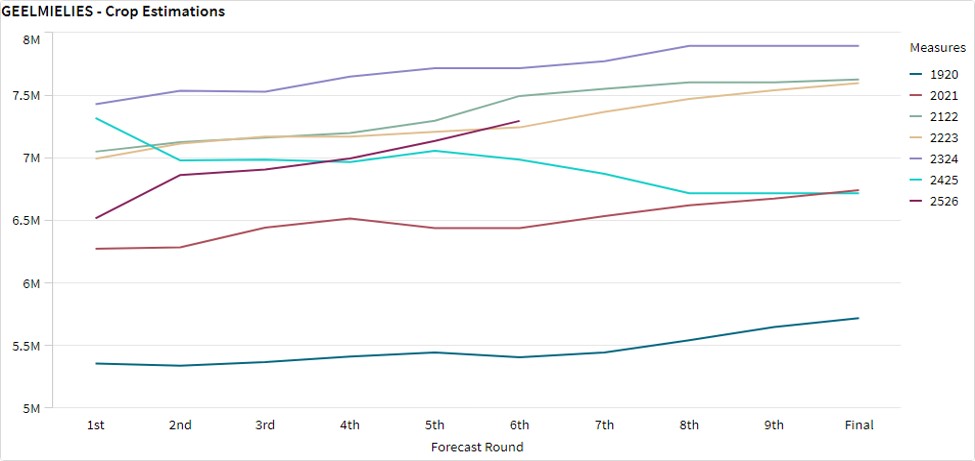
According to the Crop Estimate Committee (CEC) sixth production forecast for 2025, the total area estimate for maize in South Africa is 2,596 million ha, which is 1,5% less than the actual 2,636 million ha planted for the previous season. The total forecasted tons for white and yellow maize are 15 million t from the fourth forecast.
Source: CEC (Crop Estimates Committee)
- Production forecast sunflower
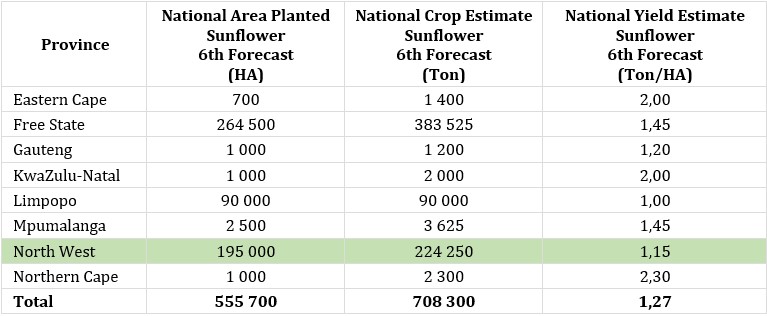
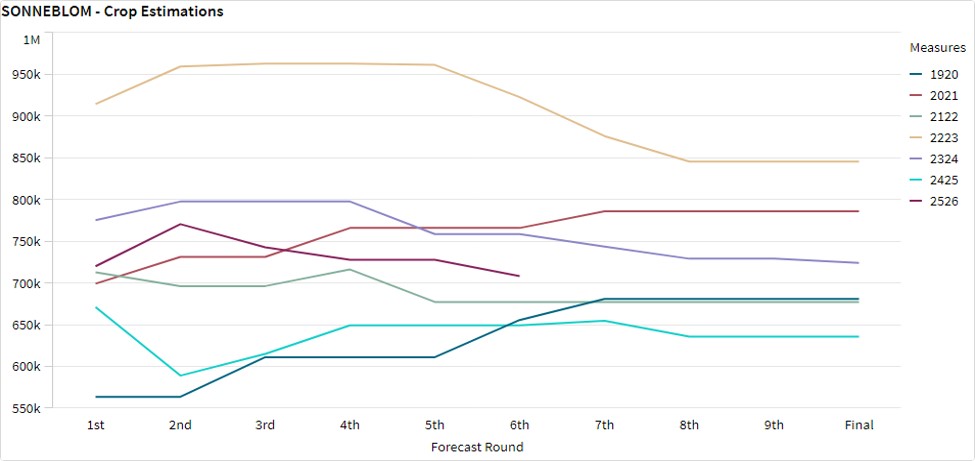
The production forecast for sunflower seed is 708 300 t. The area estimate for sunflower seed is 555 700 ha while the expected yield is 1,27 t/ha.
Source: CEC (Crop Estimates Committee)
- Production forecast soybeans
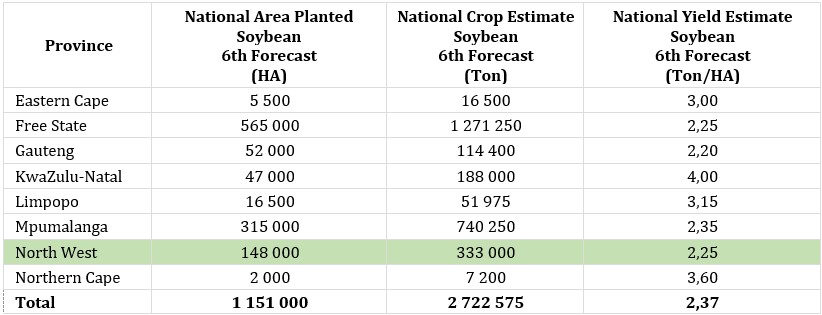
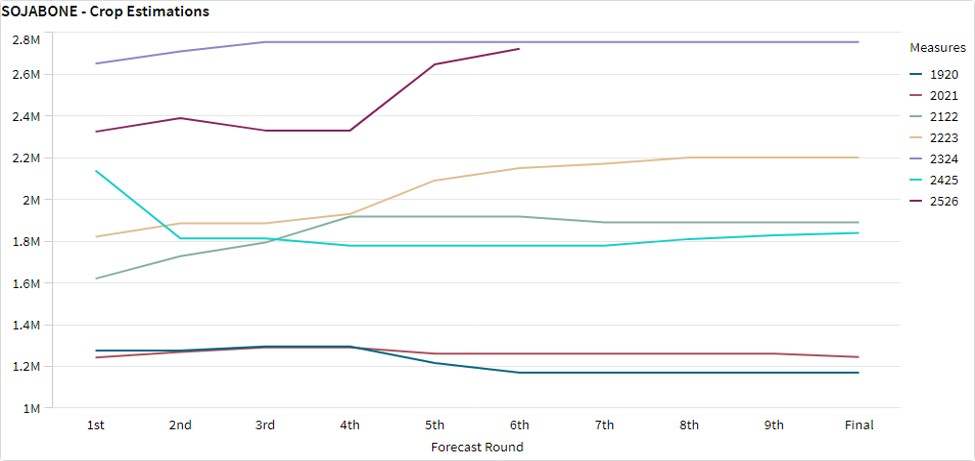
The production forecast for soybeans is 2,722 million tons. The estimated area for soybeans is 1,151 million hectares with an expected yield of 2,37 t/ha.
Source: CEC (Crop Estimates Committee)
- Imports and exports – National
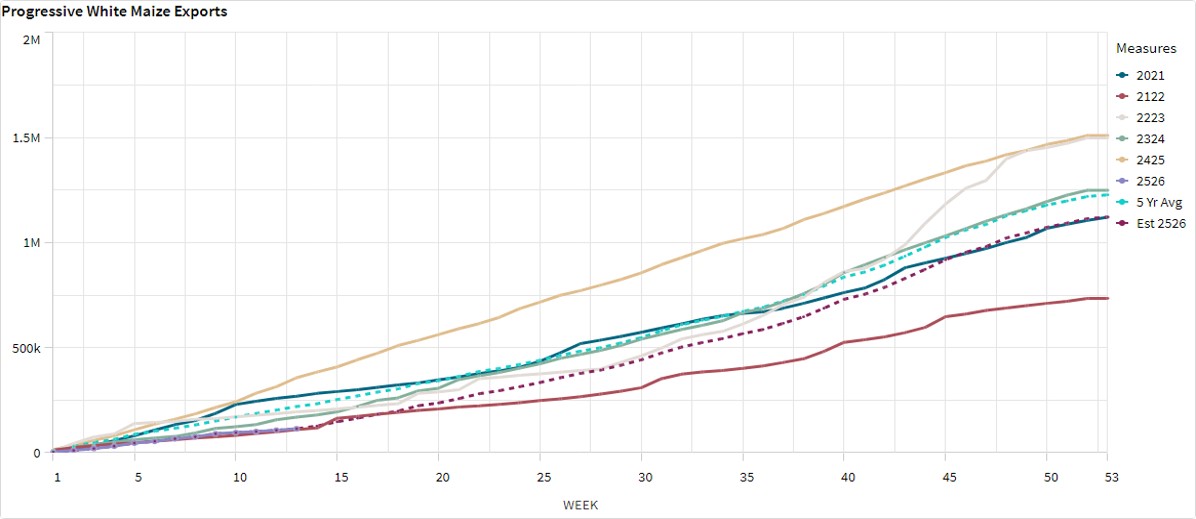
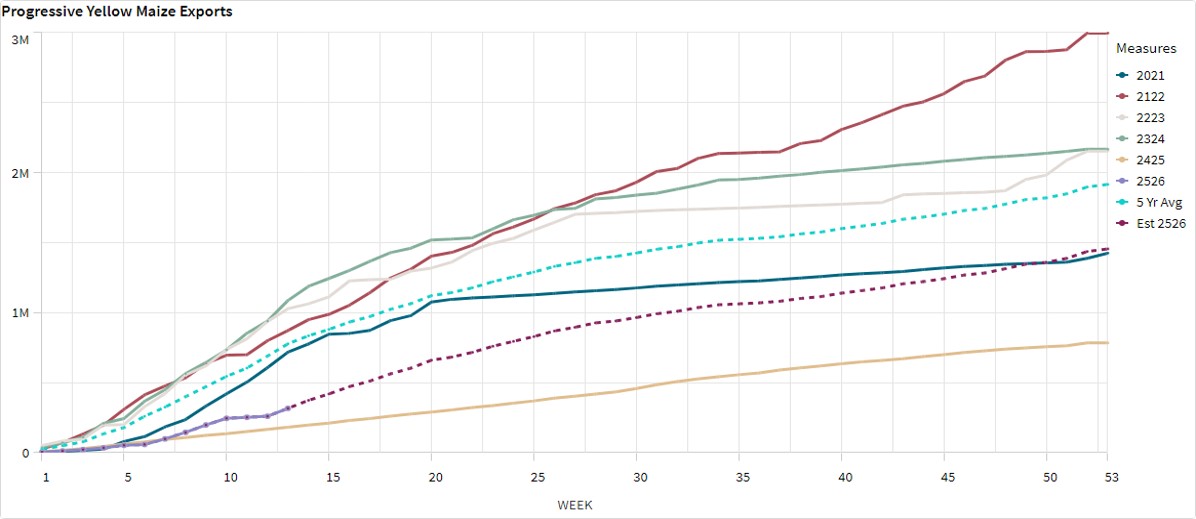
For the production season ending April 2026, 113 930 t of white maize and 316 708 t of yellow maize have been exported so far as seen in the graphs below.
- Parity prices
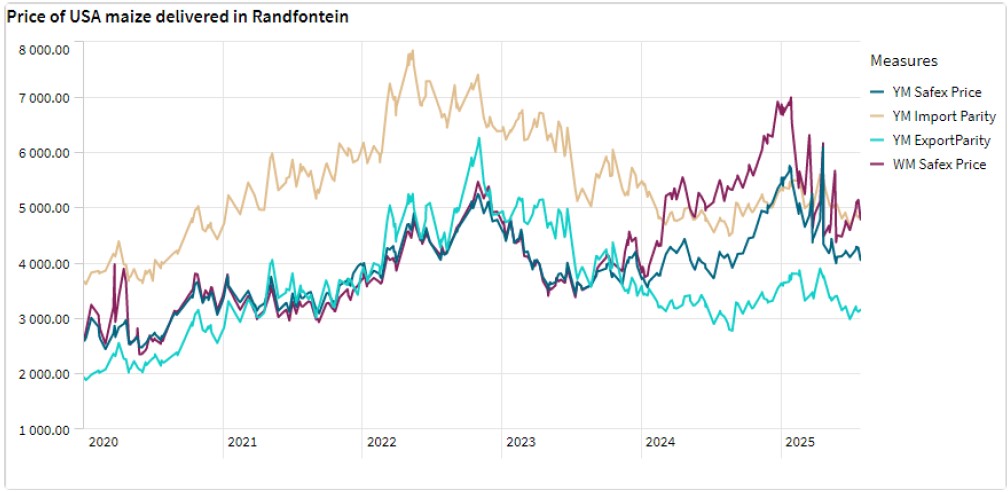
South Africa is a small producer compared to other countries and is thus a price taker (meaning that we cannot influence world prices). Because of this, our local prices are normally between import and export parity, which is illustrated in the figure below. An import parity price is defined as the price which a buyer will pay to buy the product on the world market. This price will include all the costs incurred to get the product delivered to the buyer’s destination.
An export parity price is defined as the price that a local seller could receive by selling his product on the world market e.g., excluding the export costs. The price which the seller obtains is based on the condition that he delivers the product at the nearest export point (usually a harbour) at his own expense.
The graph below reflects the Safex price, import parity and export parity of yellow maize as well as the Safex price of white maize. The import and export parity prices for white maize is not released by Grain SA for this period.
- Grain processing per province
For the marketing year 2024/2025, May 2024 to April 2025, the Free State dominates the white maize that is used for human consumption and gristing. North West consumed the second most white maize produced for human consumption for the marketing year.

Gauteng used the most, white maize for animal feed and industrial usage with the Free Sate using the second most.

Mpumalanga processed the most yellow maize for consumption and gristing and Gauteng processed the most yellow maize for animal feed and industrial purposes.


- Exchange rate
NWK Group is exposed to foreign exchange rate risk in various business areas, such as commodity prices and trade imports, etc.
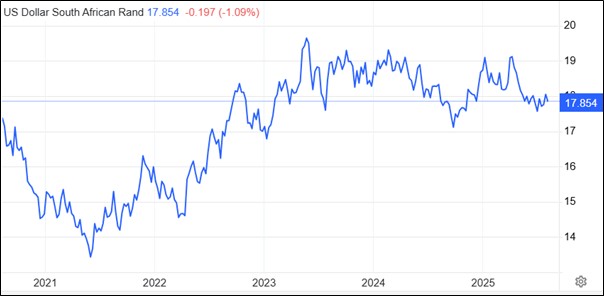
The rand traded at a monthly average of R18,10 against the dollar for the month of July, as the dollar weakened due to a soft US jobs report, leading to the possibility that Federal Reserve might need to lower interest rates later in the year. Over the past month the rand strengthened around 0,02%.
Source: Trading Economics.
- Interest rate
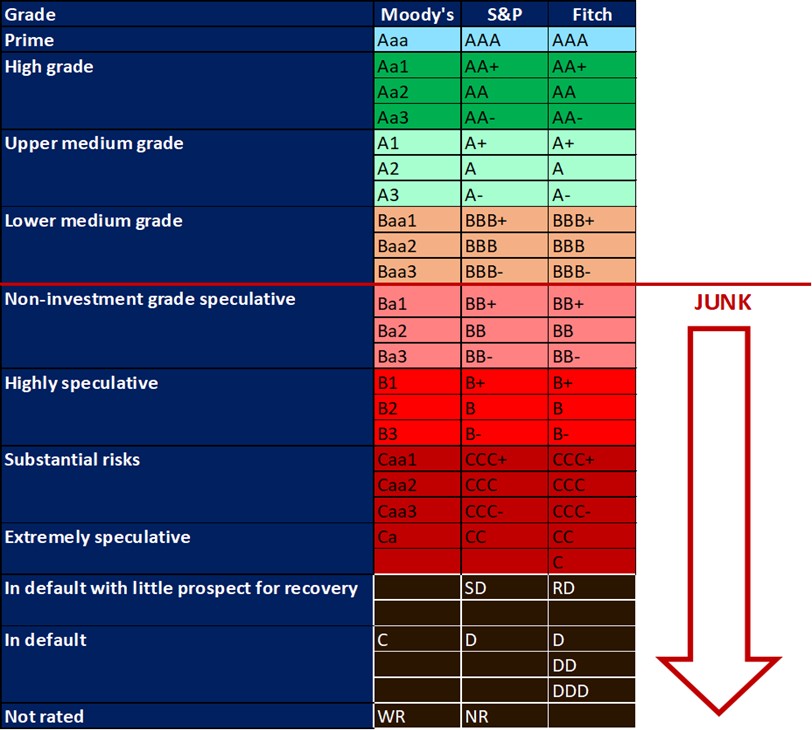
On 27 March 2020, Moody’s downgraded South Africa’s sovereign credit rating to sub-investment grade and placed a negative outlook on the rating. The key drivers for this downgrade include weak economic growth, continuous deterioration in fiscal strength, and slow progress on structural economic reforms. It is now the first time in post-apartheid South Africa that all major rating agencies, i.e., Moody’s, Fitch, and S&P, have South Africa’s credit ratings in sub-investment grade territory. More than a year later and our Moody’s rating remains the same.
During the previous Monetary Policy Committee (MPC) meeting held on 31 July the committee decided that interest rates will decrease with 25-basis points. The repo rate is currently 7% and the prime rate is 10,5%.
Interest rate movement:
27th March 2024 – 11,75%
30th May 2024 – 11,75%
18th July 2024 – 11,75%
19th September 2024 – 11,50%
21st November 2024 – 11,25%
30th January 2025 – 11,00%
20th March 2025 – 11,00%
29th May 2025 – 10,75%
31st July 2025 – 10,50%
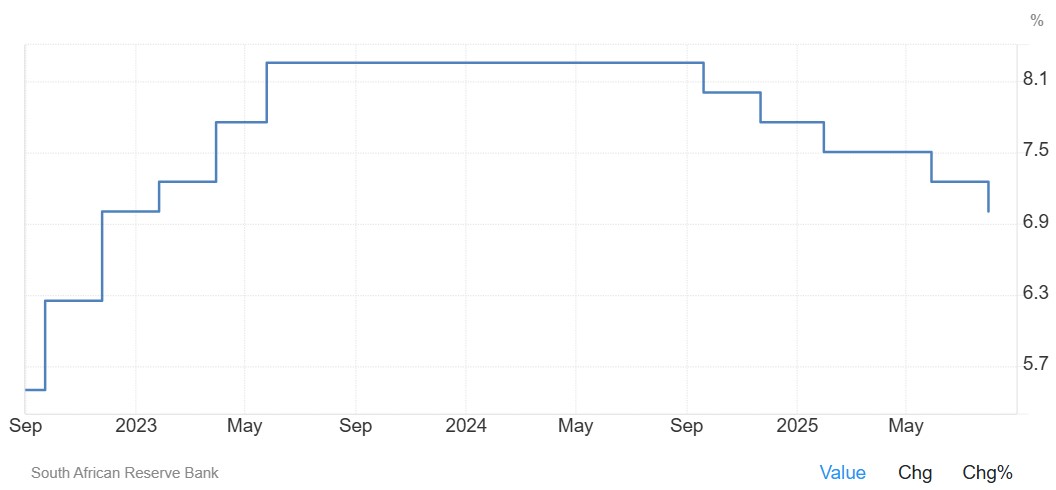
The South African Reserve Bank cut its key interest rate by 25 bps to 7% on 31 July 2025, the lowest level since November 2022. The cut was widely anticipated amid concerns over a new US tariff regime threatening the already fragile economy.
Policymakers emphasized ongoing global uncertainty, noting that many countries have yet to finalize trade agreements before the US tariff deadline. They also observed a stronger rand and more moderate inflation expectations, with June’s CPI showing headline inflation at 3% and core inflation at 2,9%, both near the lower bound of the target range.
Inflation is expected to rise modestly to 3,3% this year before stabilizing at 3% in 2027. Meanwhile, the economy’s outlook remains subdued due to persistent supply-side challenges, particularly in logistics. Consequently, growth forecasts were revised down to 0,9% in 2025 (from 1,1% previously) and 1,3% in 2026 (from 1,5%), but raised to 2% in 2027 (from 1,8%).
Source: South African Reserve Bank: Trading economics
- Inflation rate
As the inflation rate is a driver for increases and decreases in interest rates the current rate and forecast have to be assessed to foresee further increases in the interest rate.
Current: South Africa’s annual inflation rate inched up to 3,5% in July 2025, marking the second consecutive monthly increase and the highest rate in ten months. The key drivers of price growth were food & non-alcoholic beverages (5,7% vs 5,1% in June); alcoholic beverages and tobacco (4,6% vs 4,4%); housing and utilities (4,3% vs 4,4%) and restaurants and hotels (3% vs 2%). Moreover, prices fell much less for transportation (-1,7% vs -3,3%), notably fuels (-5,5% vs -11,2%). The core inflation rate rose to 3% in July 2025.
Source: Statistics South Africa
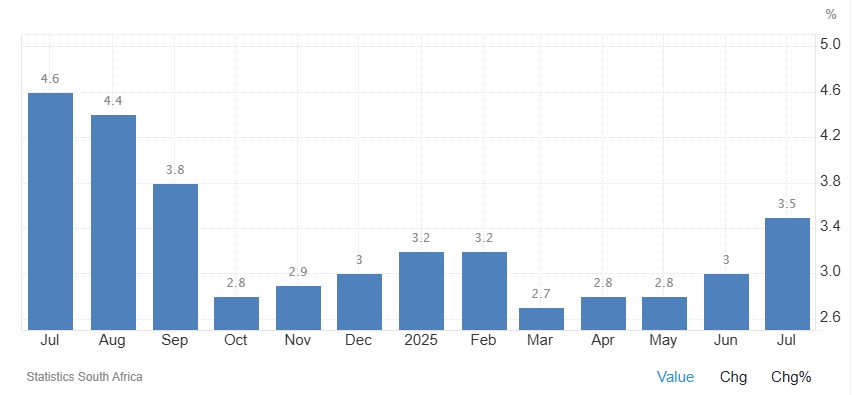
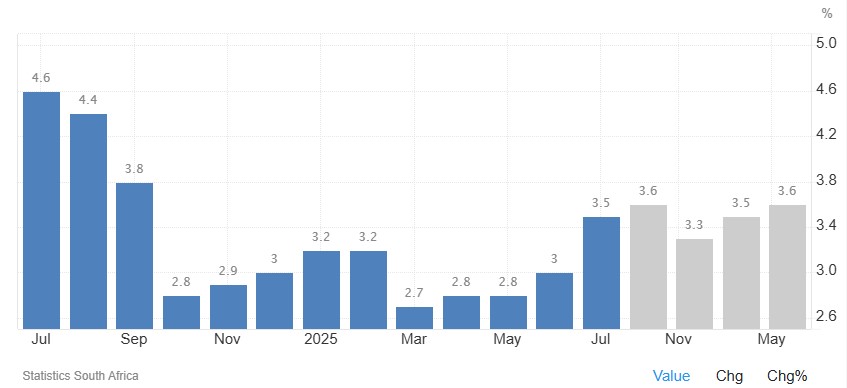
Inflation rate in South Africa remained increased to 3,4% in July. Inflation rate in South Africa is expected to be 3,6% by the end of this quarter, according to Trading Economics global macro models and analysts’ expectations. In the long-term, the South Africa inflation rate is projected to trend around 3,3% in 2026 and 3% in 2027, according to our econometric models.
Source: https://tradingeconomics.com/south-africa/inflation-cpi
- Highlights in the agrochemical sector
Fertiliser product prices increased on a year-on-year basis. Urea (nitrogen) prices surged above $500/t FOB after India accepted bids at $494/t CFR far exceeding expectations. Indian DAP (phosphate) benchmark broke above $800/t CFR with reports of trades at $835/t. Potash prices are steady, but pressure is building as Indonesia tender offers came in above $400/t CFR signalling bullish sentiment.
1. Herbicides
The following products are the main products regarding herbicides that may have an impact on input costs for producers.
Glyphosate (95%)
Acetochlor (92%)
Atrazine (97%)
Metolachlor (97%)
Trifluralin (95%)
The following comparison is from the July 2025 Grain SA report which reports the previous month’s prices.

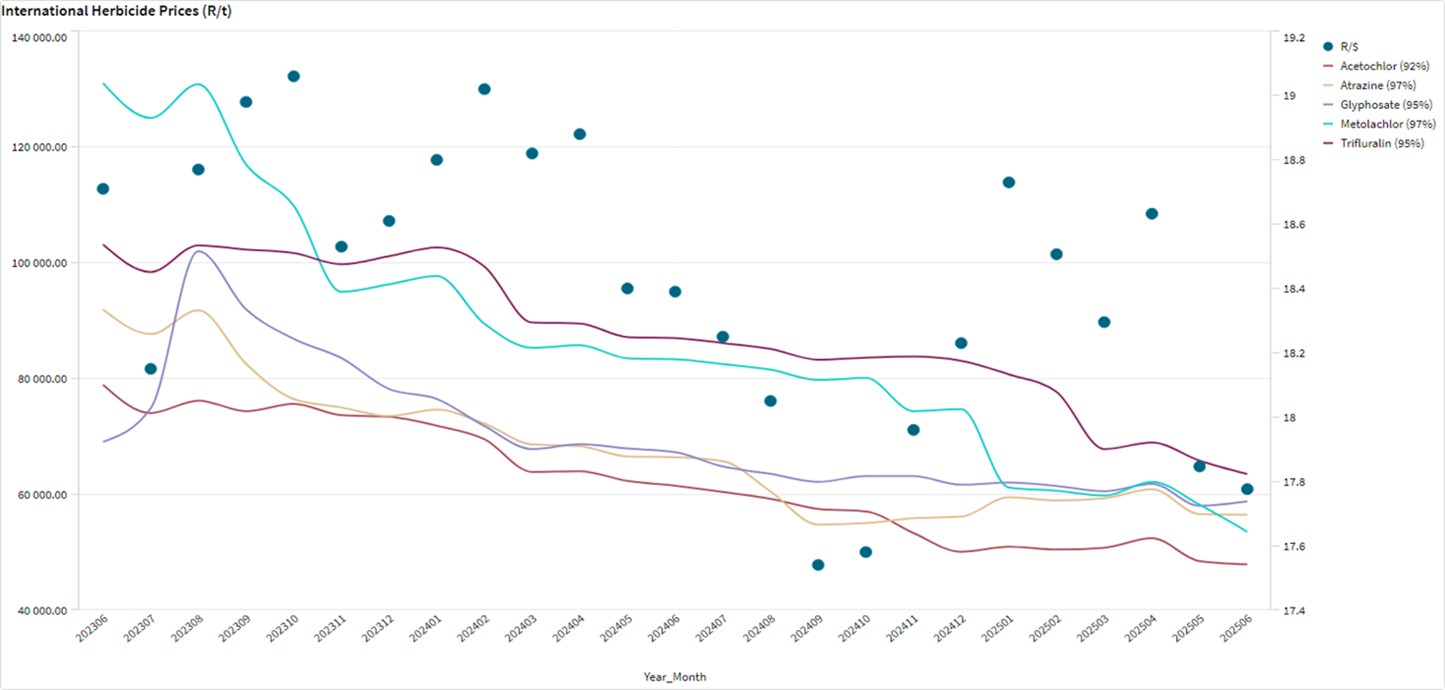
In comparison with the previous year’s prices, all of the products experienced a price decrease. Metolachlor had the biggest decrease with 35,81%.

For the two months compared all of the products experienced a price decrease, except for Glyphosate which experienced an 1,29% increase.

The graph below shows the international herbicides prices (R/t) per product from May 2023 to date.
2. Insecticides
The product Terbufos has been banned from being imported and used in South Africa. The product is also known as Halephirimi.
The following products are the main products regarding insecticides that may have an impact on input costs for producers.
Imidacloprid (95%)
Lambda-cyhalothrin (95%)
Carbofuran (99%)
Deltamethrin (98%)
Acetamiprid (95%)
Chlorpyrifos (95%)
Cypermethrin (94%)
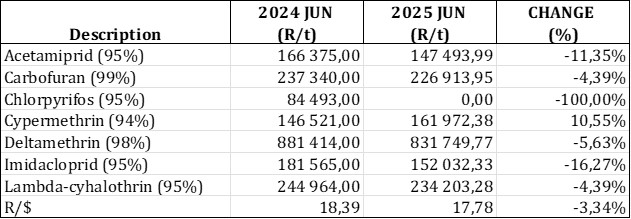
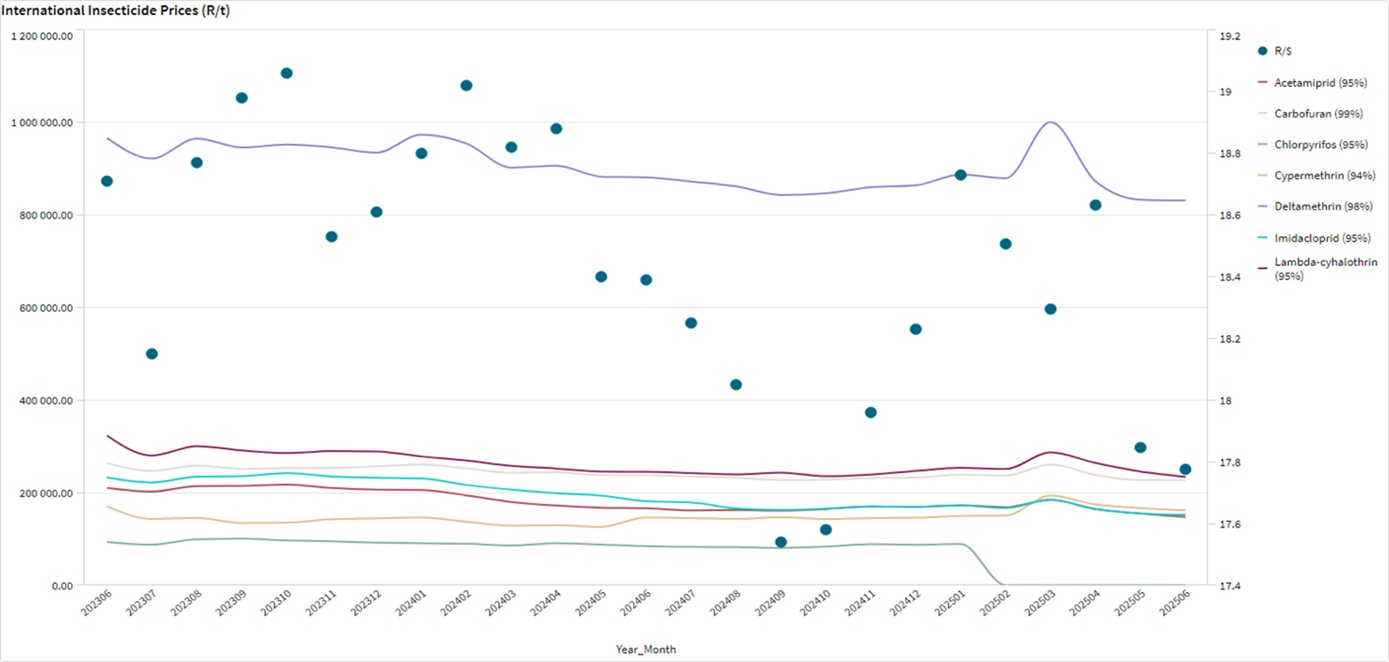
Please note: The price of Chlorpyrifos was not included in the data used to generate the tables and the graph, thus it shows a value of R0.00 for 2025.
In comparison with the previous year’s prices, most of the products experienced a price decrease. Cypermethrin however, experienced a big price increase of 10,55%.
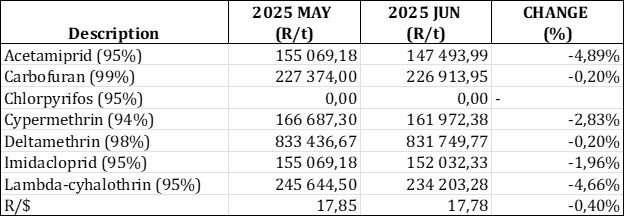
For the two months compared all of the products experienced a price decrease. Acetamiprid experienced the biggest price decreased with 4,89%.

The graph below shows the international insecticide prices (R/t) per product from May 2023 to date.
3. Fertiliser
The following fertiliser products are being analysed:
Ammonia (Middle East)
Urea (46%) (Eastern Europe)
DAP (USA Gulf)
KCL (CIS)

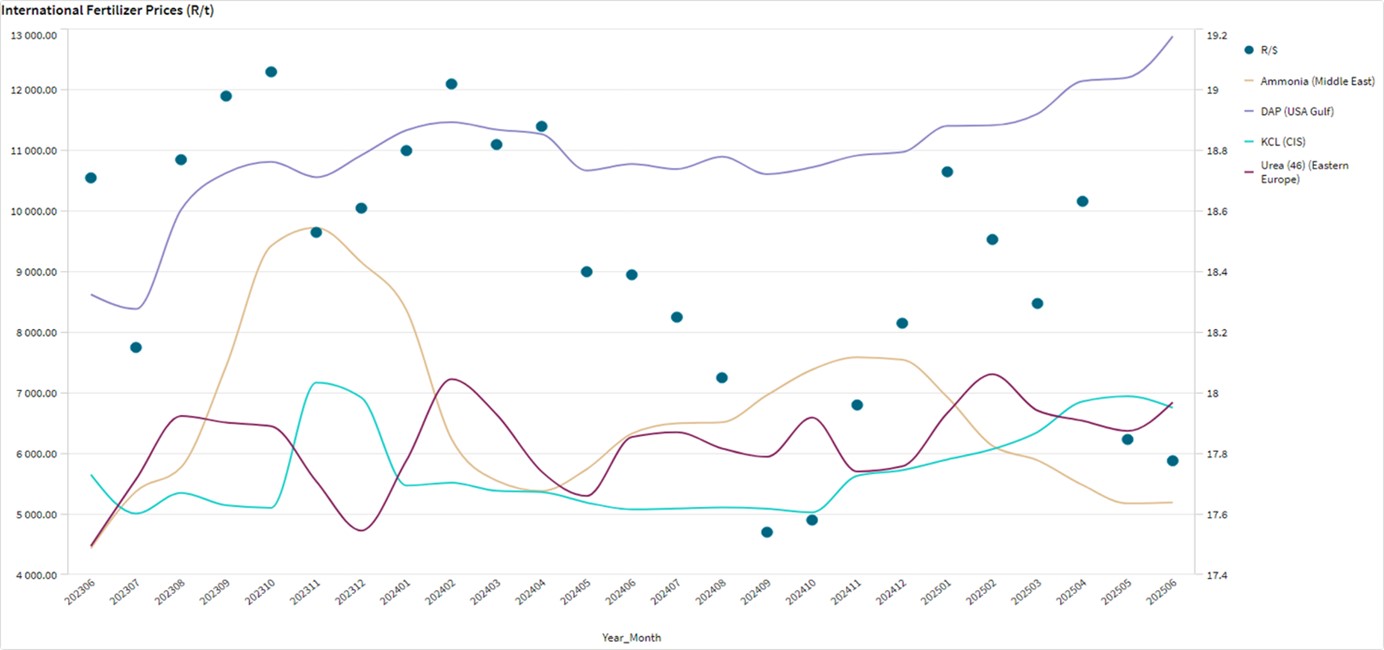
In comparison with the previous year’s prices, three of the products, experienced a price increase. KCL (CIS) experienced the biggest price increase with 33,07%.

In comparison with the previous month’s prices three of the products experienced a price increase with urea (46) increasing the most with 7,42%.

The graph below shows the International Fertiliser prices (R/t) per product from May 2023 to date.
4. Monthly wholesale fuel price
Diesel wholesale prices have increased over time and another increase of 61,20 cents per litre is expected on 6 August. This is mainly due to a surge in international crude oil prices driven by geopolitical tensions in the Middle East, and adjustments to local transport tariffs and the fuel levy. The current wholesale diesel price is R19,3535 per litre.
Source: https://www.grainsa.co.za/upload/report_files/Input-Monitoring-Report-Julie.pdf
Future prices
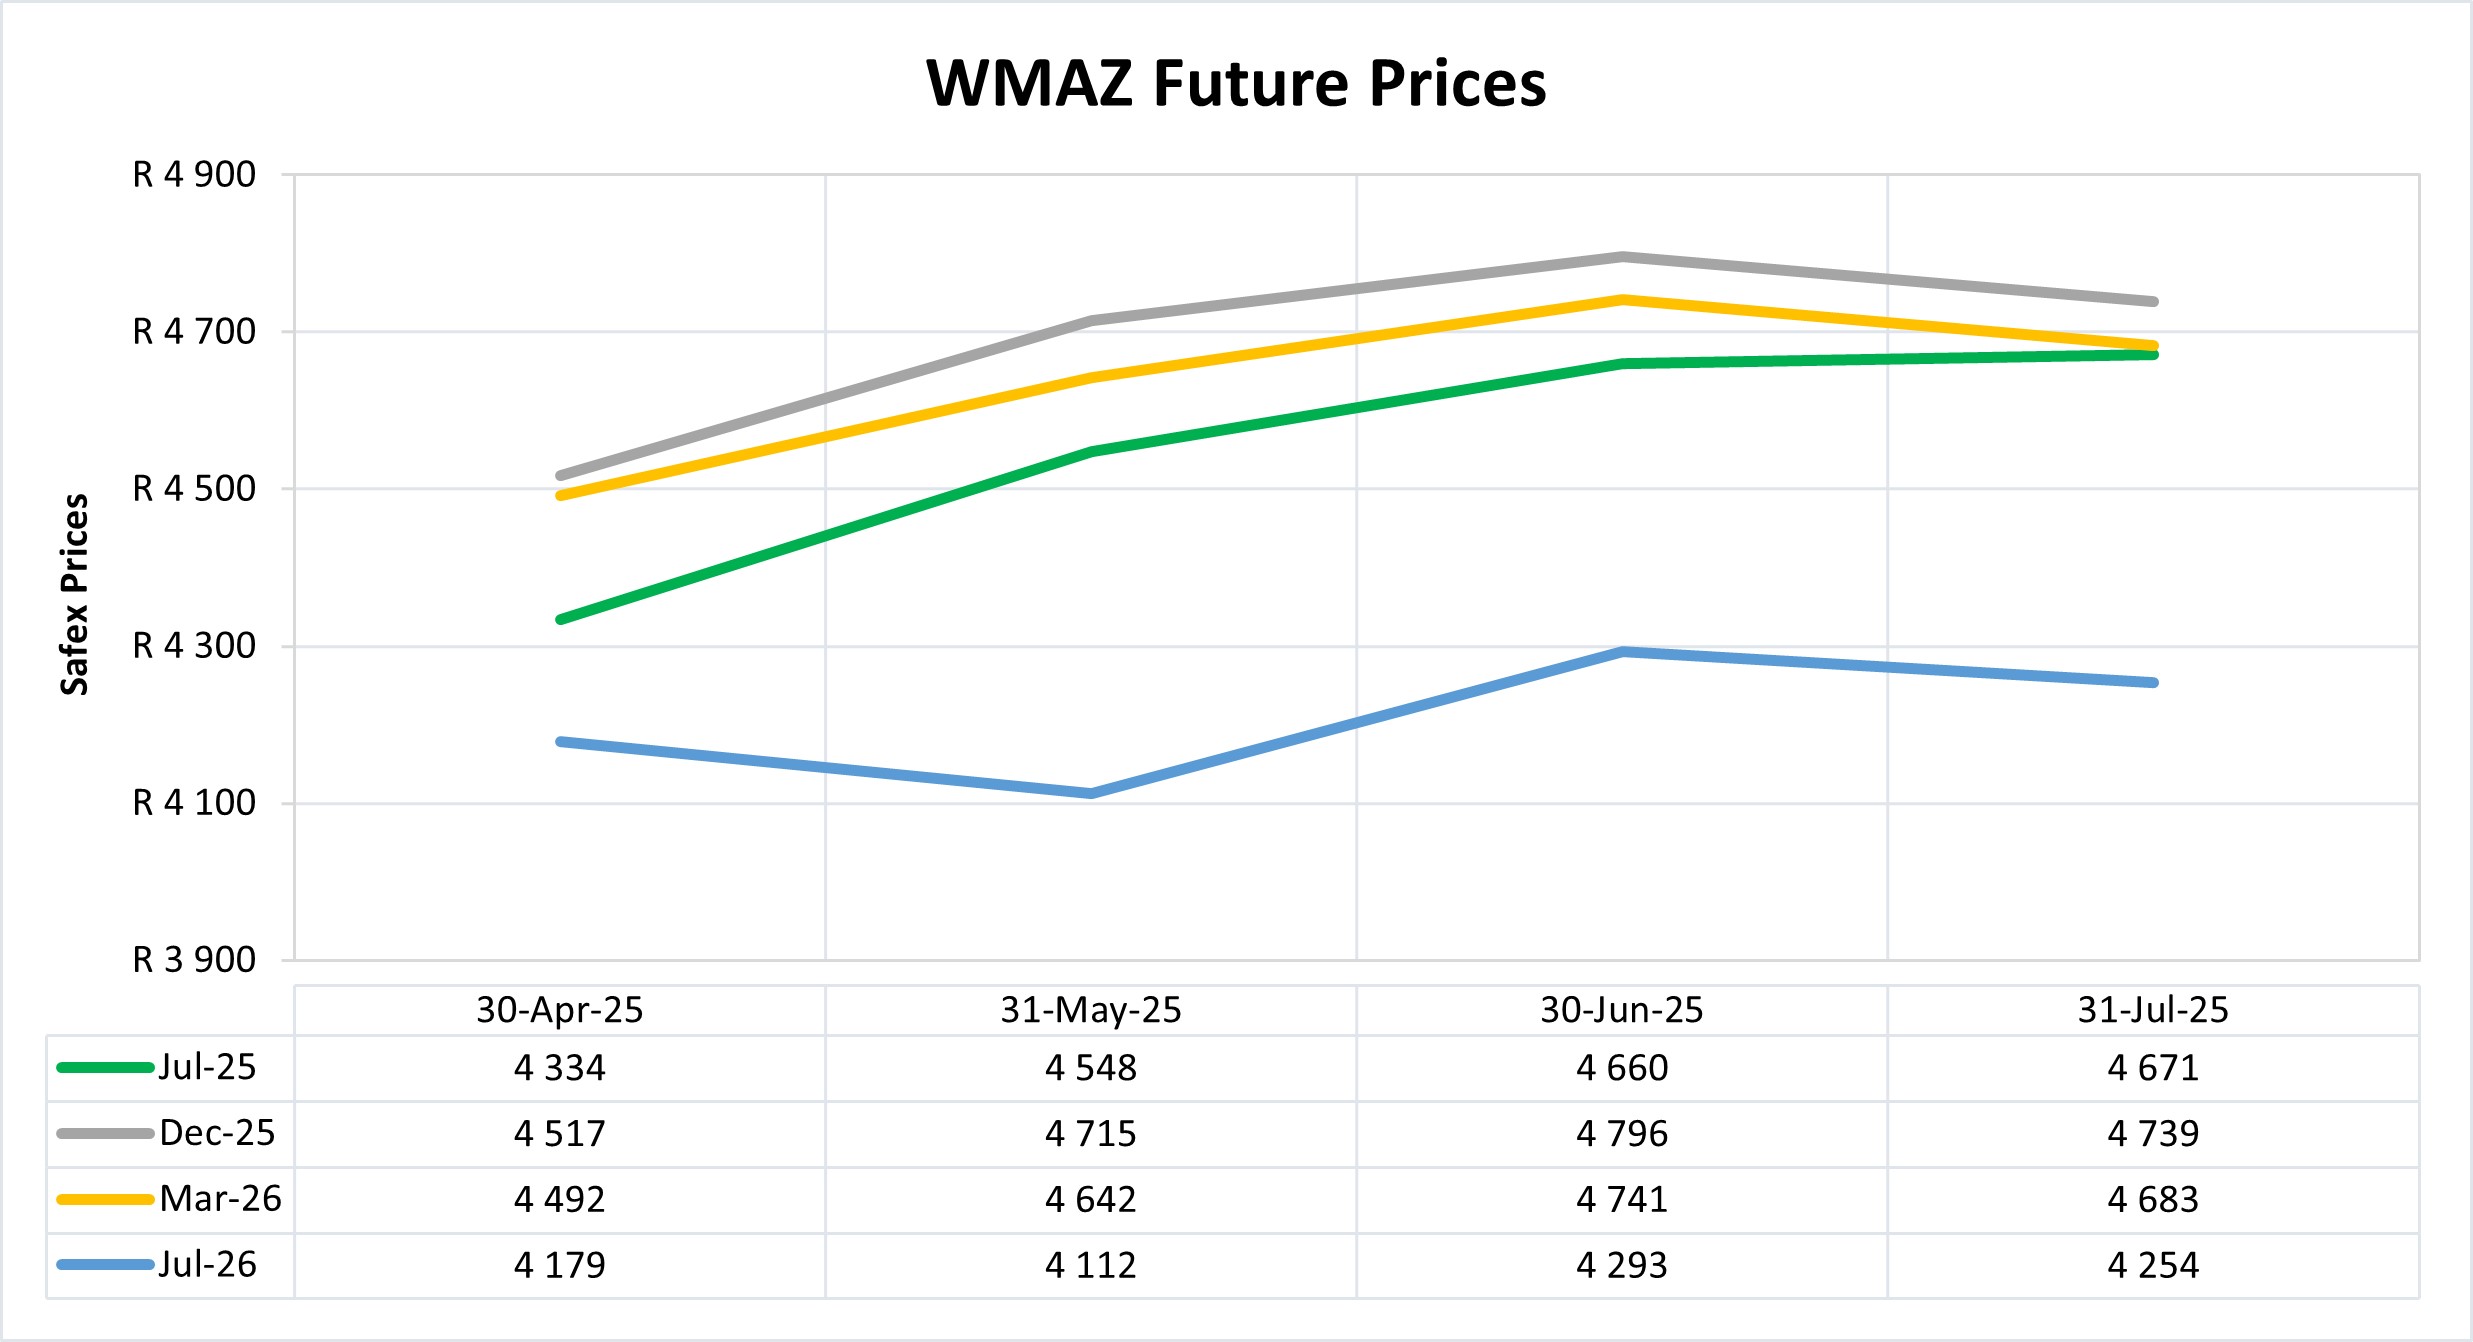
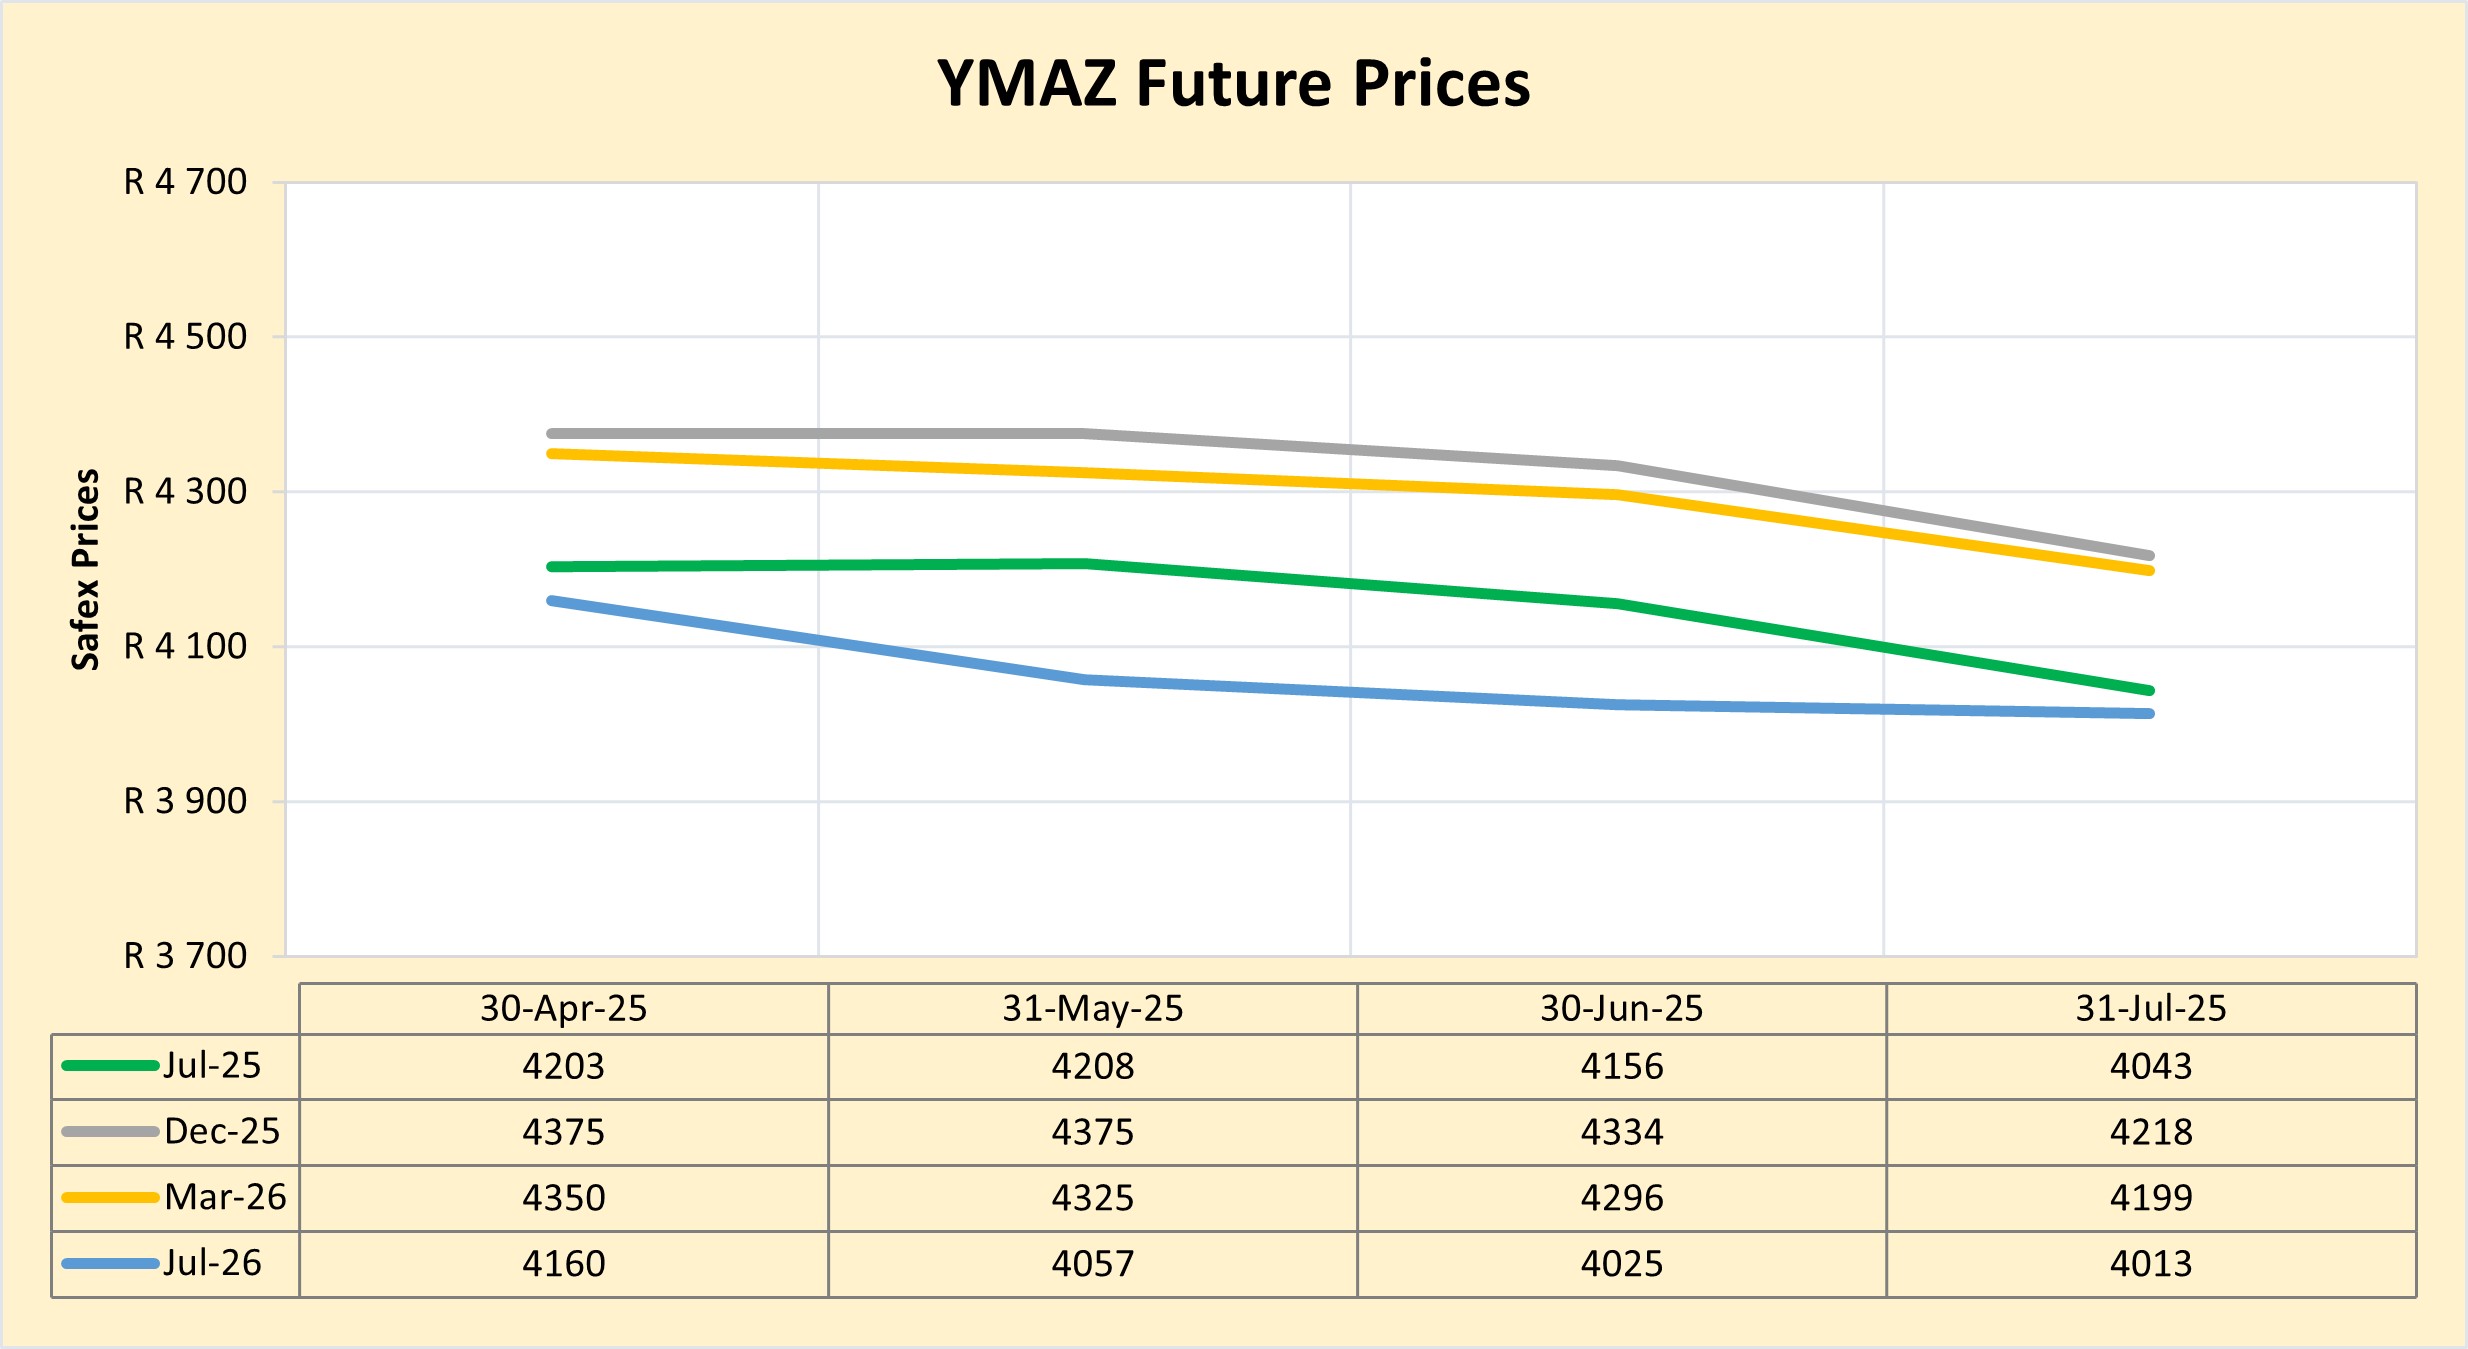
The graphs below illustrate the market sentiment for maize, in the form of future contracts, for the upcoming contract months. The market sentiment is the expectation of supply and demand fundamentals relating to white and yellow maize in South Africa.
DOMESTIC MARKET OVERVIEW
Maize prices decreased in the second quarter of 2025 as production picked up.
- White maize prices are predicted to increase again slightly towards the end of the year due to the carrying cost being discounted in the price and uncertainty regarding the volume of grade one maize that will be harvested.
- Yellow maize is also predicted to increase, but with less than white maize.
Fraud risk
FRAUD AWARENESS
2024 provided us with a few rare glimpses of deepfakes, voice clones and AI-generated phishing scams, some experts claim that these were merely ‘training wheels’ for fraudsters as they tested the waters. Many believe that 2025 will become the year AI scams become a dominant force with regards to draining fintech and bank accounts.
Another scam set to surge this year is AI deepfake extortion scams, these scams are believed to target executives, especially high-profile executives.
What is a deepfake scam?
A deepfake scam happens when a fraudster uses AI-enabled technology to create a video to voice recording – pre-recorded or in real-time conversation – to trick a victim into sending them money or sensitive information. Deepfake technology is a method that cybercriminals can use to execute many types of scams. AI-enabled videos and voice fraud can be part of various types of financial fraud.
Why are deepfakes so convincing?
One of the reasons deepfakes are so terrifying is due to how authentic they appear. AI models can study public photos or recordings of a person (gained from social media or YouTube) and then generate a fake that captures their look or tone uncannily well. As a result, many people overestimate their ability to spot a fake. Deepfakes leverage trust: the victim sees a familiar face or hears a familiar voice, so alarms do not go off. These scams usually rely on urgency and secrecy.
Example: In Singapore, scammers recently orchestrated a deepfake email extortion plot targeting 100 public servants from 30 government agencies, including cabinet ministers. The email demanded they pay $50 000 in cryptocurrency or face the consequences of deepfake videos that showed them in compromising situations. If they didn’t pay, the scammers promised to release the videos and destroy their reputations. The scammers created those convincing fakes using public photos from LinkedIn and YouTube.
How to protect yourself from deepfake scams:
While deepfakes can be very convincing and realistic, they are not always perfect. When you know what to look for, there are telltale signs. In videos, AI videos tend to have glitches and limitations.
- Look out for oddities like hair or eyebrows that seen strange, light reflecting oddly off of glasses, skin that looks too smooth or too smooth. The edges of someone’s face can look blurry or irregular.
- Ask the person to put their hand in front of their face or turn their head around. These movements can look unrealistic in a deepfake.
- Listen for unnatural intonation or odd audio artifacts in voices – a slight robotic timbre or strange pauses could indicate a synthesised voice.
Given the difficulty of visually detecting a sophisticated deepfake, the emphasis shifts to verification. If you receive an unusual request via video call, phone, or even voicemail – especially one involving money, sensitive data, or anything high-stakes – take a step back. Verify the person’s identity through a separate channel. Use the contact information you already have for that person to reach out them to confirm the caller is who they say they are.
Use multi-factor authentication, for any accounts that use facial or voice recognition, use multi-factor authentication, so if scammers have stolen your image, they can’t use it to access your accounts.
Sources
https://www.forbes.com/sites/frankmckenna/2024/12/16/5-ai-scams-set-to-surge-in-2025-what-you-need-to-know/
https://www.forbes.com/sites/alexvakulov/2025/03/09/deepfake-scams-are-stealing-millions-how-to-spot-one/
https://www.synovus.com/personal/resource-center/fraud-prevention-and-security-hub/latest-fraud-trends/how-deepfake-scams-use-familiar-faces-to-scam-victims/


