
The NWK Limited external factors report provides an overview of the main external factors that NWK and its clients are exposed to at a specific point in time. This report opts to aid in a timely basis to foresee external market and other factors that may have an impact on any business and clients. The main focus of this document is to have a closer look at external factors that can affect any business and our customers.
Executive summary
External factors that can affect any business and its customers include various economic factors. This report will focus on monthly or quarterly changes of these economic factors.
The inflation rate inched up to 3,4% in September 2025. Retail trade growth slowed to 2,3% in August 2025. The unemployment rate rose further to 33,2% in the second quarter of 2025. The GDP growth for the second quarter of 2025 grew with 0,8%, improving on a minimal 0,1% growth in Q1. The Policy Uncertainty Index rose to a record high of 81,0 (baseline 50) compared to 75,9 in Q2 2025, it moved further into negative territory.
An external factor that is of great concern to any agricultural business is the weather and climate outlooks. These factors include long term climate risks, such as drought and heat stress, as well as the current status of the El Niño and La Niña climate phenomenon. The El Niño Southern Oscillation (ENSO) is currently ENSO neutral, although there is a 56% probability of La Niña conditions forming during spring.
The National Agricultural Marketing Council (NAMC) projected the ending stock for 30 April 2026 for white and yellow maize to be more than that of the 2024/2025 marketing season. The projected soybean ending stock for February 2026 is 441 529 t – that is more than the final for the 2024/2025 season of 140 704 t. The projected sunflower ending stock for February 2026 is 53 839 t which is less than the final for the 2024/2025 season of 72 789 t.
During the previous Monetary Policy Committee (MPC) meeting held on 18 September the committee decided that interest rates will remain the same. The repo rate is currently 7% and the prime rate 10,5%.
Business climate – key risk drivers
A few highlights regarding certain risk drivers are mentioned below.
According to Trading Economics, South Africa’s annual inflation rate inched up to 3,4% in September 2025. The inflation rate is expected to be 3.6% by the end of this quarter. In the long-term, the South Africa Inflation Rate is projected to trend around 3,6% in 2026 and 3,1% in 2027.
Brent crude oil monthly average prices decreased by $0,44 per barrel. Iron ore increased by $3,36 per metric ton on a monthly average.
South Africa’s retail trade increased to 2,3% compared to a year ago in August 2024, down an upwardly revised 5,7% in the prior month. According to Statistics SA, South Africa’s unemployment rate rose further to 33,2% in Q2 2025.
The GDP growth rate increased by 0,8% in the second quarter of 2025. Eight of the ten industries experienced an increase. The agriculture sector saw a 2.5% rise during the period, thanks to stronger activity in both horticulture and animal products.
The Safex maize prices decreased further in the fourth quarter of 2025 as production picked up. The latest production forecast from the Crop Estimates Committee (CEC) reflected a 2,38% upward revision in maize production compared to the previous estimate, bringing total production to 16 million tons and well above domestic consumption needs.
The El Niño–Southern Oscillation (ENSO) is currently ENSO Neutral. As of mid-September 2025, the equatorial Pacific remains in an ENSO-neutral state, with sea surface temperatures are exhibiting a gradual cooling trend, with a 56% probability of a La Niña conditions developing during spring 2025. The solar cycle is in a downward trend for the current 11-year cycle which means possible less rain for the following season to come. The turning point is predicted to be in 2025.
The Policy Uncertainty Index (PUI) rose to a record high of 81,0 (baseline 50) compared to 75,9 in Q2 2025, moving further into negative territory. A combination of negative global and internal factors outweighed the positive ones in the PUI over this period.
Sources: https://tradingeconomics.com/south-africa/inflation-cpi
https://tradingeconomics.com/commodity/brent-crude-oil
https://tradingeconomics.com/south-africa/unemployment-rate
https://www.statssa.gov.za/?page_id=737&id=1
https://tradingeconomics.com/south-africa/gdp-growth
https://agrink.co.za/downloads/ABSA%20Agri%20Trends%20Grains%20and%20Veggies.pdf
https://tradingeconomics.com/commodity/iron-ore
PUI_2025Q3.pdf
Agribusiness Confidence Index (ACI) Q3, 2025
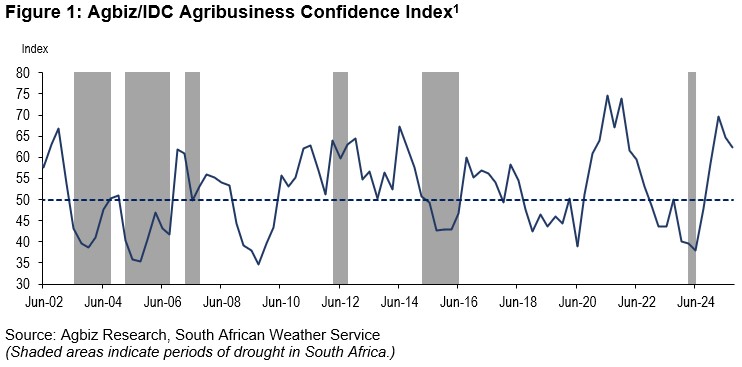
The Agricultural Business Chamber (Agbiz) conducts a quarterly survey to compile the Agribusiness Confidence Index (ACI), reflecting the views of at least 25 decision-makers in the agricultural sector. Released on 1 September 2025, the latest index evaluates ten critical factors impacting agribusiness: turnover, net operating income, market share, employment, capital investment, export volumes, economic growth, general agricultural conditions, debtor provisions for bad debt, and financing costs.
The Agbiz/IDC Agribusiness Confidence Index (ACI) fell for a second consecutive quarter by two points to 63 in Q3 2025. Most respondents highlighted the adverse effects of foot-and-mouth disease and trade frictions with the US as their primary concerns. Moreover, some noted the long-running challenges, such as poor service delivery by municipalities and slow progress in releasing government land to beneficiaries with title deeds to stimulate agricultural expansion, as limiting factors.
Despite the slight decline, the current level of the ACI implies that South African agribusinesses remain optimistic about business conditions in the country. The favourable 2024/2025 summer rains and improvements at the ports, which have enabled exports with minimal interruptions, are among the positives. The winter crop season is also looking positive for the 2025/2026 harvest. This survey was conducted during the last two weeks of August, covering agribusinesses operating in all agricultural subsectors nationwide.
DISCUSSION OF THE SUBINDICES
The ACI comprises ten subindices; five of them declined in Q3 2025, while the rest improved slightly. Here is the detailed view of the subindices:
Positive view
The turnover subindex confidence is up by 20 points to 75 in Q3 2025. We observed a significant improvement, mainly in the summer and winter grain regions, as well as in agribusinesses within the financial services sector. Similarly, the net operating income subindex increased by six points to 71 in the third quarter of 2025.
The general economic conditions subindex improved by 8 points to 58 in Q3 2025.
Negative view
The sub-index measuring export sentiment volume fell by 17 points to 43 in Q3 2025. This reflects the lingering concerns about the global trade environment, particularly with the US. Still, the hard data continue to paint a comforting picture. For example, South Africa’s agricultural exports totalled US$3,71 billion in Q2, up 10% from the same period a year ago.
The market share of the agribusiness subindex fell by 6 points to 59 points in Q3. Most respondents maintained an unchanged view, with improving conditions in crop allowing for improved business conditions.
The employment subindex declined with five points in Q3 2025. This mirrors the general employment conditions in the sector. For example, the number of farm jobs in South Africa declined by 3% to 906 000 in the second quarter. We observed a quarterly decline primarily in the livestock industry, certain field crops, and aquaculture.
The capital investments subindex decreased by 8 points from Q2 to 67. The decline is somewhat surprising as the high-frequency data, such as tractor and combine harvester sales, have remained strong since the start of the year.
The general agricultural conditions subindex fell by 13 points to 67 points in Q3. The decline highlights the challenge posed by animal diseases. Still, the current level remains in favourable territory, indicating the positive effects of the summer rains in the 2024/2025 season and the excellent winter rains for the 2025/2026 crops.
Changes in interpretation
The subindices of the debtor provision for bad debt and financing costs are interpreted differently from the abovementioned indices. A decline is viewed as a favourable development, while an increase signals growing financial strain.
In Q3 2025, the financing costs indices fell by 14 points to 71; reflecting the current environment of easing interest rates.
The debtor provision for bad debt was unchanged from Q2 2025.
Concluding remarks
The ACI results for Q3 2025 indicate that overall sentiment in the sector remains positive, though certain subsectors continue to face notable challenges. ‘These findings suggest that South Africa’s agricultural recovery in 2025 will be uneven, with the livestock subsector under strain, while others are likely to record growth. The prominence of geopolitical issues in respondents’ views underscores the sector’s heavy reliance on export markets and highlights the urgency of diversifying them. Expanding into BRICS countries—particularly China, India, Saudi Arabia, and South Africa – will be crucial. At the same time, we must remain committed to maintaining the strong market access we currently enjoy across the EU, UK, Africa, Asia, the Middle East, and the Americas,’ said Wandile Sihlobo, chief economist at the Agricultural Business Chamber of South Africa (Agbiz).
He added, ‘Equally important are the joint efforts between business and government to strengthen biosecurity measures, improve municipal governance, and release state-owned land to carefully chosen beneficiaries. These steps are vital to ensuring the long-term growth and sustainability of the sector.’
ISSUED BY:
Wandile Sihlobo
Chief Economist, Agricultural Business Chamber of South Africa (Agbiz)
E-mail: wandile@agbiz.co.za
Source: https://agbiz.co.za/content/economic-research?page=agribusiness-confidence
Fact of the month
Nearly all varieties of maize have an even number of rows of kernels on an ear of maize.
- Most varieties of maize bred for modern use have between eight and 20 rows of kernels. This is due to the early development of the ear.
- Ears of maize are developed form pistillate flowers on the ear. Pistillate flowers are the female flowers that bear seeds.
- Long before the ear has kernels, it has several rows of flowers. The flowers develop on the ear in long rows.
- Early in development of the ear, the individual rows of flowers double, forming rows of double flowers.
On average an ear of maize has 800 kernels in 16 rows.

Weather and climate
NATIONAL ASSESSMENT
As of mid-October 2025, the equatorial Pacific remains in an ENSO-neutral state, with sea surface temperatures in the Niño 3.4 region close to average, but exhibiting a gradual cooling trend. The IRI ENSO plume forecast indicates a moderate probability (65%) of La Niña conditions developing during October to December 2025.
These La Niña conditions are expected to persist through the boreal winter of 2025/2026 (53%). However, beginning in January to March, ENSO-neutral conditions are forecasted to return with probabilities of 57%. The chances of El Niño development remain very low – below 10% – through March to May 2026, but increases to 14%, 22%, and 30% during April to June, May to July, and June to August 2026 respectively.
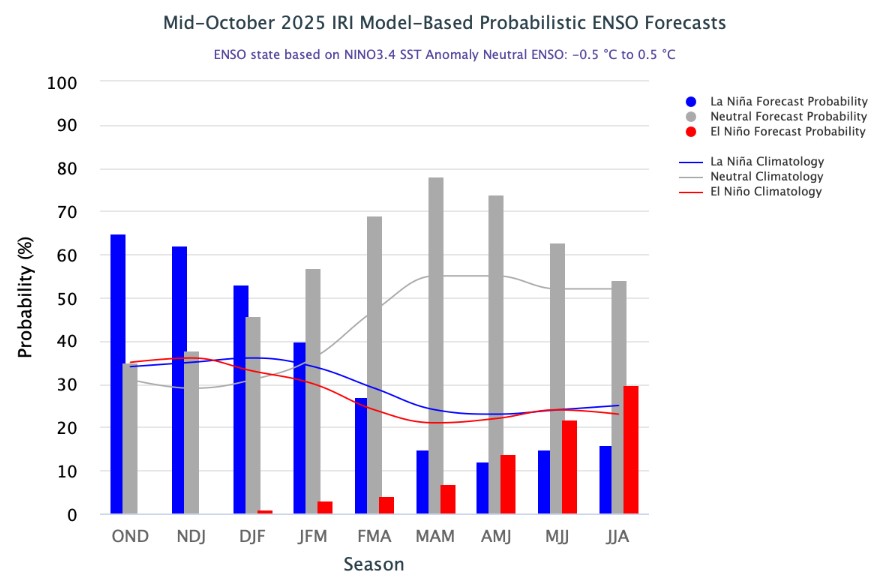
Source: International Research Institute for Climate and Society
(https://iri.columbia.edu/our-expertise/climate/forecasts/enso/current/?enso_tab=enso-iri_plume)
The Bureau of Meteorology’s model suggest SSTs are likely to remain within the ENSO-neutral range (-0.8 °C to +0.8 °C) throughout the forecast period to April 2026.
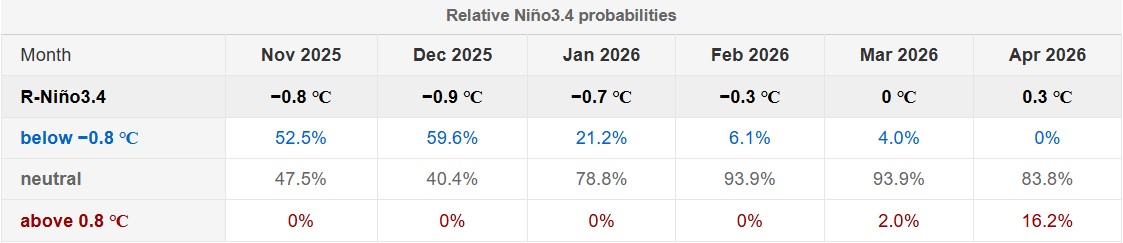
The graph below reflects the current neutral conditions, bordering on a possible La Niña. While there are signs of possible La Niña development in the ocean and atmosphere, they are not strong enough, and/or have not yet been sustained for long enough, to meet Bureau criteria for an active event. The graph supports the prediction of an ENSO-neutral state throughout the forecast period to April 2026.
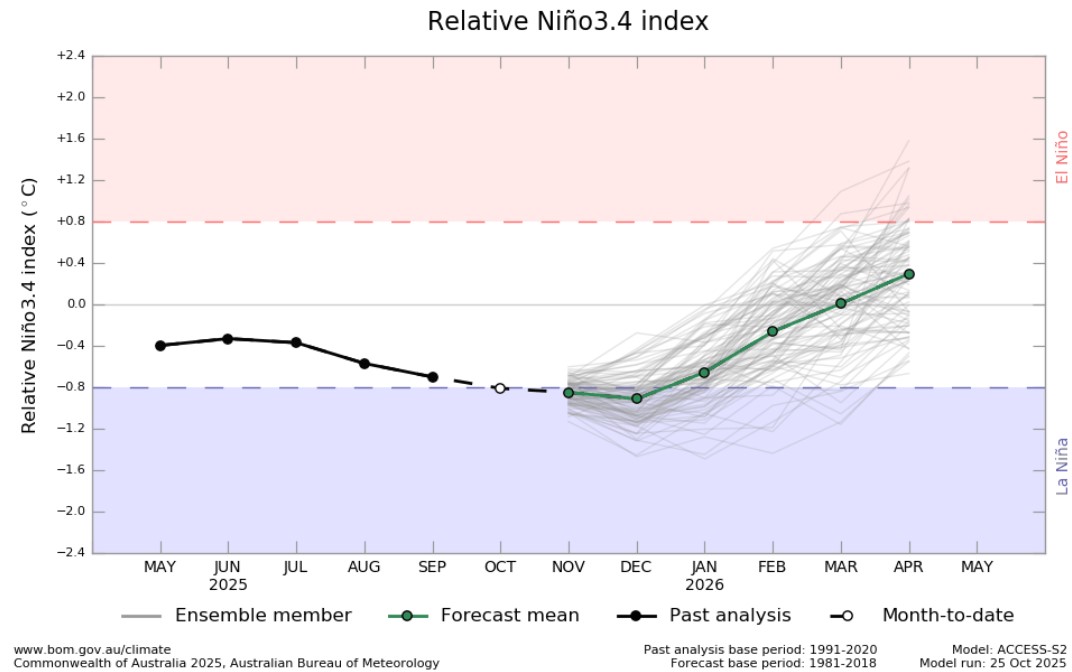
http://www.bom.gov.au/climate/ocean/outlooks/?index=nino34
The latest Climate Watch issued by the SA Weather Service (30 September 2025) states that above-normal rainfall is expected in general for most parts of the country during the late spring and summer months. This above-normal rainfall forecast for the summer rainfall regions will likely have a positive impact on crop and livestock production.
However, the forecast indicates that parts of Mpumalanga and Limpopo will receive below-normal rainfall during this period. Therefore, the relevant decision-makers are encouraged to advise farmers to implement soil and water conservation measures, proper water harvesting and storage techniques, establish proper drainage systems, and other appropriate farming practices.
Source: https://www.weathersa.co.za/Documents/SeasonalForecast/SCOLF202509_30092025121407.pdf
SUNSPOTS
Sunspots are darker, cooler areas on the sun’s surface that arise due to disturbances in the sun’s magnetic field. Sunspots vary in numbers throughout the 11-year solar cycle.
According to a study published on Science Direct the rainfall rate can be directly related to the sunspot number, but shows different characteristics during solar maximum (the peak of the sun’s 11-year solar cycle) years. Though a lag correlation exists between sunspot number and rainfall, sunspots have an increasing effect on rainfall. Studies show that the more sunspots are present the higher the rainfall and the less sunspots the lower the rainfall.
ENSO (El Niño Southern Oscillation) occurs at irregular intervals between three and seven years causing global climate system variation. Considering this event occurs periodically, it might be triggered by the 11-year solar cycle as an energy source.
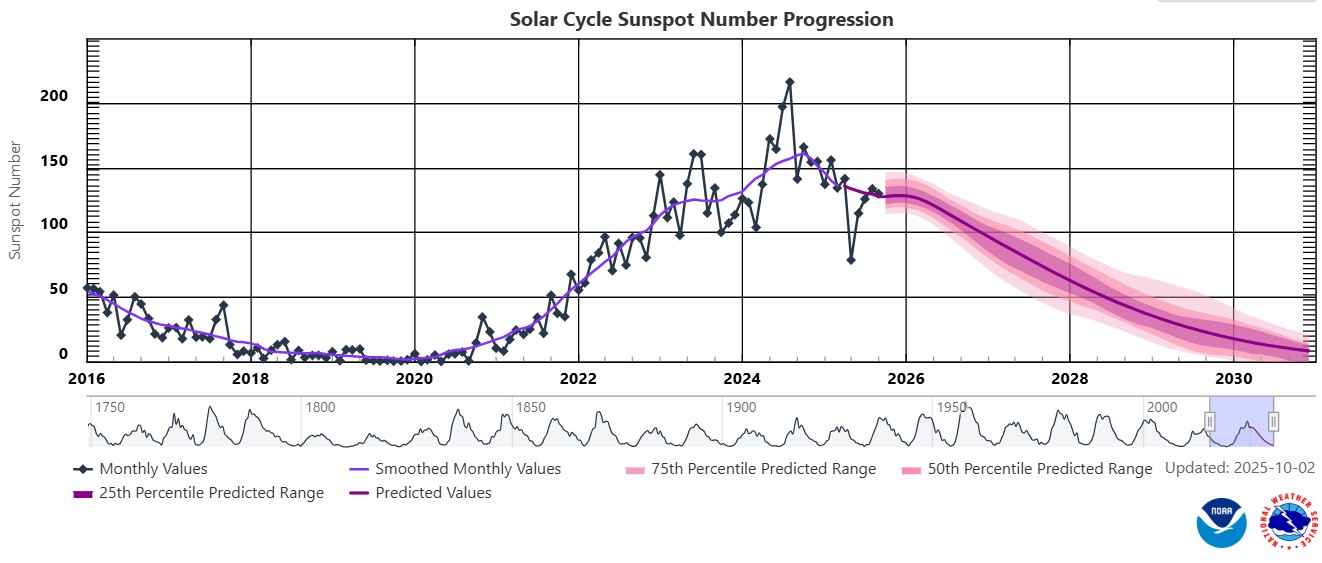
The graph below shows the latest 11-year solar cycle. An upward trajectory suggests that higher rainfall can be expected, characteristic of a La Niña. A downward trajectory suggests that lower rainfall can be expected, characteristic of an El Niña.
Since October 2020 to February 2025 the actual sunspot numbers were higher than the predicted values. September 2025 falls inside of the predicted range, with a monthly mean sunspot value of 129,8.
Sources:
https://www.spaceweatherlive.com/en/solar-activity/solar-cycle.html https://www.sciencedirect.com/science/article/abs/pii/S136468262200116X#:~:text=It%20was%20observed%20that%20rainfall,an%20increasing%20effect%20on%20rainfall
https://www.space.com/solar-cycle-frequency-prediction-facts
https://eos.org/articles/why-did-sunspots-disappear-for-70-years-nearby-star-holds-clues https://aip.scitation.org/doi/abs/10.1063/1.4930679?journalCode=apc#:~:text=ENSO%20occurs%20at%20irregular%20interval,cycle%20as%20an%20energy%20source
Market risk
GRAIN MARKET ANALYSIS
- Ending stock – National
Ending stock data is gathered from the NAMC. The estimates are reassessed and reported by the Grain & Oilseeds supply & demand estimates committee. The following is the projected ending stock for April 2026 in tonnages for the 2025/2026 season:
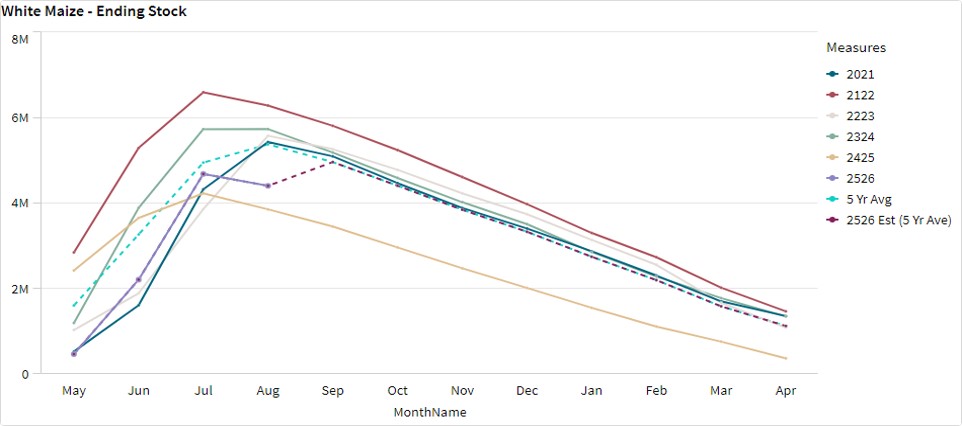
- White maize => 1 486 662 t
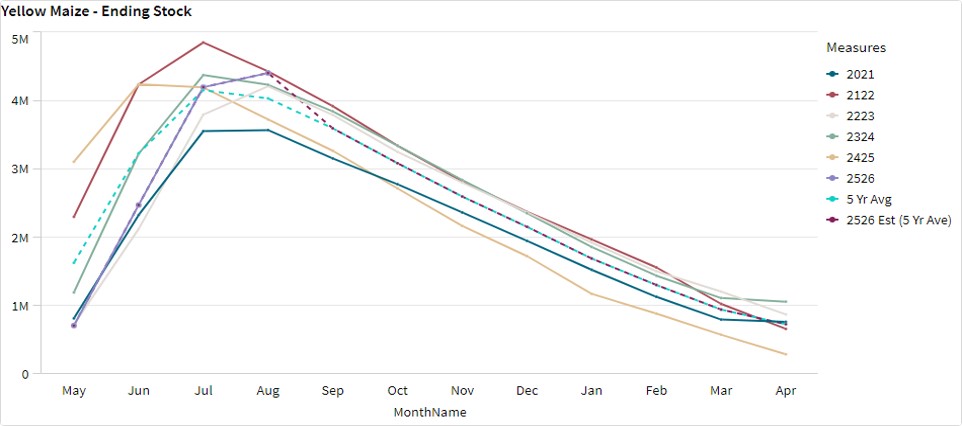
- Yellow maize => 1 036 480 t
The following is a summary of September 2025 ending stock projections for the 2024/2025 season:
- Wheat => 658 984 t
The following is a summary of February 2026 projected ending stock for the 2025/2026 season:
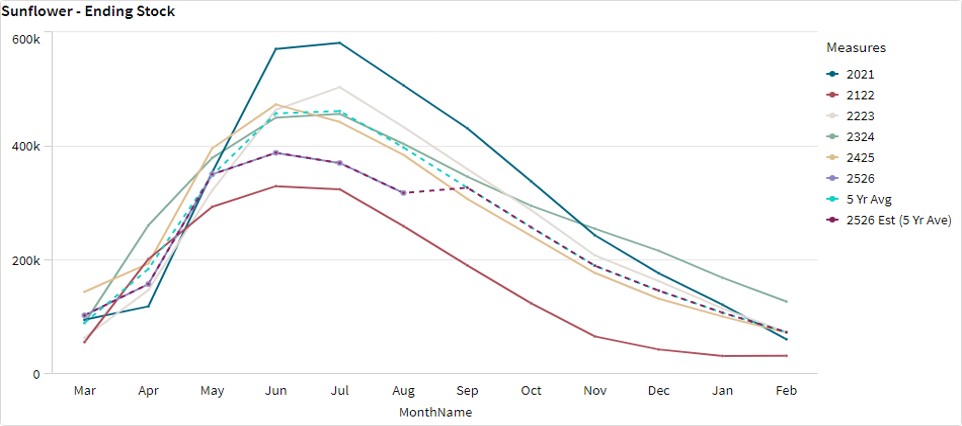
- Sunflower => 53 839 t
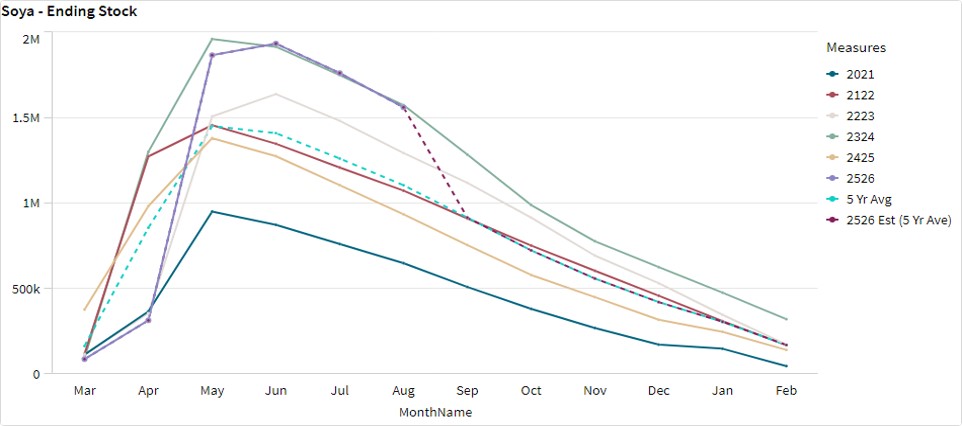
- Soybeans => 441 529 t
- Sorghum => 80 292 t
The graphs below show the predicted ending stock for the different commodities according to SAGIS data. A five-year average has been calculated to determine the estimated ending stock for the current season.
The estimated white maize ending stock for April 2026 is 974 712 t. That is 757 603 t more than the final ending stock for the 2024/2025 season. The final yellow maize ending stock for April 2026 is 871 905 t. That is 439 284 t more than the final ending stock for the 2024/2025 season.
The predicted five-year average sunflower ending stock for the 2025/2026 season is 452 t more than the previous season ending stock.
The predicted five-year average soybean ending stock for the 2025/2026 season is 28 832 t more than the previous season ending stock.
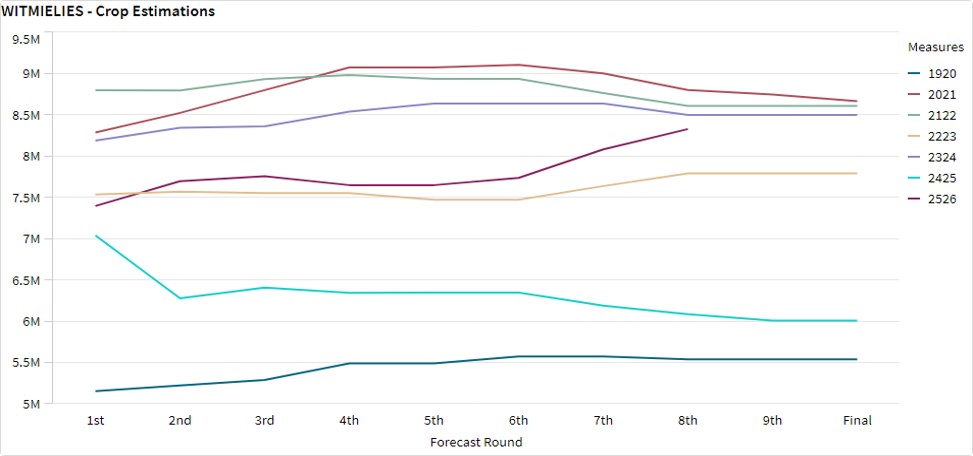
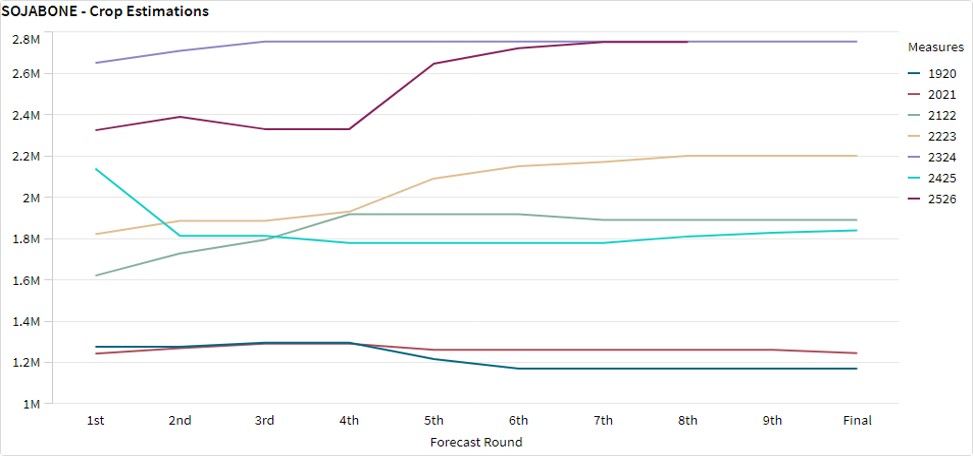
- Crop estimations
According to the Crop Estimate Committee (CEC) eighth production forecast for 2025, the total area estimate for maize in South Africa is 2,596 million ha, which is 1,5% less than the actual 2,636 million ha planted for the previous season. The total forecasted tons for white and yellow maize are 16 million t from the eighth forecast.
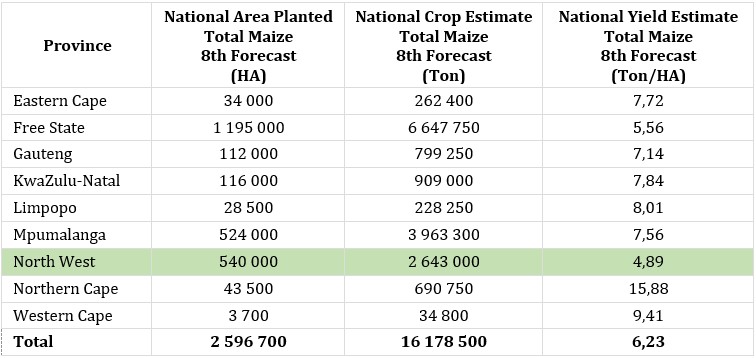
Source: CEC (Crop Estimates Committee)
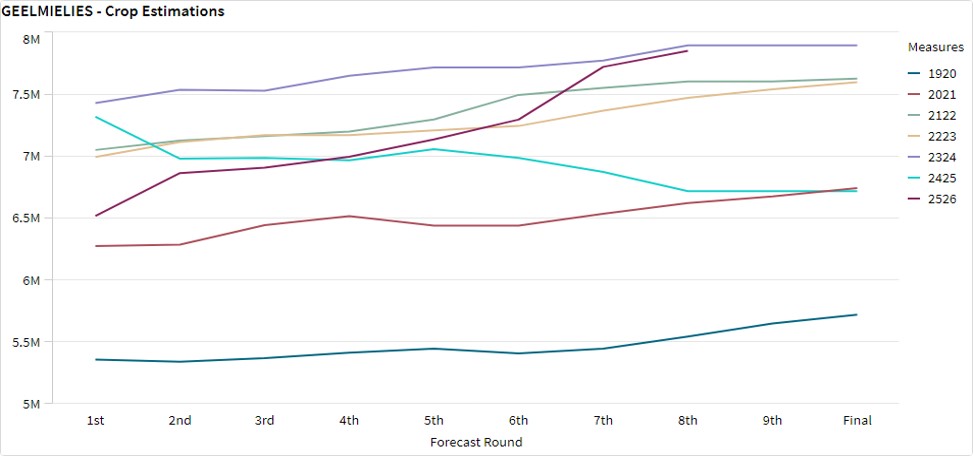
- Production forecast sunflower
The production forecast for sunflower seed is 708 300 t. The area estimate for sunflower seed is 555 700 ha while the expected yield is 1,27 t/ha.
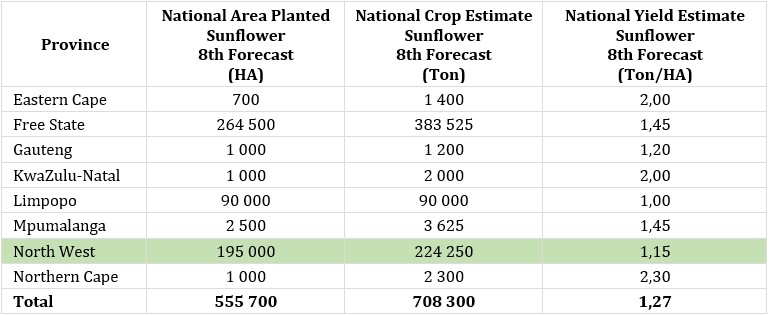
Source: CEC (Crop Estimates Committee)
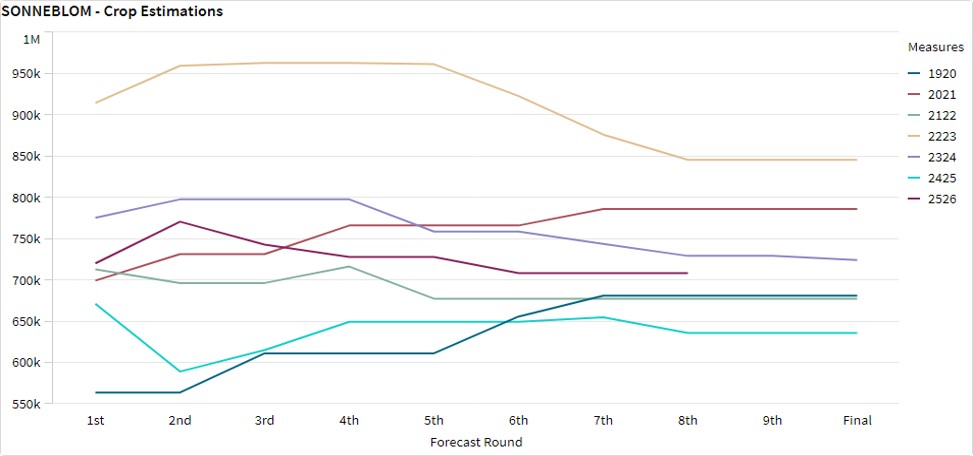
- Production forecast soybeans
The production forecast for soybeans is 2,753 million tons. The estimated area for soybeans is 1,151 million hectares with an expected yield of 2,39 t/ha.
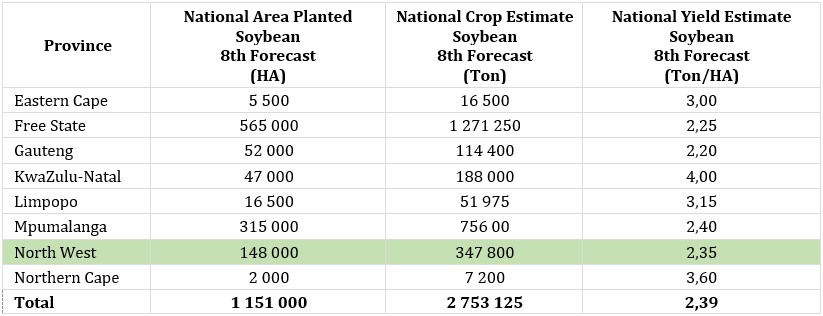
Source: CEC (Crop Estimates Committee)
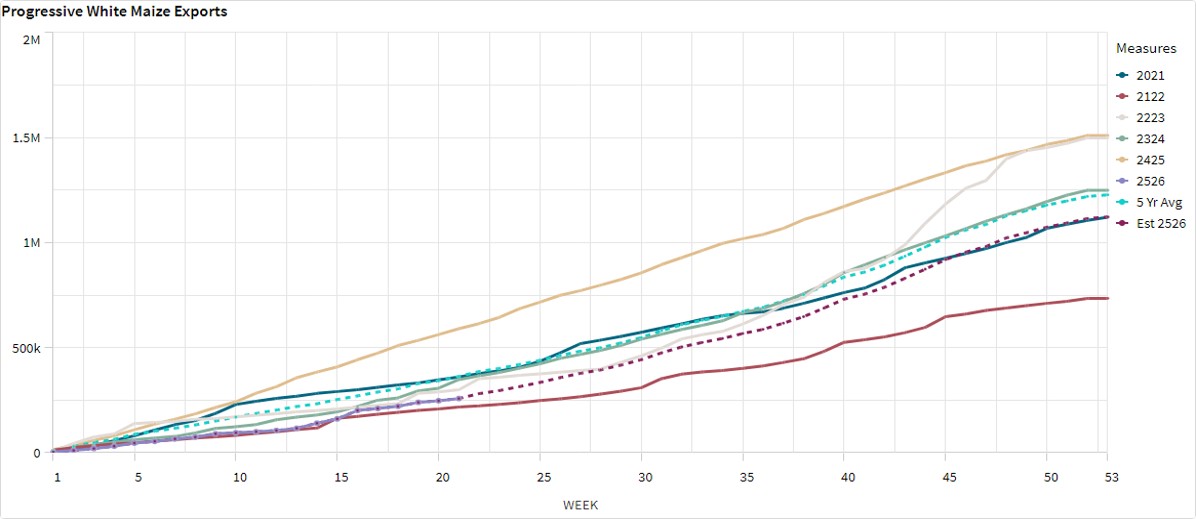
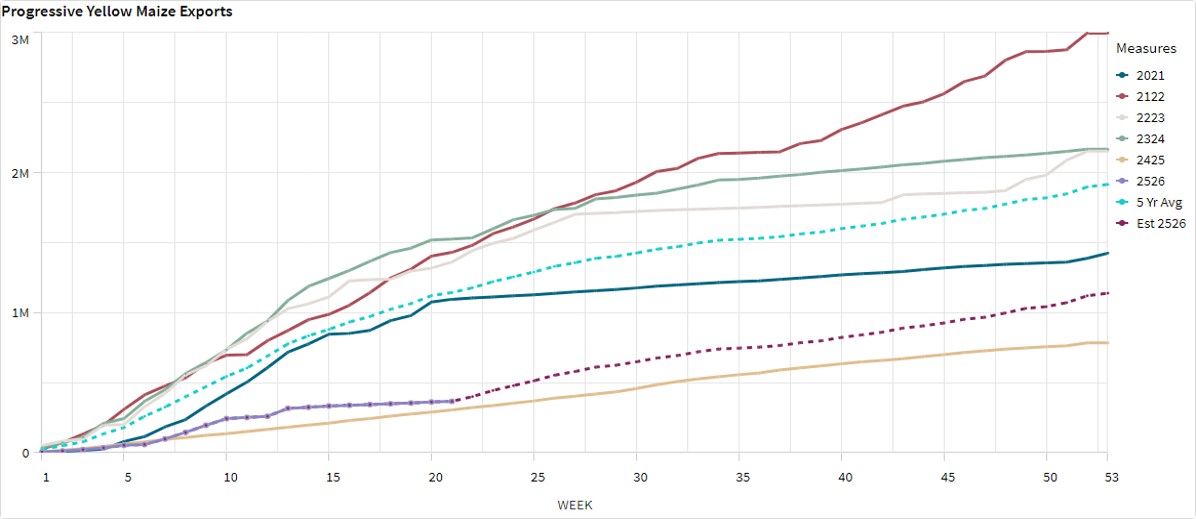
- Imports and exports – National
For the production season ending April 2026, 257 918 t of white maize and 366 655 t of yellow maize have been exported so far as seen in the graphs below.
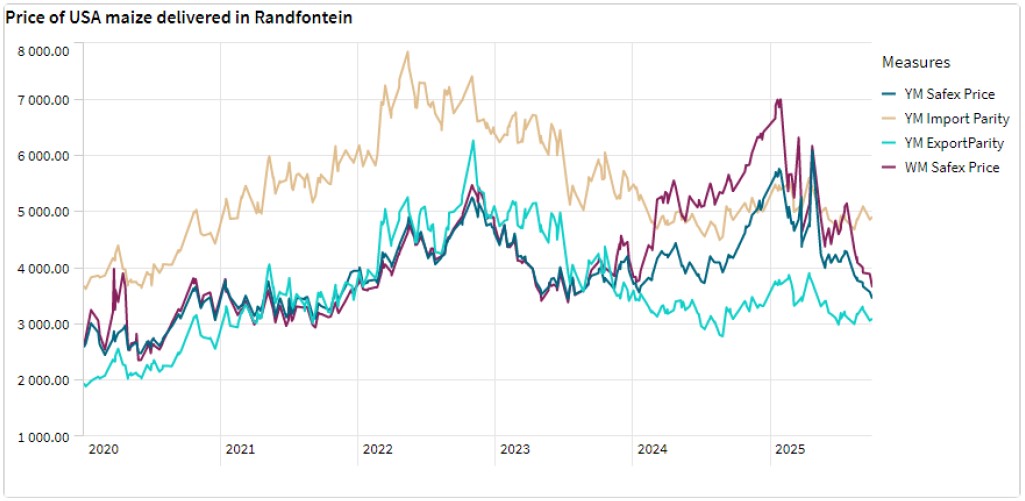
- Parity prices
South Africa is a small producer compared to other countries and is thus a price taker (meaning that we cannot influence world prices). Because of this, our local prices are normally between import and export parity, which is illustrated in the figure below. An import parity price is defined as the price which a buyer will pay to buy the product on the world market. This price will include all the costs incurred to get the product delivered to the buyer’s destination.
An export parity price is defined as the price that a local seller could receive by selling his product on the world market e.g., excluding the export costs. The price which the seller obtains is based on the condition that he delivers the product at the nearest export point (usually a harbour) at his own expense.
The graph below reflects the Safex price, import parity and export parity of yellow maize as well as the Safex price of white maize. The import and export parity prices for white maize is not released by Grain SA for this period.
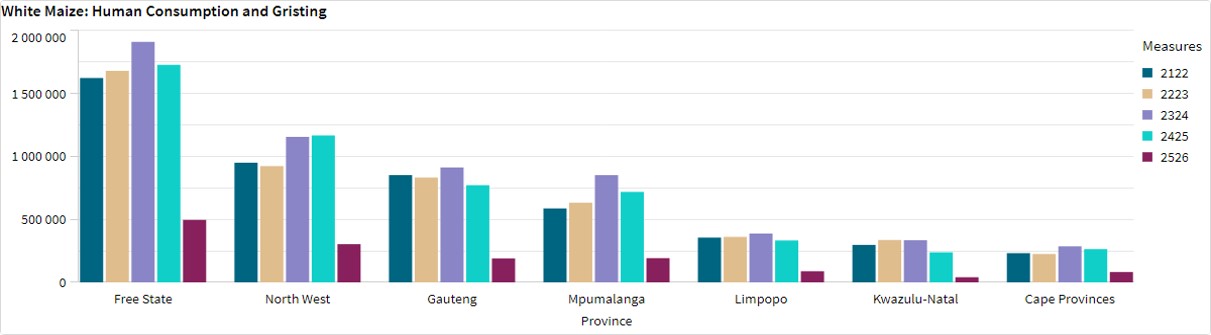
- Grain processing per province
For the marketing year 2024/2025, May 2025 to April 2026, the Free State dominates the white maize that is used for human consumption and gristing. North West consumed the second most white maize produced for human consumption for the marketing year.
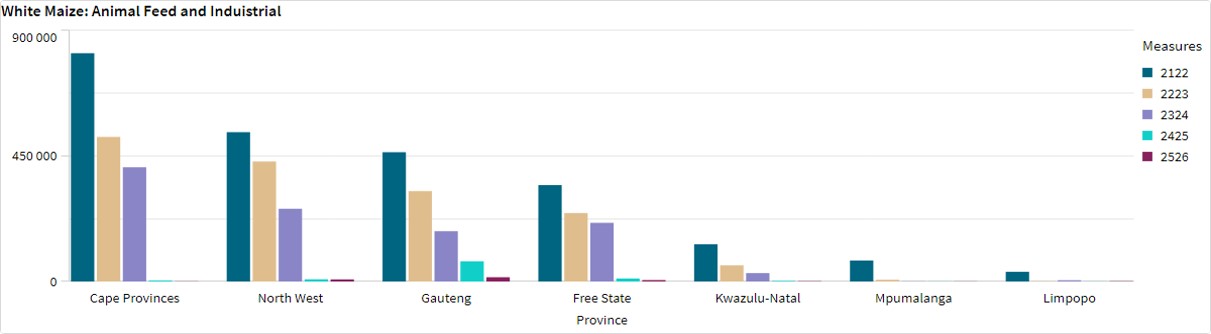
Gauteng used the most, white maize for animal feed and industrial usage with the North West using the second most.
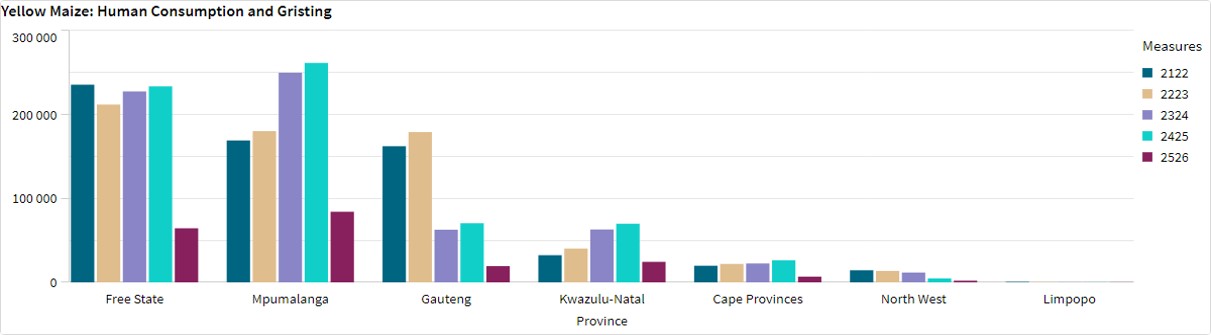
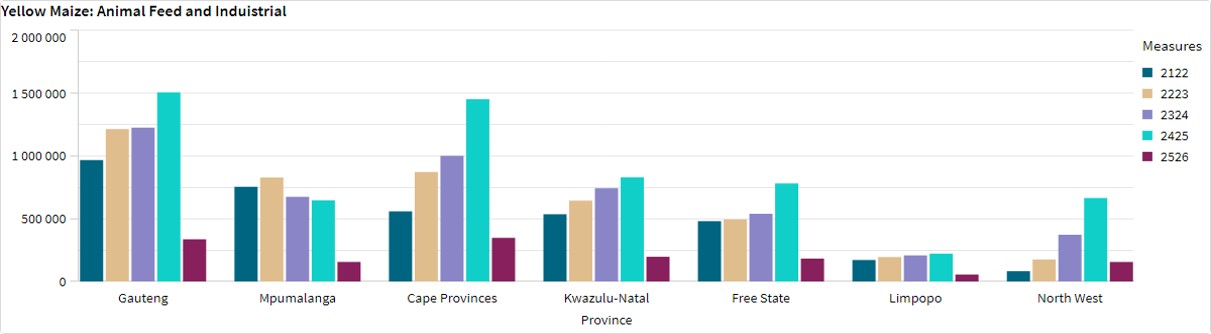
Mpumalanga processed the most yellow maize for consumption and gristing and Cape Provinces processed the most yellow maize for animal feed and industrial purposes.
- Exchange rate
NWK Group is exposed to foreign exchange rate risk in various business areas, such as commodity prices and trade imports, etc.
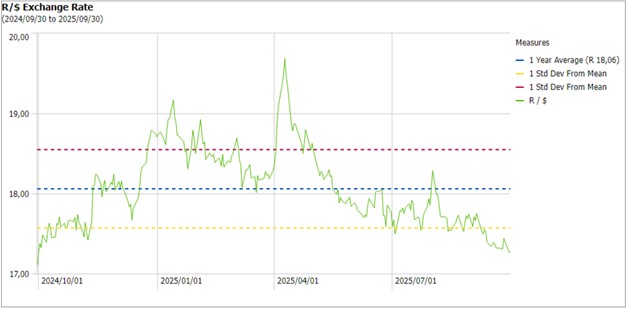
The rand traded at a monthly average of R17,46 against the dollar for the month of September, that is 1,51% better than in August. Over the past month, the South African rand has strengthened 2,60%, and is up by 1,69% over the last twelve months.
Source: Trading Economics
- Interest rate
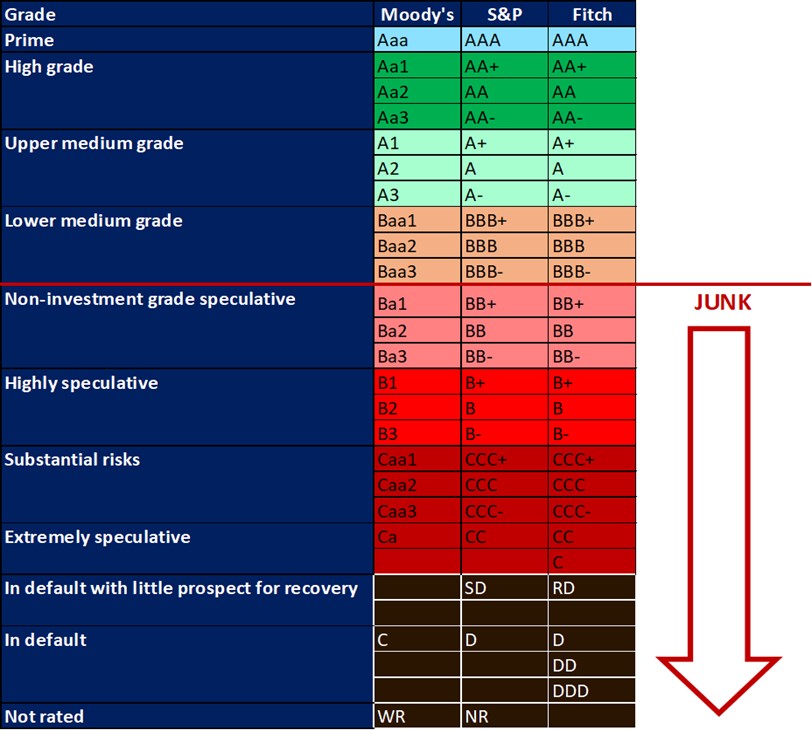
On 27 March 2020, Moody’s downgraded South Africa’s sovereign credit rating to sub-investment grade and placed a negative outlook on the rating. The key drivers for this downgrade include weak economic growth, continuous deterioration in fiscal strength, and slow progress on structural economic reforms. It is now the first time in post-apartheid South Africa that all major rating agencies, i.e., Moody’s, Fitch, and S&P, have South Africa’s credit ratings in sub-investment grade territory. More than a year later and our Moody’s rating remains the same.
During the previous Monetary Policy Committee (MPC) meeting held on 18 September the committee decided to keep interest rates unchanged. The repo rate is currently 7% and the prime rate is 10,5%.
Interest rate movement:
27th March 2024 – 11,75%
30th May 2024 – 11,75%
18th July 2024 – 11,75%
19th September 2024 – 11,50%
21st November 2024 – 11,25%
30th January 2025 – 11,00%
20th March 2025 – 11,00%
29th May 2025 – 10,75%
31st July 2025 – 10,50%
18th September 2025 – 10,50%
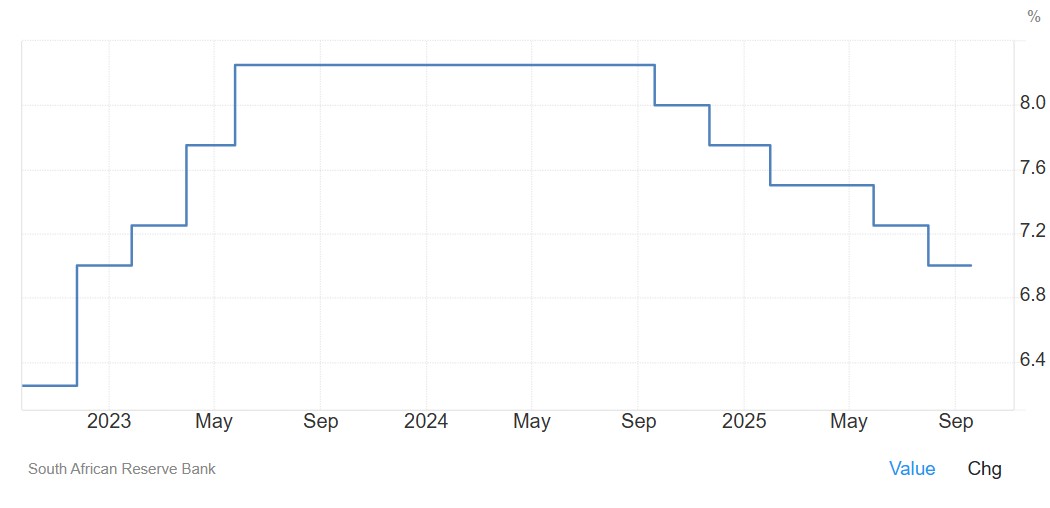
The South African Reserve Bank left its key repo rate unchanged at 7% on September 18, 2025, as widely anticipated, signalling caution amid global uncertainty while preparing to adopt a new 3% inflation target. The decision was not unanimous, with four members voting to keep rates unchanged and two favouring a 25-basis-point cut.
Since September last year, rates have been reduced by 125 basis points, and policymakers said they are pausing to assess the impact on the economy, evolving expectations, and inflation risks. They observed that headline inflation has risen recently as expected and is projected to peak in the near term, averaging 3,4% in 2025 and 3,6% in 2026 – slightly higher than the previous forecast – before easing back to 3% in 2027.
Meanwhile, the 2025 growth forecast was raised to 1,2% from 0,9% after Q2 GDP exceeded expectations, with modest gains expected in the coming years, aided by structural reforms, despite export headwinds from higher tariffs.
Source: South African Reserve Bank: Trading economics
- Inflation rate
As the inflation rate is a driver for increases and decreases in interest rates the current rate and forecast have to be assessed to foresee further increases in the interest rate.
Current: South Africa’s annual inflation rate inched up to 3,4% in September 2025, from 3,3% in August, slightly below market forecasts of 3,5%. Price growth accelerated primarily for housing & utilities (4,5% vs 4,3% in August), largely on account of electricity and gas and water supply; restaurants & hotels (3% vs 2,6%) and miscellaneous goods & services (2,8% vs 2,6%).
At the same time, transportation costs declined at a slower pace (-0,1% vs -1,4%), of which fuels (-2,2% vs -5,7%). Meanwhile, food prices (4,5% vs 5,2%) recorded the smallest increase in five months. The core inflation rate, which excludes food, non-alcoholic beverages, fuel, and energy, inched up to a seven-month high of 3,2% in September 2025, from 3,1% in the prior month. On a monthly basis, the CPI rose by 0,2% in September, following a 0,1% decrease in the prior month.
Source: Statistics South Africa

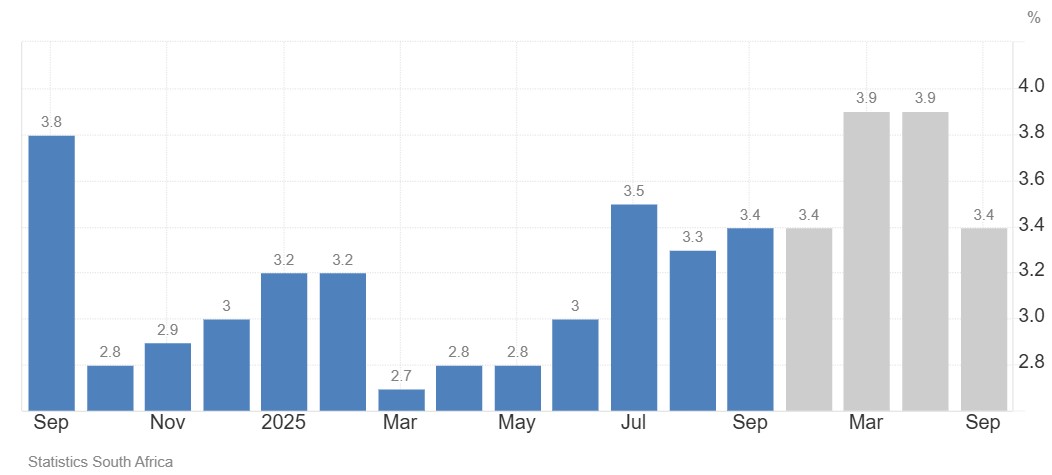
Inflation Rate in South Africa is expected to be 3,4% by the end of this quarter, according to Trading Economics global macro models and analysts’ expectations. In the long-term, the South Africa Inflation Rate is projected to trend around 3,6% in 2026 and 3,1% in 2027, according to their econometric models.
Source: https://tradingeconomics.com/south-africa/inflation-cpi
- Highlights in the agrochemical sector
Insecticide prices showed a minimum change with an average month-on-month increase of 0,08%. Herbicide prices, however, saw a decline in average month-on-month prices of 2,03%. Led by a 17,21% fall in Atrazine prices. Fungicide prices decreased by 1,75% month-on-month, with Trifloxystrobin prices seeing a 6,69% month-on-month change. On a year-on-year basis, chemical prices remain significantly lower across the board with fungicides down 19,52%, herbicides down 18,98%, and insecticides down 0,23%.
1. Herbicides
The following products are the main products regarding herbicides that may have an impact on input costs for producers.
Glyphosate (95%)
Acetochlor (92%)
Atrazine (97%)
Metolachlor (97%)
Trifluralin (95%)
The following comparison is from the September 2025 Grain SA report which reports the previous month’s prices.
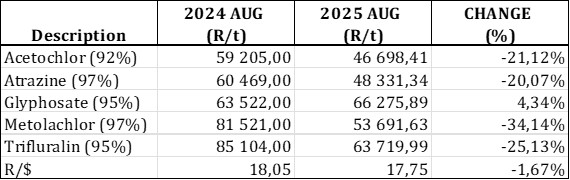
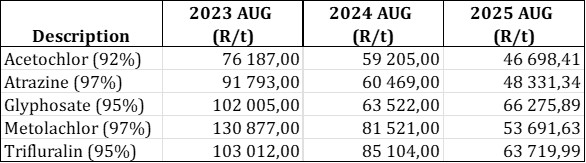
In comparison with the previous year’s prices, all of the products experienced a price decrease. Metolachlor had the biggest decrease with 34,14%. Glyphosate however, increased with 4,34%.
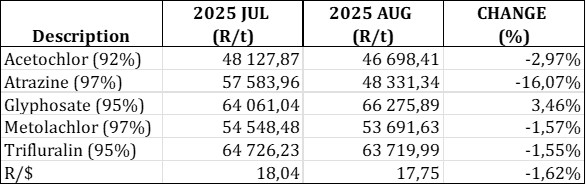
For the two months compared all of the products experienced a price decrease, except for Glyphosate which increased by 3,46%.
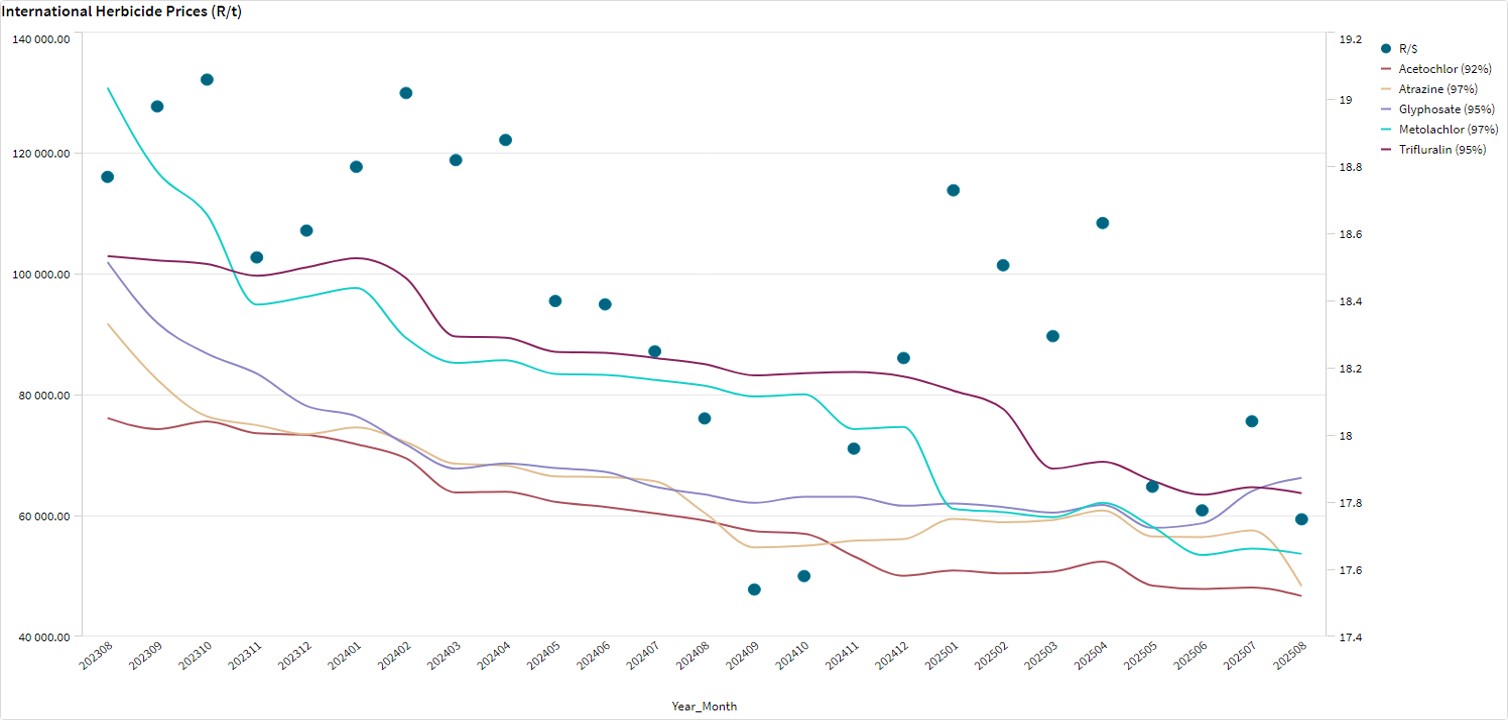
The graph below shows the international herbicides prices (R/t) per product from May 2023 to date.
2. Insecticides
The product Terbufos has been banned from being imported and used in South Africa. The product is also known as Halephirimi.
The following products are the main products regarding insecticides that may have an impact on input costs for producers.
Imidacloprid (95%)
Lambda-cyhalothrin (95%)
Carbofuran (99%)
Deltamethrin (98%)
Acetamiprid (95%)
Chlorpyrifos (95%)
Cypermethrin (94%)
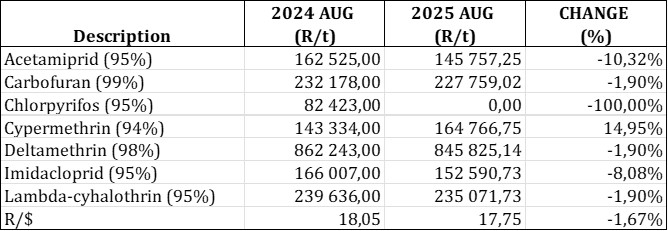
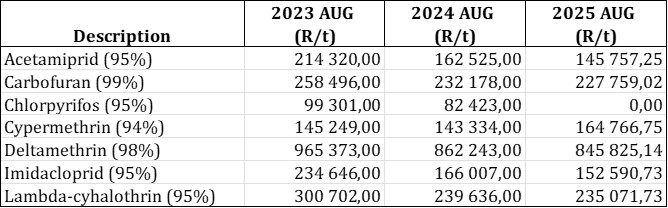
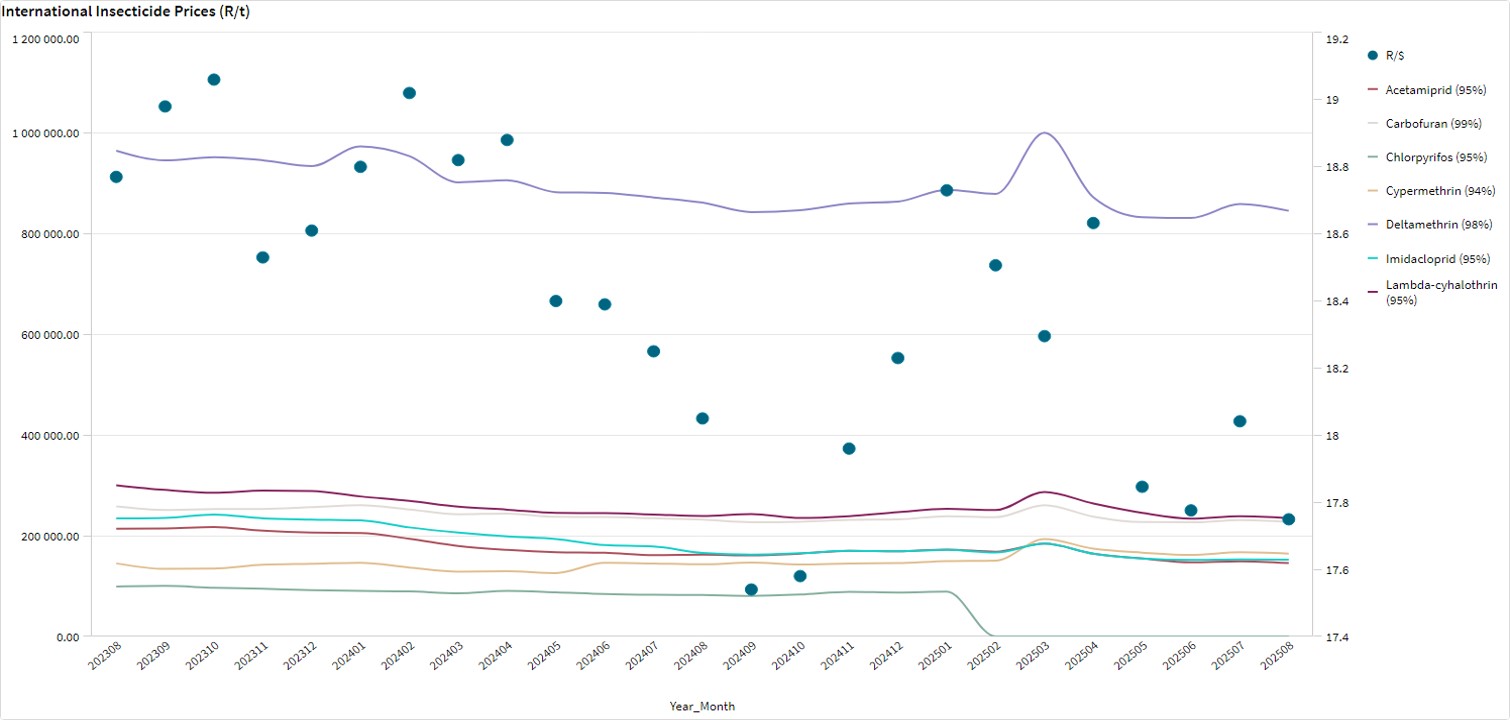
Please note: The price of Chlorpyrifos was not included in the data used to generate the tables and the graph, thus it shows a value of R0.00 for 2025.
In comparison with the previous year’s prices, most of the products experienced a price decrease. Cypermethrin however, experienced a big price increase of 14,95%.
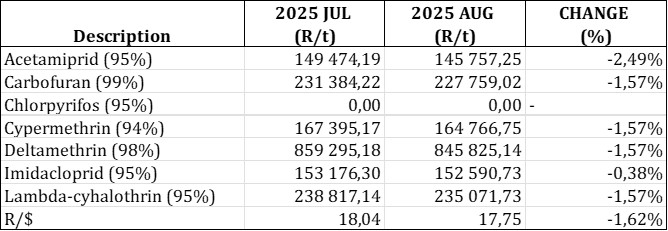
For the two months compared all of the products experienced a price decrease. Acetamiprid experienced the biggest price decreased with 2,49%.
The graph below shows the international insecticide prices (R/t) per product from May 2023 to date.
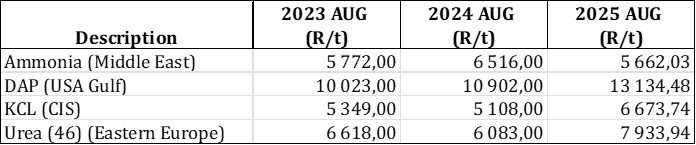
3. Fertiliser
The following fertiliser products are being analysed:
Ammonia (Middle East)
Urea (46%) (Eastern Europe)
DAP (USA Gulf)
KCL (CIS)
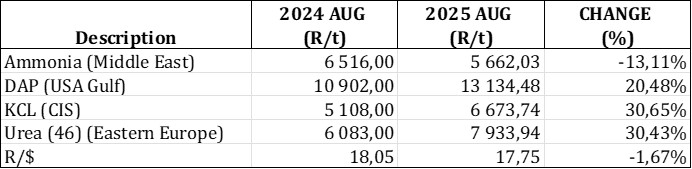
In comparison with the previous year’s prices, three of the products, experienced a price increase. KCL (CIS) experienced the biggest price increase with 30,65%.

In comparison with the previous month’s prices half of the products experienced a price increase with urea increasing the most with 2,03%.
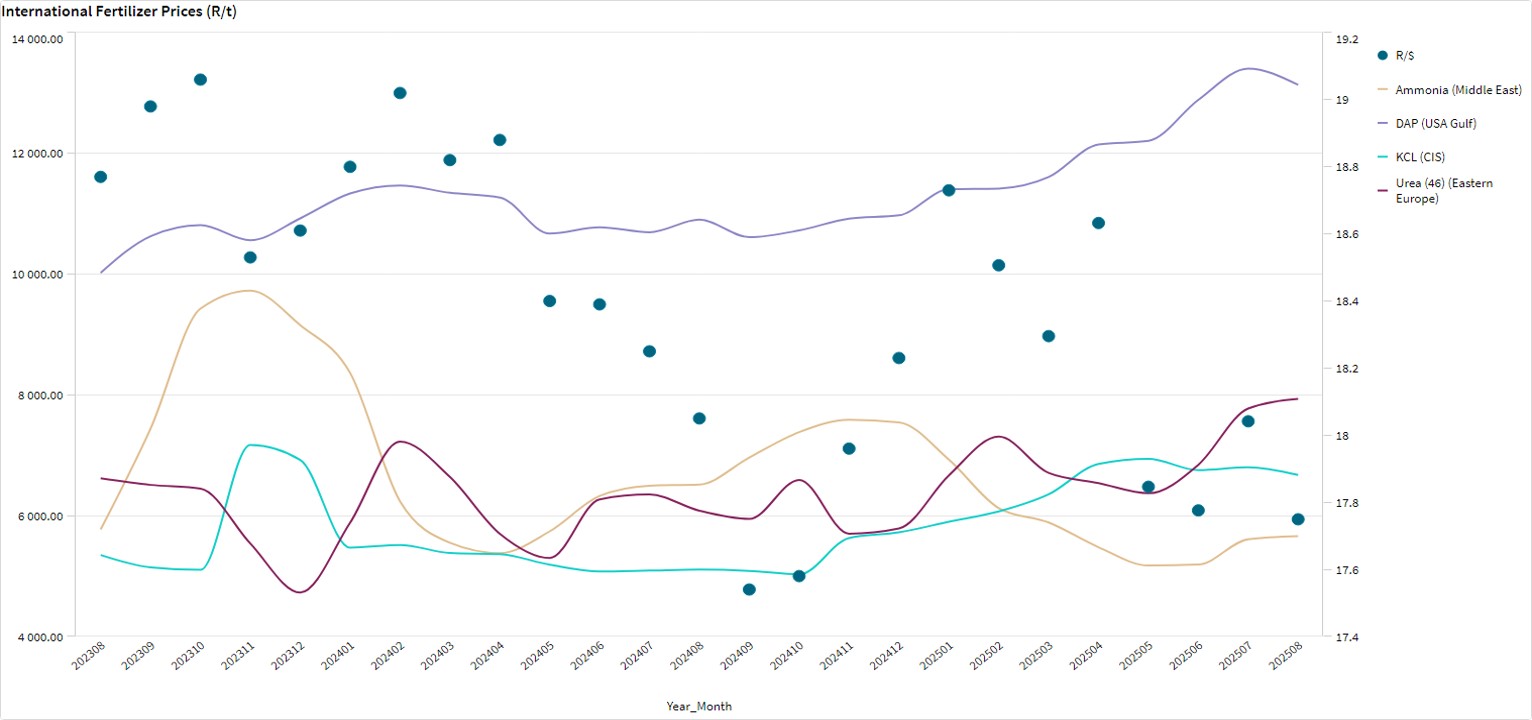
The graph below shows the International Fertiliser prices (R/t) per product from May 2023 to date.
Nitrogen
Urea: India’s latest tender attracted an unusually large volume of offers – 5,6 million tons – highlighting oversupply and putting downward pressure on prices. However, India is only securing 2 million tons.
Ammonia
- Ammonium Sulphate (Amsul): Prices dropped due to weak nitrogen demand and oversupply from China, and although there has been some buying activity, prices are likely to stay low without strong demand from Brazil.
- Ammonium Nitrate (AN): Prices are under pressure due to weak demand, with the market waiting for European buying to pick up in the next month or two, causing prices to follow the downward trend of urea for now.
- Ammonia: Prices continue to rise due to ongoing production challenges in the Middle East and North Africa, which are limiting supply.
Phosphate and Potash
Phosphate: Although supply remains tight, preventing a sharp drop in prices, the overall market trend continues to point downward.
Potash: Prices in Brazil dropped $5/t, despite record-high imports expected to exceed 12,5 million tons by month end
4. Fuel price
The wholesale diesel price has been on a downward trend recently, now at R19,44 per litre, there is, however, an anticipated decrease of 9,53 cents per litre.
Brent crude prices increased from 15 August 2025 to 15 September 2025, driven by supply concerns following Ukrainian strikes on Russian energy facilities. The bottom graph tracks the under- or over-recovery for both petrol 95 and diesel 0,05%. Over-recovery (above the zero line) suggests a potential price decrease. In the past few days leading up to 01 October 2025, diesel shows consistent over-recovery, supporting the expected price cut of 9,53 cents per litre.
Source: https://www.grainsa.co.za/upload/report_files/Input-Monitoring-Report-September.pdf
Future prices
The graphs below illustrate the market sentiment for maize, in the form of future contracts, for the upcoming contract months. The market sentiment is the expectation of supply and demand fundamentals relating to white‑ and yellow maize in South Africa.
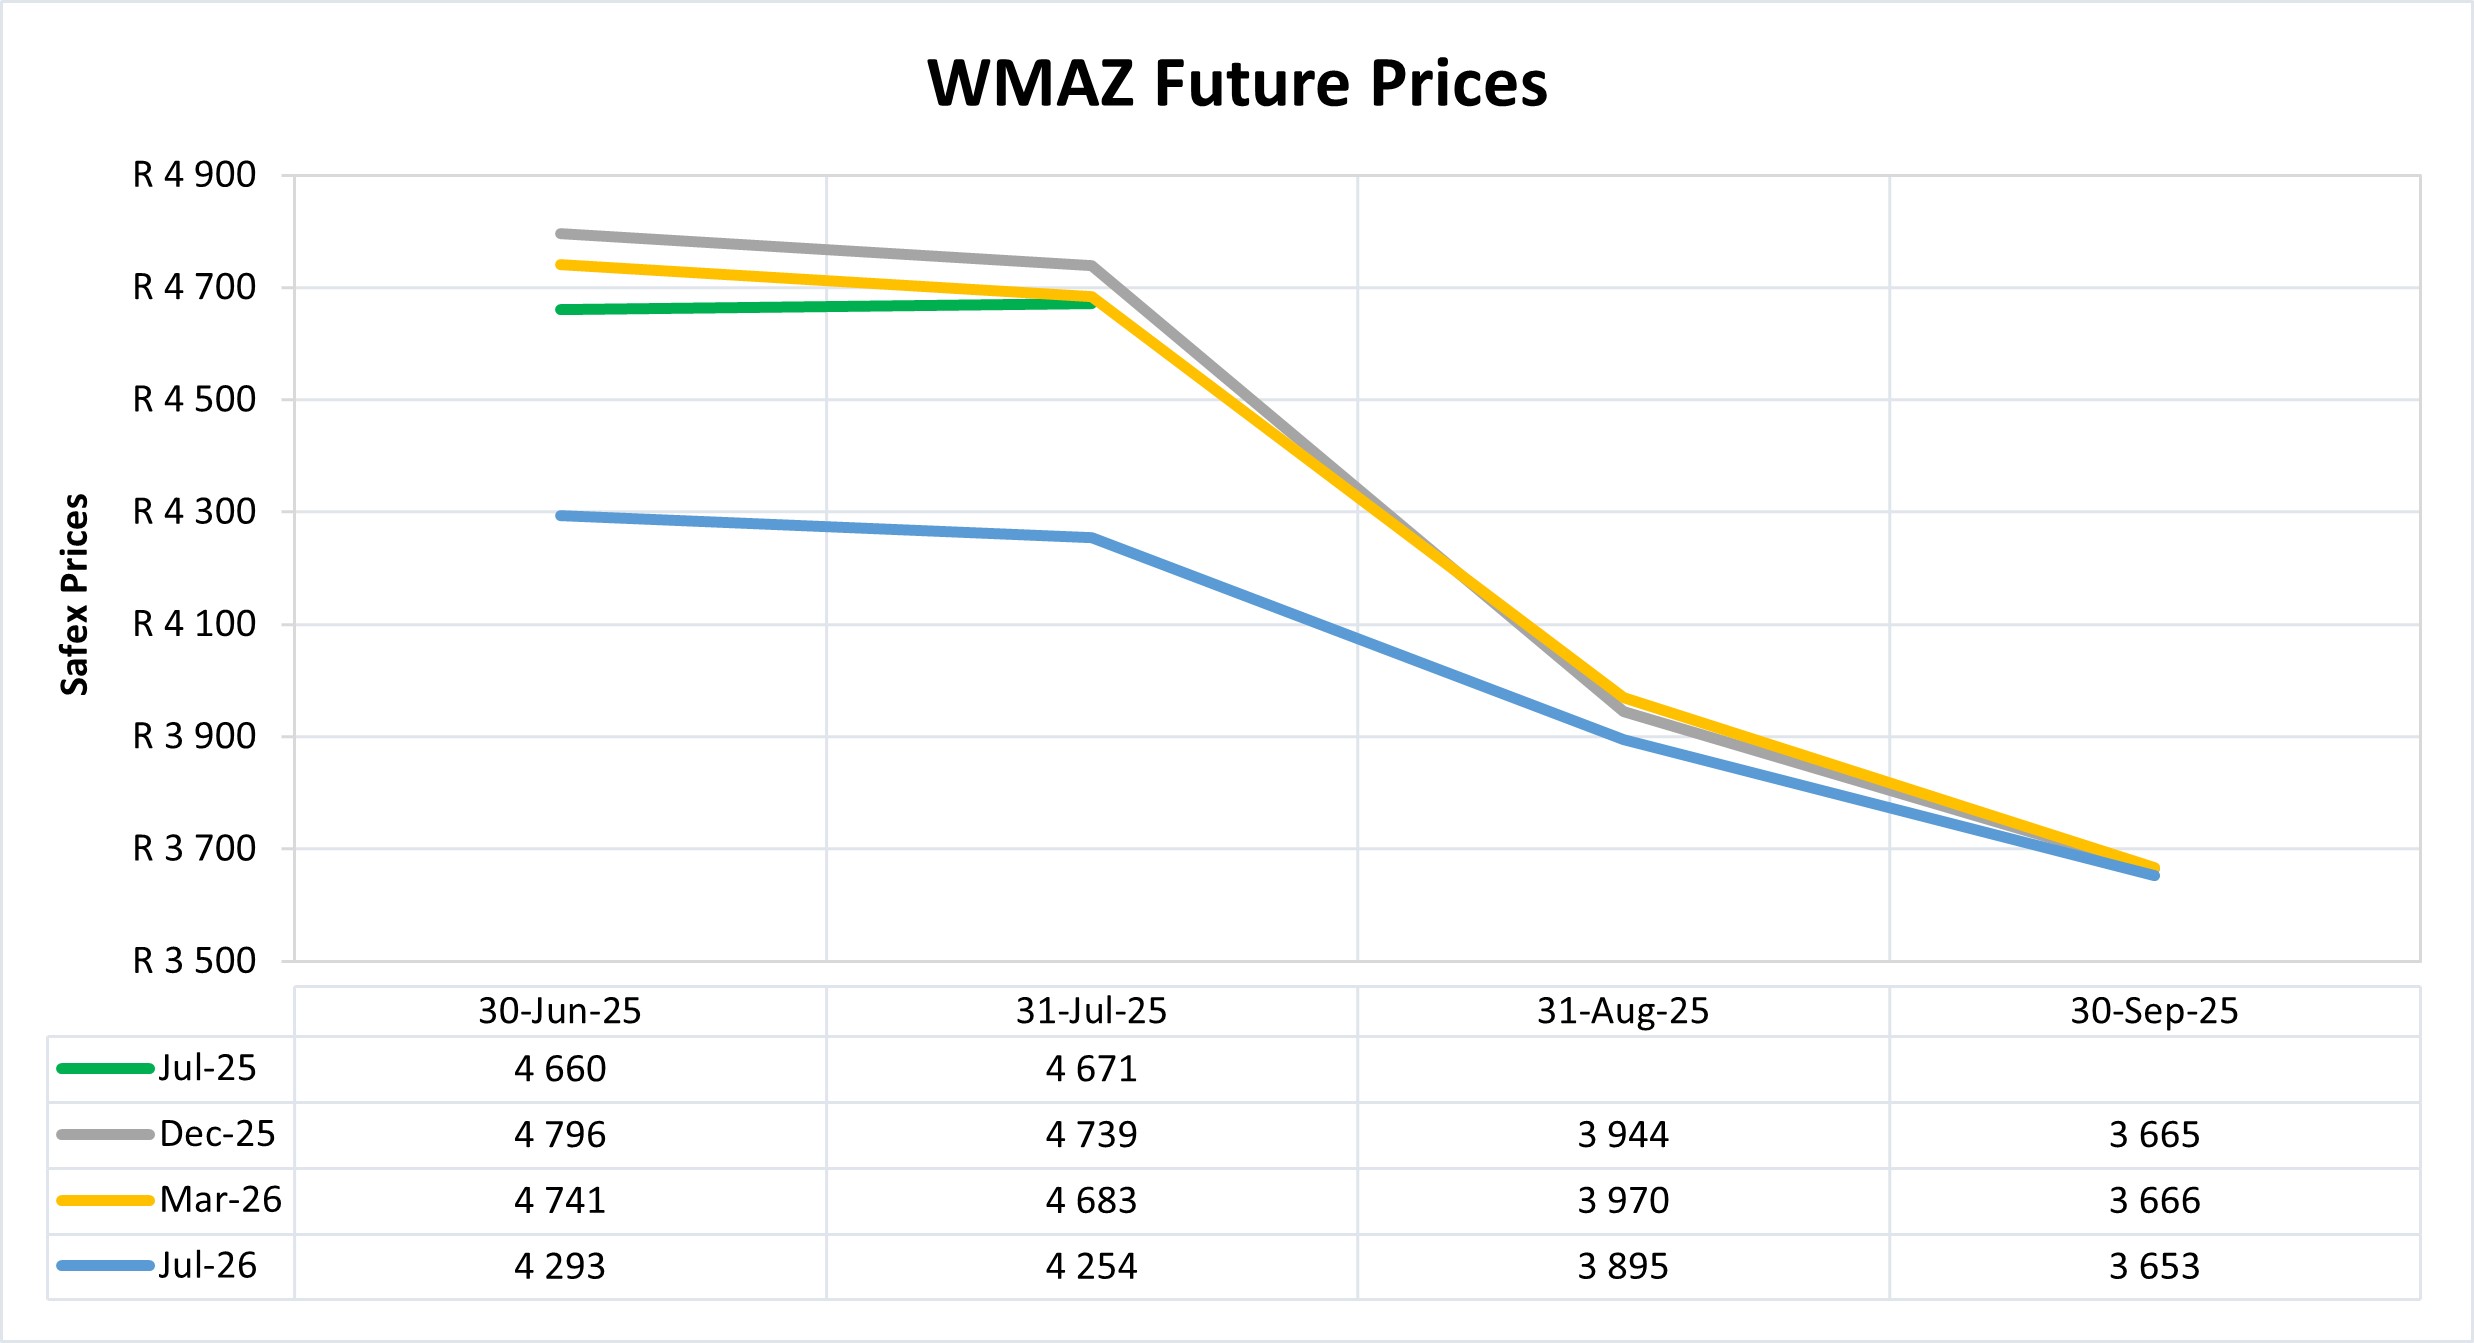
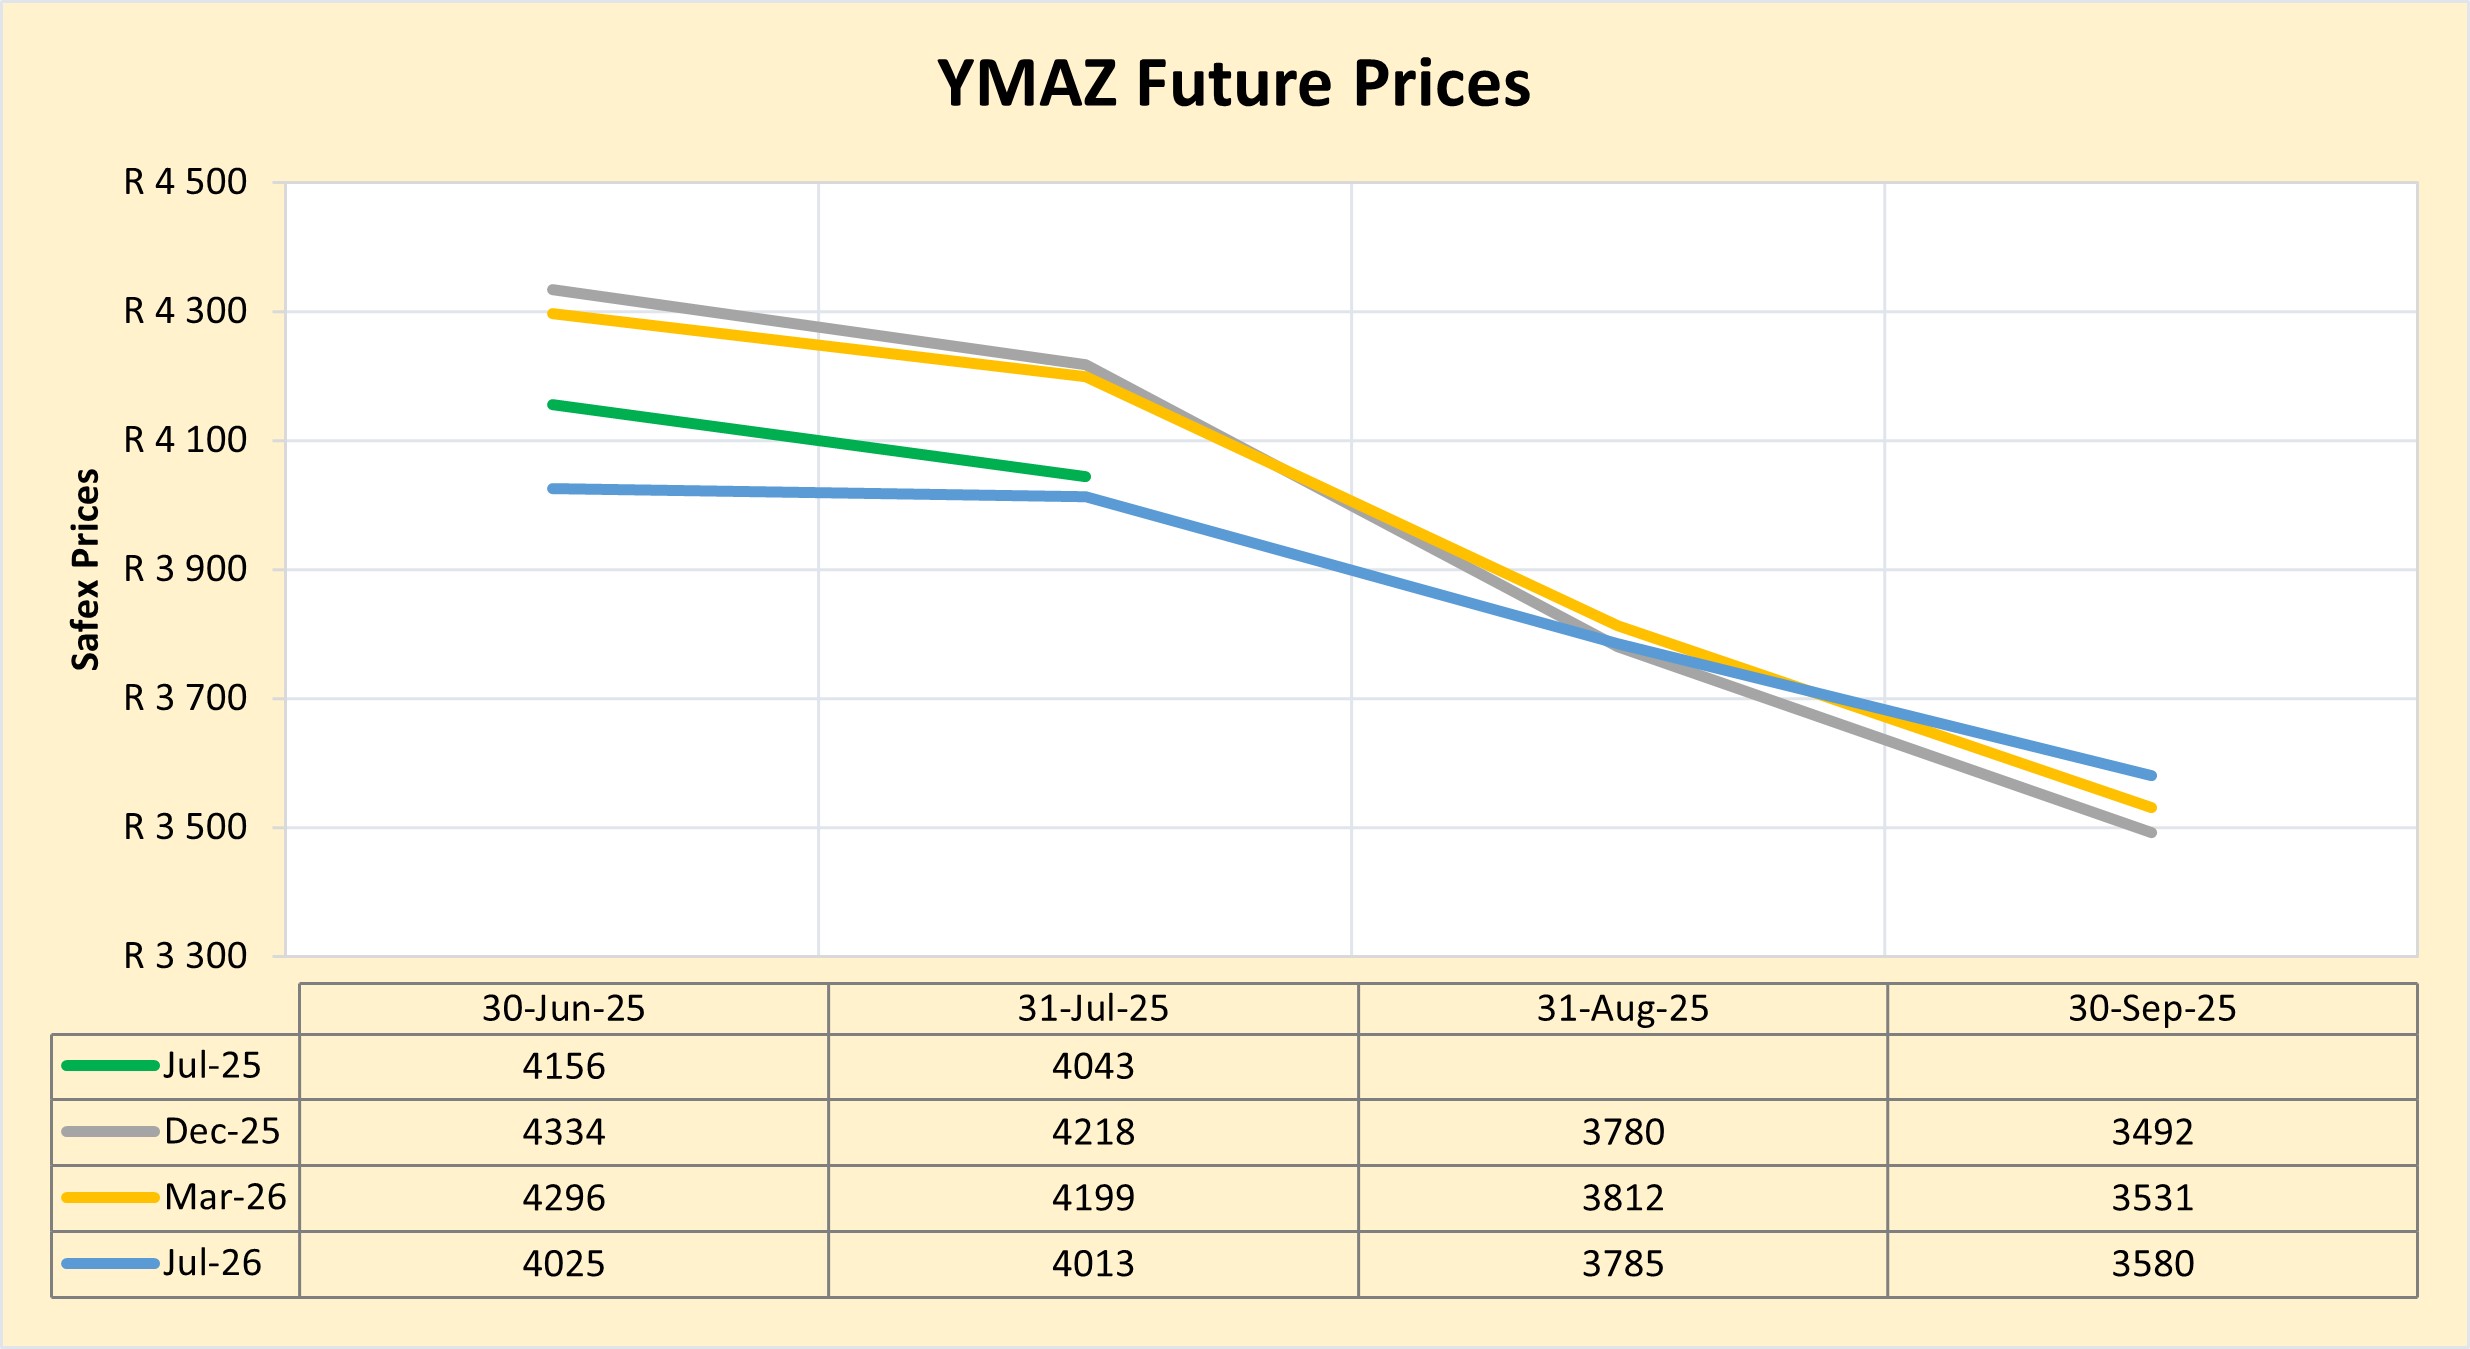
DOMESTIC MARKET OVERVIEW
Maize prices decreased further in the fourth quarter of 2025 as production picked up. A large domestic crop and the relatively slow pace of exports have contributed to lower prices, which is a welcome development for consumers and the livestock and poultry industries, according to IOL and the National Agricultural Marketing Council (NAMC). On the other hand, low prices mean less revenue for maize producers.
Fraud risk
FRAUD AWARENESS
Black Friday tips and tricks! Don’t let the excellent deals make a fool out of you. Here are a few tips and tricks that can help you have a successful black Friday.
- Stick to the plan:
- Plan your purchases and stick to your budget. A list can help to keep the temptation of spending more at bay. Know the prices of the item you aim to buy, to avoid delas that are too good to be true.
- Use pricing trackers for Black Friday to ensure the special is really special
- Serval the Takealot price tracker can help you make better decisions on when it’s the best time to buy on Takealot. https://www.servaltracker.com/
- Buck.cheap allows you to track prices across multiple major retailers, like Takealot, Makro and Woolworths. It helps compare prices and ensure you’re getting the best available deals. https://buck.cheap/
- Is it safe and secure?
- Shop on trusted retailer websites and make sure your checkout is secure. Look for the padlock icon before the URL. HTTPS is the secure version of HTTP. Remember, public Wi-Fi does not keep you protected from cybercrime, it gives cybercriminal access to any unsecured devices on the same network.
- Beware of phishy emails.
- Black Friday and Cyber Monday always show a massive increase in phishing email attacks. Be wary of emails offering cash prizes or last-minute deals. Delete emails that seem suspicious or form unknown sources.
- Keep an eye on your bank statements.
- Cybercriminals make use of the online activity frenzy, trying to sneak in a few undetected purchases. So be aware of any unusual transactions.
- Updated software is safe software
- Ensure that all your security software is up to date. This will prevent scammers from gaining access to your computer through vulnerabilities in older/outdated systems.
Sources
https://www.digitalstreetsa.com/maximize-your-savings-the-best-pricing-trackers-for-black-friday-in-south-africa/
https://www.rsm.global/southafrica/news/8-cybersecurity-tips-black-friday
https://www.metacompliance.com/blog/cyber-security-awareness/10-cyber-safety-tips-for-black-friday-cyber-monday


