
The NWK Limited external factors report provides an overview of the main external factors that NWK and its clients are exposed to at a specific point in time. This report opts to aid in a timely basis to foresee external market and other factors that may have an impact on any business and clients. The main focus of this document is to have a closer look at external factors that can affect any business and our customers.
Executive summary
The National Agricultural Marketing Council (NAMC) predicts 30 April 2022 ending stock for white and yellow maize to exceed that of the 2020/2021 season. Their forecast for white maize for the season is that of an excellent harvest. The estimated maize crop is 6% bigger than the 2020/2021 crop. The three main maize producing areas, namely the Free State, Mpumalanga and North West provinces are expected to produce 84% of the 2021/2022 crop.
The repo rate has been cut by 300 basis points to help mitigate the economic fallout of the COVID-19 pandemic until November 2021. During November 2021 the Monetary Policy Committee (MPC) of the South African Reserve Bank (SARB) increased the repo rate with 25 basis points, thus the repo rate is currently 3,75% and the prime rate is 7,25%.
Market risk
1. Grain market analysis
- Ending stock – national
Ending stock data is gathered from the NAMC. The estimates are reassessed and reported by the Grain and Oilseeds Supply and Demand Estimates Committee. The following is a summary of the February 2022 ending stock estimates for the 2021/202 season:
The following is a summary of the February 2022 ending stock estimates for the 2021/2022 season:
- Sunflower => 49 504 tons
- Soybeans => 207 303 tons
- Sorghum => 110 495 tons
The following is a summary of the April 2022 ending stock estimates for the 2021/2022 season in tonnages:
- White maize => 1 929 732 tons
- Yellow maize => 1 168 132 tons
The following is a summary of the September 2022 ending stock estimates for the 2021/2022 season:
- Wheat => 552 339 tons
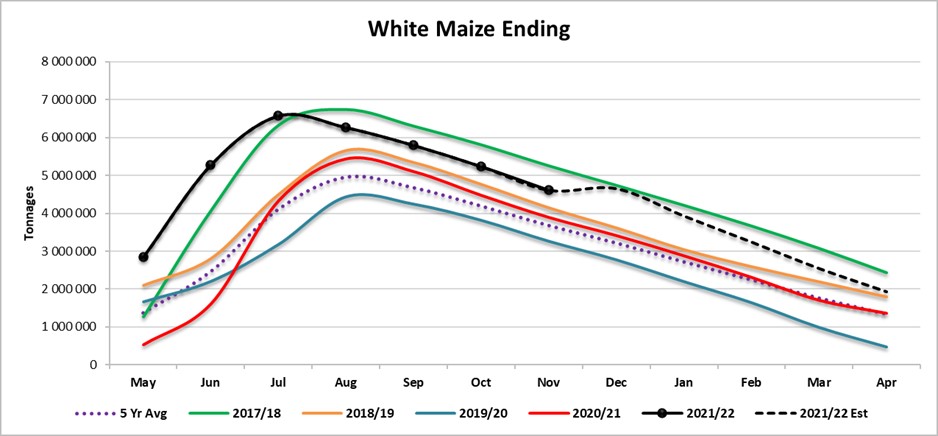
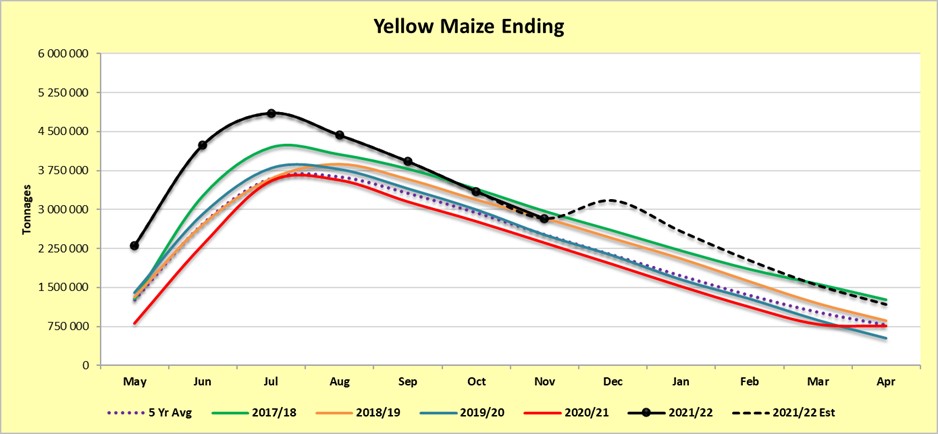
Graph 1 shows white maize ending stock for April 2022, which is 574 779 tons or 42% more than the 2020/2021 season. Graph 2 shows a 406 179 tons or a 53% increase in ending stock estimation for the 2021/2022 season over the previous season.
The sharp rise after the dip for white maize could mean that the ending stock could be less than what NAMC predicted, according to our forecasting.
Source: Sagis
Source: Sagis
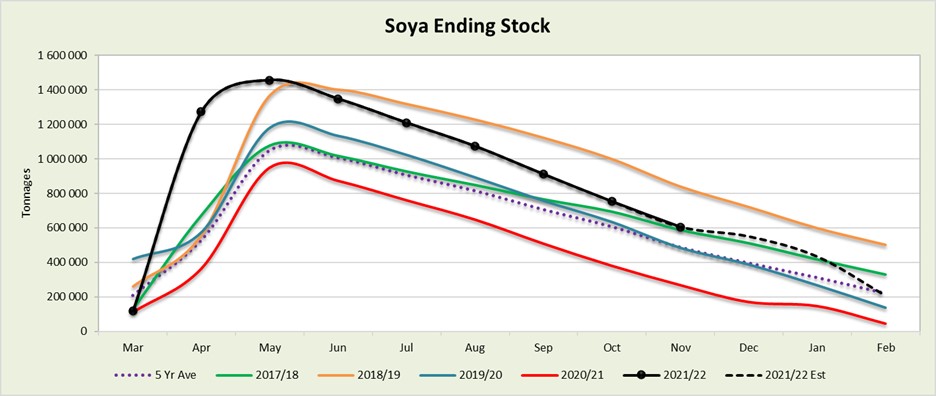
The actual soya ending stock for February 2022 is 161 250 tons more than February 2021 (Graph 3).
Source: Sagis
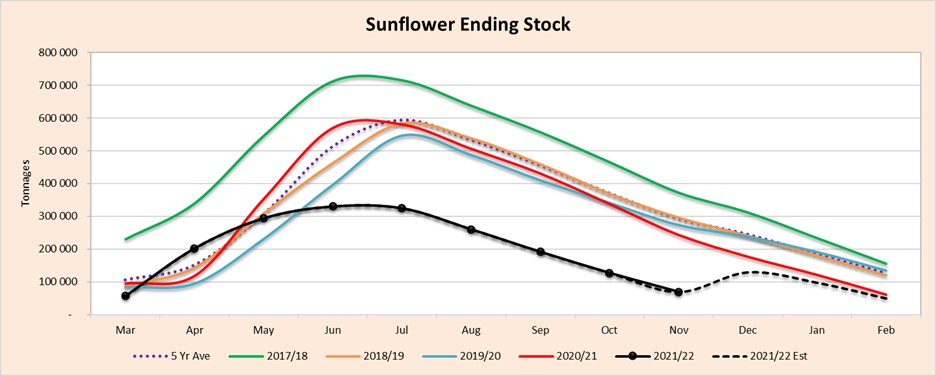
The actual sunflower ending stock is 19% (11 460 tons) less than the previous seasons ending stock (Graph 4). The sharp rise after the dip for sunflowers could mean that the ending stock could be less than what NAMC predicted, according to our forecasting.
Source: Sagis
- Crop estimations
According to the Crop Estimate Committee (CEC) the size of the expected commercial maize crop has been set at 16,234 million tons, which is 0,14% or 23 000 tons more than the previous forecast of 16,211 million tons. The area estimate for maize is 2,755 million hectares, while the expected yield is 5,89 t/ha. The estimated maize crop is 6% bigger than the 2020 crop. The three main maize producing areas, namely the Free State, Mpumalanga and North West provinces re expected to produce 84% of the 2021 crop.
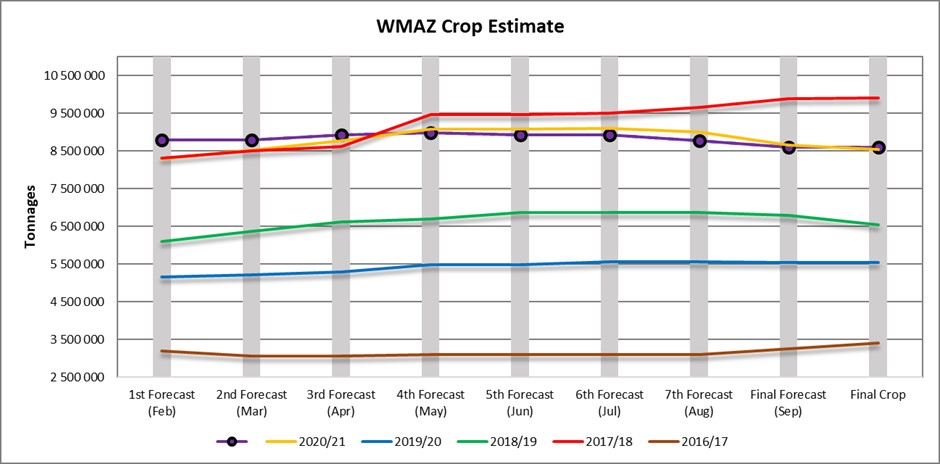
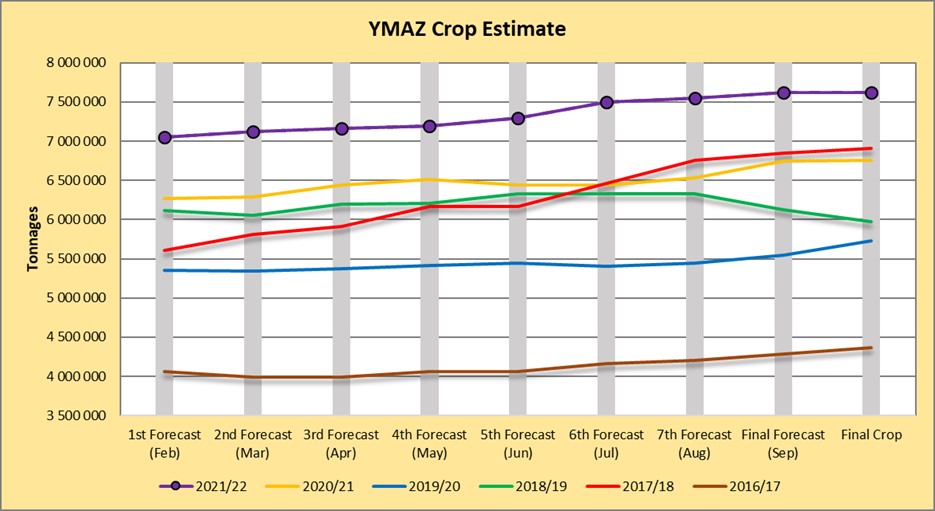
The area estimate for white maize (Graph 5) is 1,692 million hectares and for yellow maize the area estimate is 1,064 million hectares. The production forecast of white maize remained unchanged at 8,609 million tons. The yield for white maize is 5,09 t/ha. In the case of yellow maize (Graph 6) the production forecast is 7,625 million tons. The yield for yellow maize is 7,17 t/ha.
Source: CEC
Source: CEC
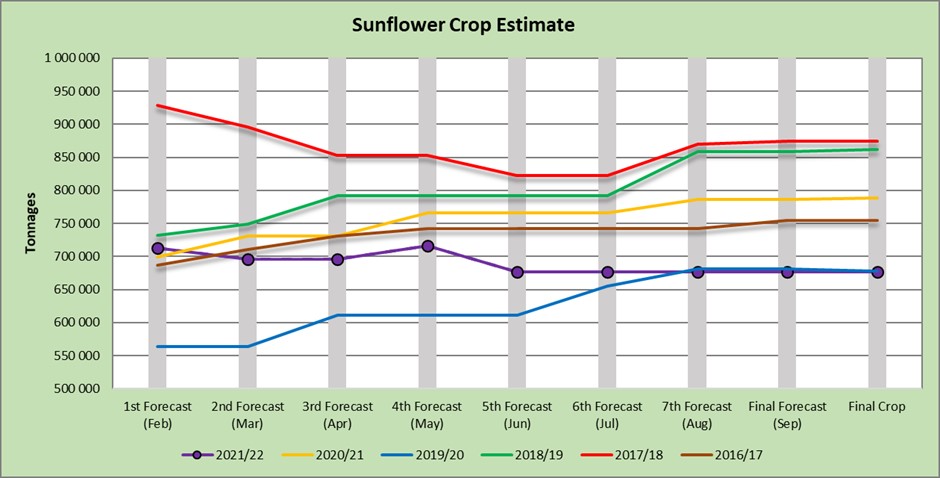
The production forecast for sunflower seed (Graph 7) remained unchanged at 677 240 tons. The area estimate for sunflower seed is 477 800 ha, while the expected yield is 1,42 t/ha.
Source: CEC
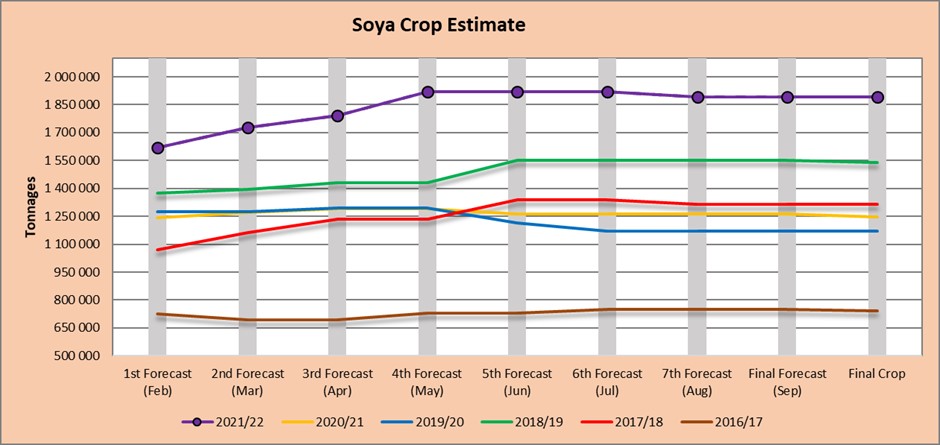
The production forecast for soybeans also remained unchanged at 1,890 million tons. The estimated area planted to soybeans is 827 100 ha and the expected yield is 2,29 t/ha (Graph 8).
Source: CEC
- Imports and exports – national
Source: Sagis
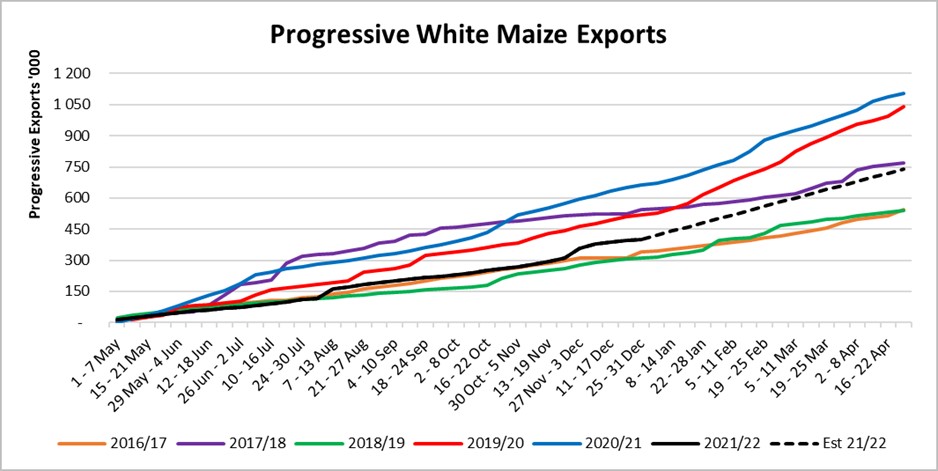
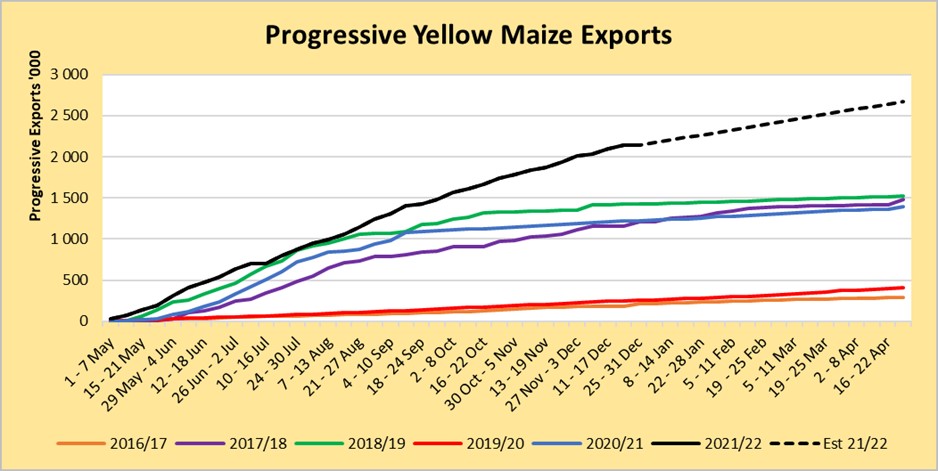
To date, 401 364 tons of white maize (Graph 9) and 2 140 167 tons (Graph 10) of yellow maize have been exported since the beginning of May 2021.
Source: Sagis
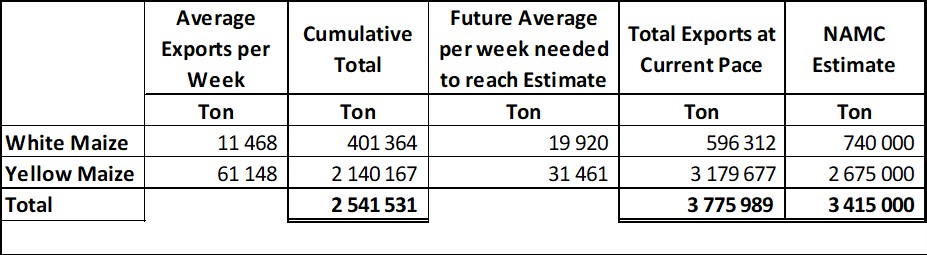
As seen in Table 1 the average white maize exports per week are currently 11 468 tons. If theoretically, white maize exports remain at the current average of 11 468 tons per week then there would be 143 688 tons less white maize exports than anticipated.
The average yellow maize exports per week are currently 61 148 tons. If theoretically, yellow maize exports remain at the current average of 61 148 tons tons per week then there would be 504 677 tons more yellow maize exports than anticipated.
- Parity prices
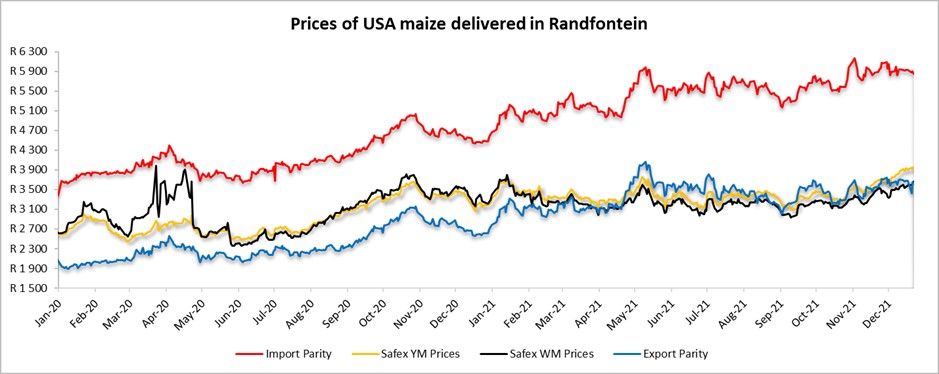
South Africa is a small producer compared to other countries and is thus a price taker (meaning that we cannot influence world prices). Because of this, our local prices are normally between import and export parity, which is illustrated in which is illustrated in Graph 11. An import parity price is defined as the price which a buyer will pay to buy the product on the world market. This price will include all the costs incurred to get the product delivered at the buyer’s destination.
An export parity price is defined as the price that a local seller could receive by selling his product on the world market for example, excluding the export costs. The price which the seller obtains is based on the condition that he delivers the product at the nearest export point (usually a harbour) at his own expense.
Source: Grain SA
- Producer deliveries – provincial
For the marketing year which is May to April the Free State province dominates the white maize which is used for human consumption and gristing. North West showed a significant increase for the 2020/2021 season with a 1% rise over the previous season (Graph 12).
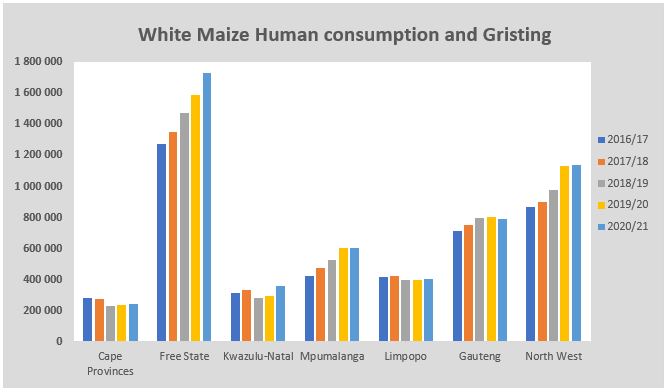
Source: Sagis
North West has a decreasing trend in yellow maize which is used for consumption and gristing. Only 18 563 tons of yellow maize was used in the 2020/2021 season that ended April 2021 (Graph 13).
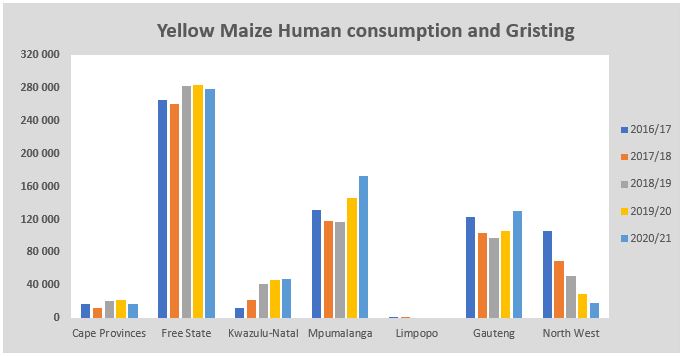
Source: Sagis
- Exchange rate
NWK Group is exposed to foreign exchange rate risk on various business areas, such as commodity prices and trade imports.
On a monthly average basis, the rand depreciated against the US dollar with 2,25% (0,35c) over the period November 2021 to December 2021. The one-year average for rand/US dollar is 14,78. Moreover, the average rand/US dollar exchange rate for the period December 2021 was R15,87 compared to R15,52 in November 2021 (Graph 14).
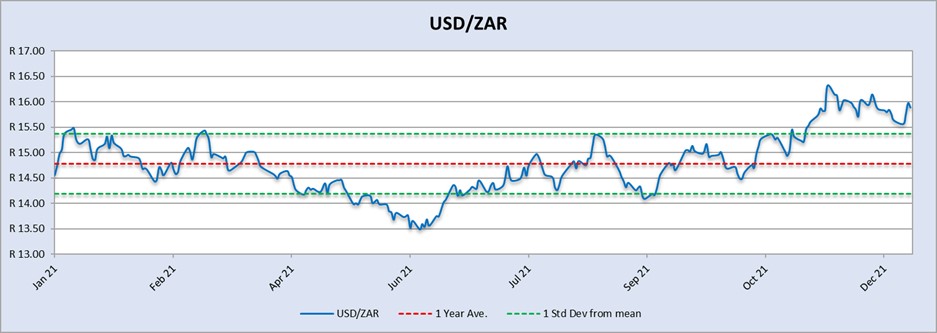
Source: Standard Bank, Corporate and Investment Banking & SARB
Exchange rate forecast: Graph 15 shows the actual USD/ZAR for 2021 Quarter 3 (Q3) and 2021 Quarter 4 (Q4) against the forecasted figures. Trading Economics’s forecast for 2021 Q4 was the closest to actual. According to Nedbank and Trading Economics the rand will weaken in the year 2022.
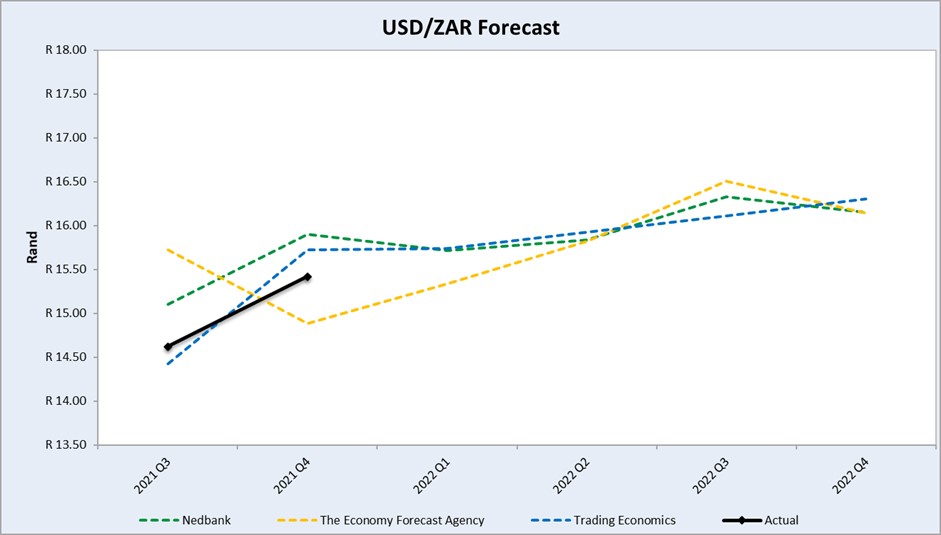
Source: Nedbank CIB; Absa; The Economic Forecast Agency; Trading Economics
- Future prices
Graphs 16 and 17 illustrate the market sentiment for maize, in the form of future contracts, for the upcoming contract months. The market sentiment is the expectation of supply and demand fundamentals relating to white and yellow maize in South Africa.
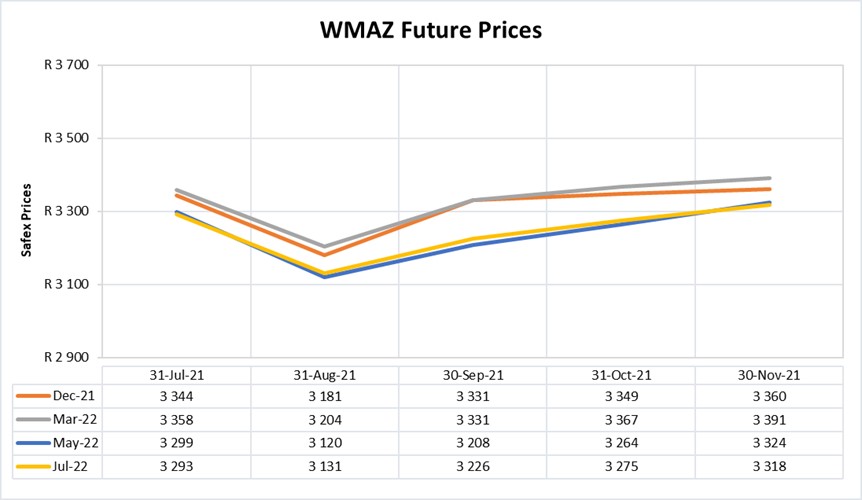
Source: Sagis
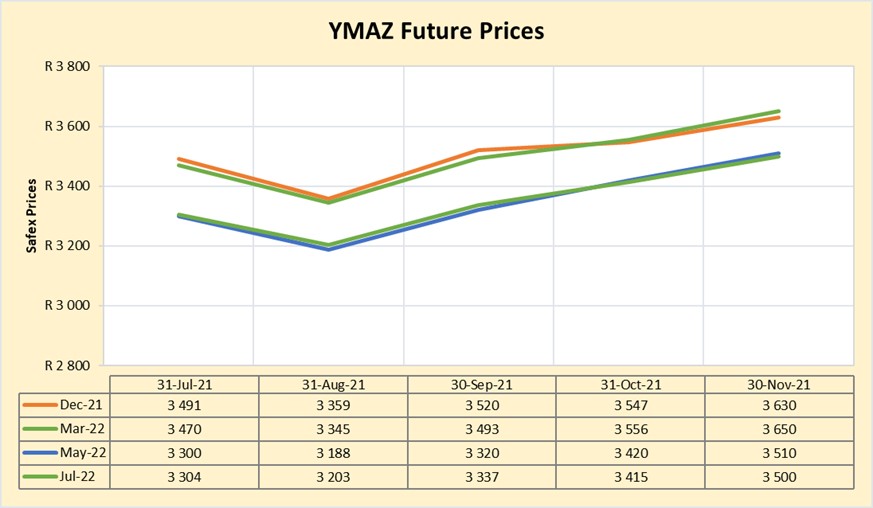
Source: Sagis
WEATHER AND CLIMATE
In November, the continuance of La Niña was reflected in the below-average sea surface temperatures (SSTs) extending across the equatorial Pacific Ocean.
In summary, a La Niña is favoured in the next couple of months, with a 81% to 100% chance of La Niña from November 2021 until January 2022.
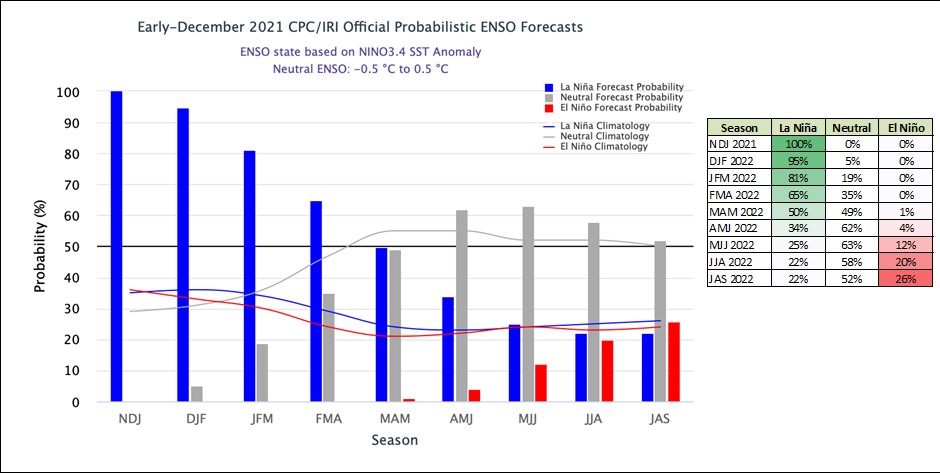
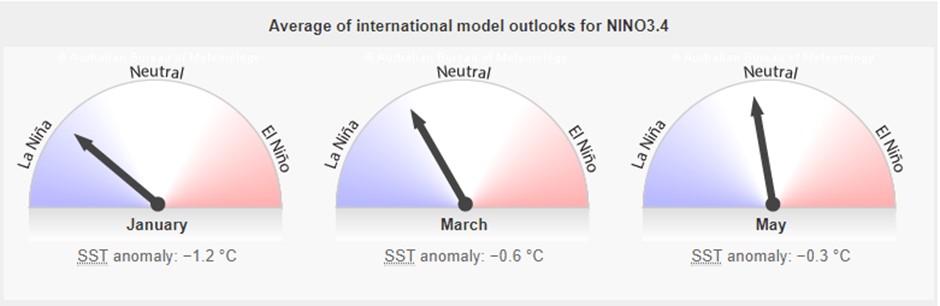
The El Niño–Southern Oscillation (ENSO) is edging towards La Niña in recent months. Model outlooks suggest this event will peak in early 2022 with a return to neutral likely in early autumn. This would make it a rather short-lived event; however, impacts may still be significant.
INTEREST RATE RISK
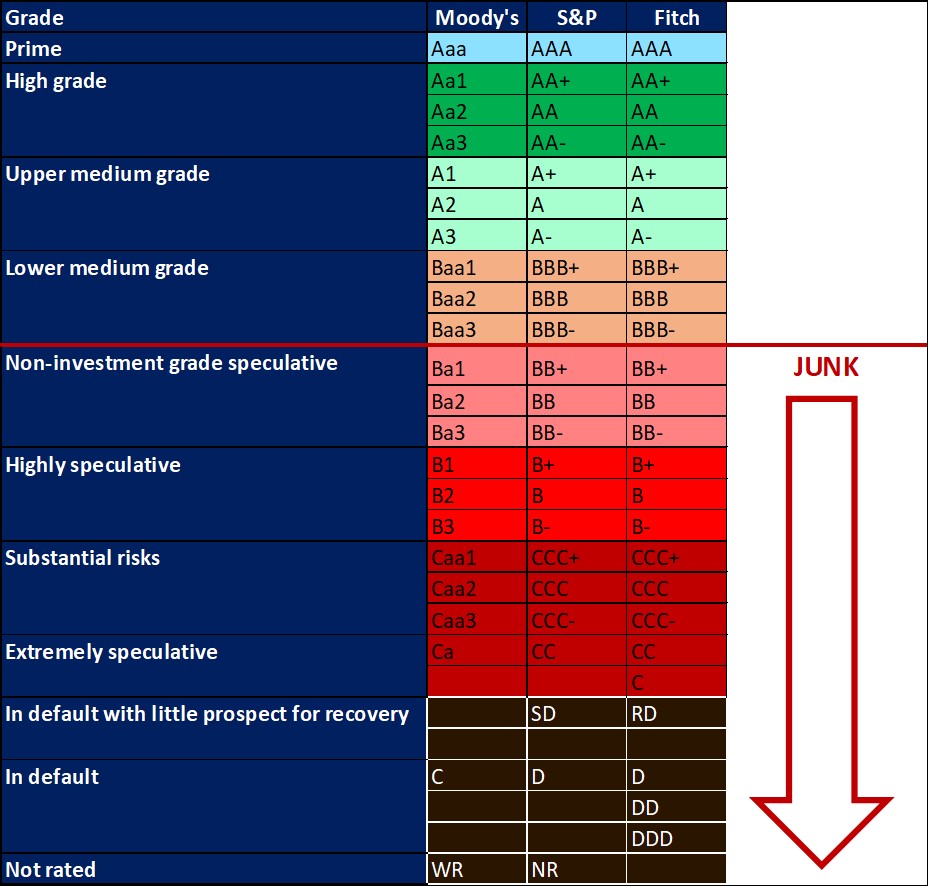
On 27 March 2020, Moody’s downgraded South Africa’s sovereign credit rating to sub-investment grade and placed a negative outlook on the rating. The key drivers for this downgrade include weak economic growth, continuing deterioration in fiscal strength, and slow progress on structural economic reforms. It is now the first time in post-apartheid South Africa where all major rating agencies, that is, Moody’s, Fitch and S&P, have South Africa’s credit ratings in sub-investment grade territory.
The COVID-19 pandemic forced the South African Reserve Bank to make a number of interest rate cuts to bring relief to the economy. Interest rate movement:
- 20 March 2020 – 8,75%
- 15 April 2020 – 7,75%
- 22 May 2020 – 7,25%
- 23 July 2020 – 7,00%
- 18 November 2021 – 7,25%
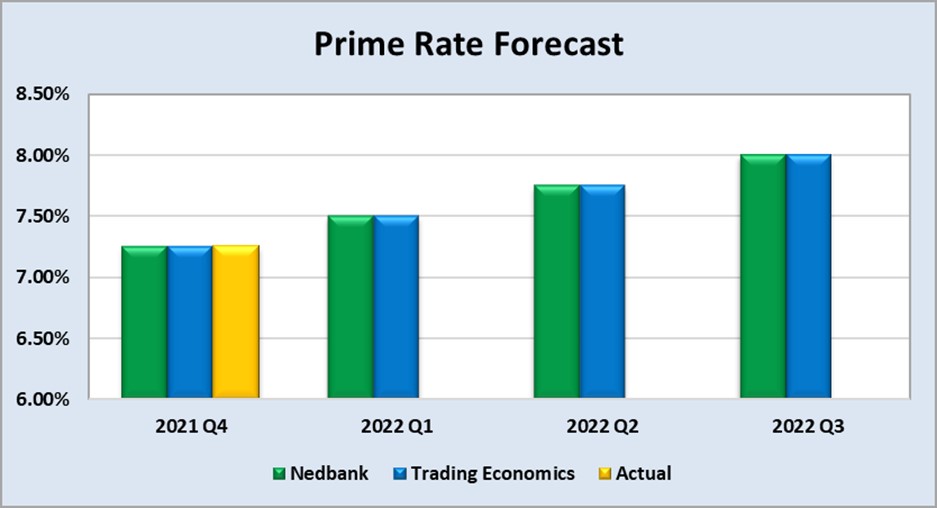
Graph 18 shows the prime rate forecast for 2021 Q4 to 2022 Q3. Nedbank as well as Trading Economics’ forecast that the prime interest rate will increase with 25 basis points for 2022 Q1. The next MPC meeting date is 27 January 2022.
Fraud risk
TIPS TO RECOGNISE FRAUD OR A SCAM
- It seems too good to be true – for example, a holiday that’s much cheaper than you’d expect.
- Someone you don’t know contacts you unexpectedly.
- You suspect you’re not dealing with a real company – for example, if there’s no postal address or free email address provider like @gmail.
- You’ve been asked to transfer money quickly.
- You’ve been asked to pay in an unusual way – for example, with Cryptocurrency and vouchers.
- You’ve been asked to give away personal information like passwords or PINs.
- You haven’t had written confirmation of what’s been agreed.
HOW TO PROTECT YOURSELF AGAINST FRAUD
- Do not open suspicious texts, pop-up windows or click on links or attachments in emails – delete them.
- Be careful about giving personal information away.
- Make your online accounts secure.
- Resist the pressure to act immediately.
- Choose your passwords carefully and update regularly.
- Beware of–make sure to not connect with–fake people/accounts.


