
The NWK Limited external factors report provides an overview of the main external factors that NWK and its clients are exposed to at a specific point in time. This report opts to aid in a timely basis to foresee external market and other factors that may have an impact on any business and clients. The main focus of this document is to have a closer look at external factors that can affect any business and our customers.
Executive summary
The inflation rate remained unchanged at 5,2% in May 2024. Retail trade increased with 0,6% in April compared to a year-to-year basis. The unemployment rate increased slightly to 32,9% in the first quarter of 2024. The GDP growth for the first quarter contracted with -0,1%, down from a 0,1% increase in the previous quarter. The Policy Uncertainty Index moved further into negative territory from 65,5 to 65,8 points in Q1.
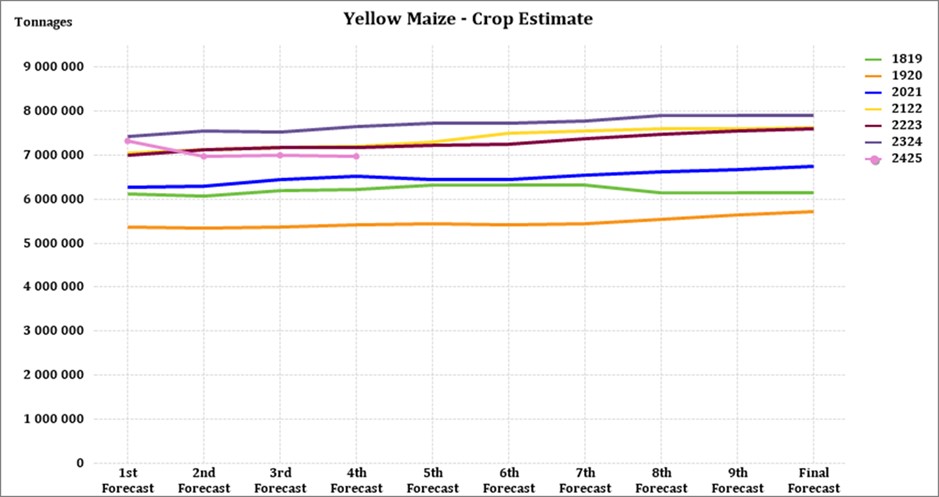
The National Agricultural Marketing Council (NAMC) projected the ending stock for 30 April 2025 of white and yellow maize to be less than the 2023/24 season. According to the Crop Estimation Committee’s fourth-maize forecast the three main maize producing areas, namely the Free State, Mpumalanga and North West provinces are expected to produce 79% of the 2024 crop.
During the previous Monetary Policy Committee (MPC) meeting held on 30 May the committee once again decided that interest rates will remain unchanged. The repo rate is currently 8,25% and the prime rate 11,75%.
Load shedding poses long term risks for the agricultural sector on a supply and input cost level. Cost-effective and sustainable alternative solutions must be considered in order to reduce the dependency on Eskom for electricity. With fuel prices sky rocketing and producers being more and more reliant on generators for electricity this is a disaster.
Business climate: Key risk drivers
A few highlights regarding certain risk drivers are mentioned below.
According to Trading Economics South Africa’s annual inflation rate stood at a four-month low of 5,2% in May, unchanged from April. it remains above the preferred target of 4,5% of the central bank.
Brent crude oil monthly average prices decreased by $8,19 per barrel from Arpil to May. South Africa’s retail trade decreased with 0,6% in April compared to the same month a year earlier. According to Statistics SA, South Africa’s unemployment rate rose slightly to 32,9%.
The GDP growth rate contracted by -0,1% on quarter in the fourth quarter in 2024. Six of the ten industries experienced declines. Agriculture was the main positive contributor with a growth increase of 13,5%.
The maize Safex price increased week-on-week with 3,3% on May 28. The white maize monthly average Safex price for May was profitable at R4 985 per ton. Maize prices have decreased and are expected to continue trading around R5 000 per ton mark for white maize and R4 000 per ton mark for yellow maize. Analysts expect that the adverse weather effects on this season’s maize crop have been fully priced in and local supply is expected to meet local demand.
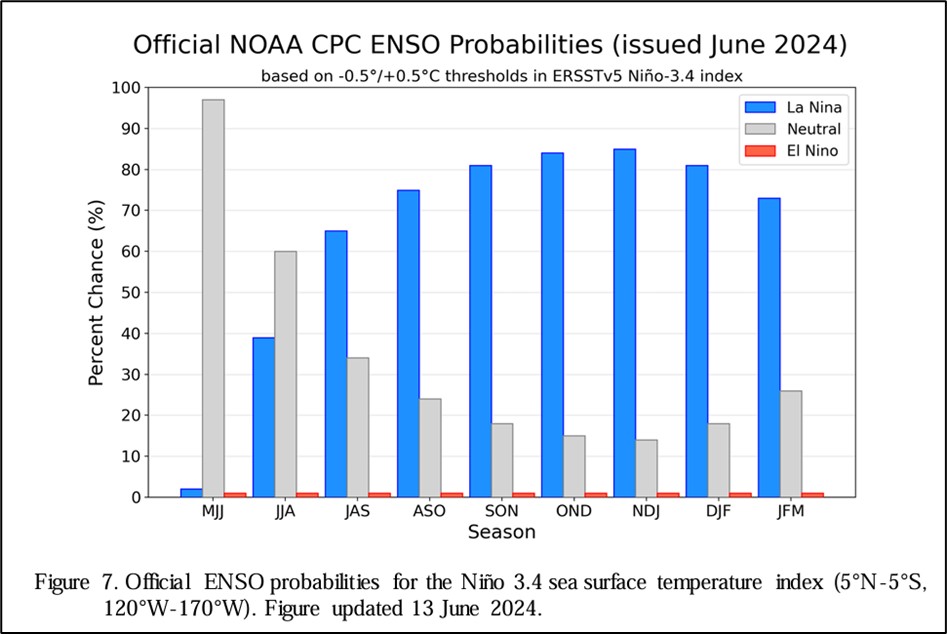
Adverse weather patterns can reduce yields and also affect the Safex price (high regional demand poses an upside price risk). The El Niño–Southern Oscillation (ENSO) is currently in a neutral phase at 97% for May to July (MJJ). The Burea’s ENSO Outlook is at La Niña Watch due to early signs that an event may form in the Pacific Ocean later in 2024. From July 2023 to May 2024 the actual sunspot numbers were higher than the predicted values.
The iron ore price saw an increase of $11,53 per metric ton from April to May. Prices for iron ore cargoes with a 62% iron ore content were at the $107 per tonne mark in June, holding near the lowest level since April as a batch of economic data added to pessimism on ferrous metal demand from China.
The Policy Uncertainty Index (PUI) moved further into negative territory from 65,5 to 65,8 points in Q1. In addition to the well-known global risks and uncertainties the 2024 election outcome is also weighing on investors and the markets. The PUI is the net outcome of positive and negative factors influencing the calibration of policy uncertainty over the relevant period. It is seen to have important implications for business confidence and the investment climate in the country.
Sources
https://tradingeconomics.com/south-africa/inflation-cpi
https://tradingeconomics.com/commodity/brent-crude-oil
https://tradingeconomics.com/south-africa/unemployment-rate
https://www.agbiz.co.za/content/open/21-august-2023-agri-market-viewpoint-747
https://tradingeconomics.com/south-africa/gdp growth#:~:text=South%20Africa%20GDP%20Grows%201.2,expectations%20of%20a%200.7%25%20growth
https://www.statssa.gov.za/?page_id=737&id=1
https://tradingeconomics.com/commodity/iron-ore
https://openknowledge.worldbank.org/server/api/core/bitstreams/27189ca2-d947-4ca2-8e3f-a36b3b5bf4ba/content
PUI_2024Q1.pdf
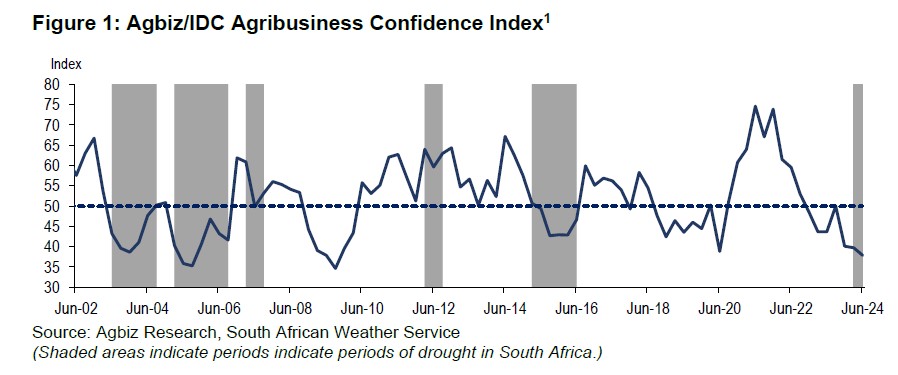
Agbiz/IDC ACI at its lowest level since Q3, 2009
The Agricultural Business Chamber (Agbiz) quarterly conducts a survey in order to create an Agribusiness Confidence Index (ACI). The Agbiz/IDC ACI, which was released on 25 March 2024, reflects the perceptions of at least 25 agribusiness decision-makers on the ten most important aspects influencing a business in the agricultural sector.
These ten aspects are:
- turnover;
- net operating income;
- market share;
- employment;
- capital investment;
- export volumes;
- economic growth;
- general agricultural conditions;
- debtor provision for bad debt; and
- financing cost.
The Agbiz/IDC Agribusiness Confidence Index (ACI) remained depressed in Q2 2024, reaching 38 points from 40 in the previous quarter. This is the lowest level since Q3 2009, which was the global financial crisis, and implies that agribusinesses remain downbeat about business conditions in the country.
The mid-summer El Niño induced drought’s impact on summer grains and oilseed production is one of the major factors that weighed on the sentiment. The drought coincided with the long-standing challenges of inadequate road infrastructure and municipal service delivery. The lingering animal disease challenges and heightened geopolitical tensions are also the primary concerns for the sector.
Moreover, while the farming community recognises the improvements in Transnet’s operations, they highlight the need for continuous work to address the inefficiencies of the ports and rail network. The uncertainty about the formation of the government at the time of the survey may have added to the downbeat mood amongst the agribusinesses. This survey was conducted between June 10 and 19, covering businesses operating in all agricultural subsectors across South Africa.
The graph below shows the Agribusiness Index from 2002 up to January 2024.
Discussion of the subindices
The ACI is comprised of ten subindices; five declined in Q2 of 2024, while the rest showed mild improvement. Here is the detailed view of the subindices.
The turnover subindex was 22 points from Q1 2024 to 31, the lowest level since Q2 2020. Similarly to the previous month, the deterioration in sentiment reflects the expectations of poor summer grains and oilseed harvest in an environment where the input costs remain relatively elevated compared to pre-COVID-19 levels. This illustrates not only the pressures in the summer crop regions but also the respondents in the livestock industry, who are also challenged by the relatively higher input costs. In the same line as the turnover subindex, the net operating income subindex fell by 13 points from Q1 2024 to 35, reflecting the impact of the mid-summer drought on the farming business’ income.
The employment subindex fell by 12 points from Q1 2024 to 38. This was a surprise given while the production conditions have been tough for some commodities, the employment conditions held up in the first quarter of the year, supported by robust horticulture production and resilience in some regions. For example, the data released by Statistics South Africa in May showed that employment in primary agriculture lifted by 6% year-on-year to 941 000 in the first quarter of 2024. This change in sentiment suggests that the drought’s impact on jobs may perhaps start to reflect on Q2 jobs data.
The capital investments subindex was down by 4 points from Q1 2024 to 46. This is unsurprising as the tractor and combine harvester sales have generally declined since the start of the year.
Mild improvements
The market share of the agribusiness subindex is up 6 points from Q1 2024 to 65 in Q2. Except for the respondents in the inputs, winter crops and some financial services businesses, which showed an improvement, most held a generally unchanged view.
The general economic conditions subindex recovered by 9 points to 38 in Q2 2024, still far from the neutral point mark of 50. This slight recovery in the mood about the economic conditions could be linked with expectations of a reduction in load-shedding this year, and it is broadly consistent with improvements in various market analysts’ GDP forecasts.
After a sharp fall at the start of the year, the general agricultural conditions subindex recovered by 28 points to 46 in Q2 2024. These sentiment results mirror an end of the intense El Niño cycle and a transition to the expected La Niña later this year and into the 2024/2025 summer season. This would bring much-needed rains for summer crops. Moreover, the winter crop season, which is currently underway, is experiencing favourable production conditions, and the respondents highlighted this view.
The subindices of the debtor provision for bad debt and financing costs are interpreted differently from the abovementioned indices. A decline is viewed as a favourable development, while an increase signals growing financial strain. In Q2 2024, the debtor provision for bad debt was up by 3 points to 31, which is an unfavourable development and shows prospects of harsh financial conditions in some farming businesses, possibly those in summer grains. Meanwhile, the financing costs indices declined by 4 points to 23, signalling that agricultural firms perhaps believe the interest rate would soon start to decline. This is important in a sector with just over R205 billion in farm debt.
Concluding remarks
There remains some pessimism in the sector, although some subsectors have had an impressive start to the year. This stems from the overriding impact of the mid-summer drought, combined with the long-standing inefficiencies in the network industries.
“While the farming sector may have worried about the political outlook at the time of the survey, the reaction to the newly formed Government of National Unity has been widely positive, and the financial markets reaction reflects that optimism,” concludes Wandile Sihlobo, chief economist of the Agricultural Business Chamber of SA (Agbiz).”Still, with the elections ahead of us, it is unclear if there will be a serious focus on policy matters in the months ahead”, added Sihlobo.
Source: www.agbiz.co.za, Issued by: Wandile Sihlobo, Chief Economist (Agbiz) March 2024.
ISSUED BY:
Wandile Sihlobo
Chief Economist, Agricultural Business Chamber of South Africa (Agbiz)
E-mail: wandile@agbiz.co.za
Fact of the month
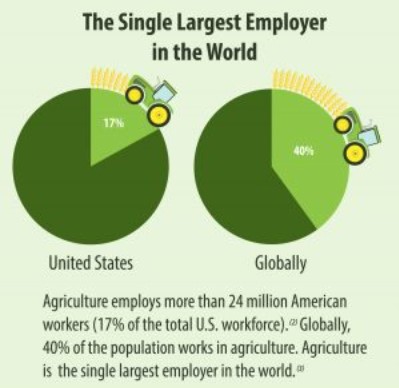
Agriculture is the single largest employer in the world. In fact, the Food and Agriculture Organisation of the United States reports that “there is a largely untapped reservoir of farm and non-farm employment opportunities in agriculture and beyond.” Examples include jobs in sustainable ag, agri-business development and related support services.
Weather and climate
NATIONAL ASSESSMENT
The El Niño-Southern Oscillation (ENSO) is currently in a neutral phase at 97% for May to July (MJJ). The Burea’s ENSO Outlook is at La Niña Watch due to early signs that an event may form in the Pacific Ocean later in 2024.
A La Niña Watch does not guarantee La Niña development, only that there is about an equal chance of either neutral ENSO conditions or a La Niña developing in the same outlook period. When La Niña Watch criteria have been met in the past, a La Niña event has subsequently developed around 50% of the time. The chance of a La Niña developing from July to September (JAS) is 65%. The current sea surface temperatures (SSTs) for July to November range from -0,1°C to -0,6°C.

The graph below reflects the current neutral conditions and the ocean temperatures that are starting to get cooler near the equator. More rain can possibly be expected later during the year as temperatures start to subside.
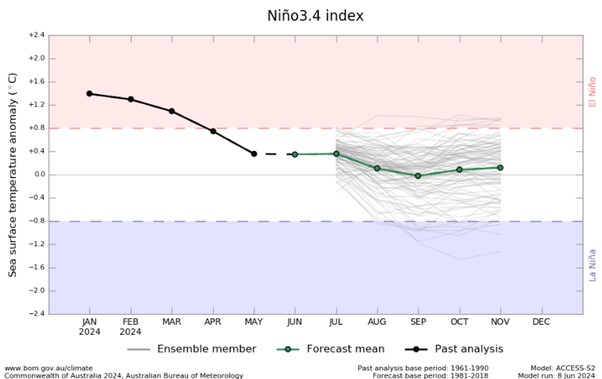
Source: Australian Government – Bureau of Meteorology
The latest Climate Watch issued by the SA Weather Service (31 May 2024) predicts below-normal rainfall for most parts of the country during the winter season. Below-normal rainfall during the winter months over the summer rainfall regions is not likely to be significant.
However, the south-western part, which normally receives significant rainfall during the winter season, is expected to receive mostly below-normal rainfall during this period. Below-normal rainfall conditions in these areas are expected to have a significant impact on crop and livestock production. Therefore, the relevant decision-makers are encouraged to advise producers in these regions to practice soil and water conservation, proper water harvesting and storage, and other appropriate farming practices.
Source: chrome-extension://efaidnbmnnnibpcajpcglclefindmkaj/https://www.weathersa.co.za/Documents/SeasonalForecast/SCOLF202405_01062024073426.pdf
SUNSPOTS
Sunspots are darker, cooler areas on the surface of the sun that arise due to disturbances in the sun’s magnetic field. Every 11 years, the number of spots dotting the surface of the sun increases and decreases and forms the solar cycle.
Sources
https://www.sciencedirect.com/science/article/abs/pii/S136468262200116X#:~:text=It%20was%20observed%20that%20rainfall,an%20increasing%20effect%20on%20rainfall
https://www.space.com/solar-cycle-frequency-prediction-facts May 27,2022.
https://eos.org/articles/why-did-sunspots-disappear-for-70-years-nearby-star-holds-clues 10 June, 2022.
According to science direct the rainfall rate is directly related to the sunspot number but shows different characteristics during solar maximum years. Though a lag correlation exists between sunspot number and rainfall, sunspots have an increasing effect on rainfall. Studies show that the more sunspots are present the higher the rainfall and the less sunspots the lower the rainfall.
ENSO occurs at irregular interval between three and seven years causing global climate system variation. Considering this event occurs periodically, it might be triggered by the eleven years of solar cycle as an energy source.
The graph below shows the eleven year solar cycles since before the 2000s. As the graph is in an upward trajectile higher rainfall can be expected – La Niña. As the graph reaches its turning point and moves in a downward trajectile less rainfall is expected characteristic of an El Niño.
The last three years were La Niña years and as the graph is approaching its forecasted turning point in May 2024 an El Niño can be expected for the coming years. ENSO indicators are currently at neutral and a La Nina is expected to form later this year. From July 2023 to May 2024 the actual sunspot numbers were higher than the predicted values.
The conclusion can be made that the sunspots are not yet at their downward turning point. When the sunspots are in an increasing phase it means more rainfall and when in a decreasing phase it usually means less rainfall.
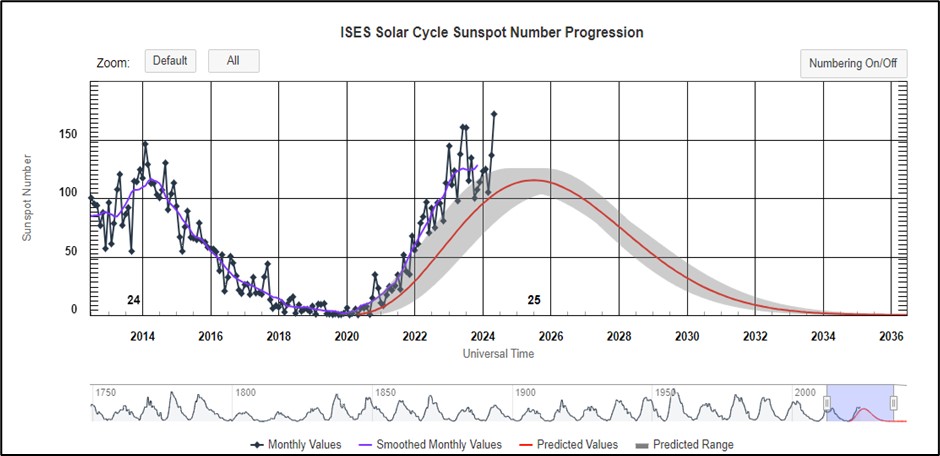
Source: https://www.spaceweatherlive.com/en/solar-activity/solar-cycle.html
Market risk
GRAIN MARKET ANALYSIS
• Ending stock – national
Ending stock data is gathered from the NAMC. The estimates are reassessed and reported by the Grain and Oilseeds Supply and Demand Estimates Committee. The following is the projected ending stock for April 2025 in tonnages for the 2024/2025 season:
- White maize => 681 971 t
- Yellow maize => 832 129 t
The following is a summary of September 2024 ending stock estimates for the 2023/2024 season:
- Wheat => 561 459 t
The following is a summary of the February 2025 projected final ending stock for the 2024/2025 season:
- Sunflower => 79 464 t
- Soybeans => 154 927 t
- Sorghum => 28 718 t
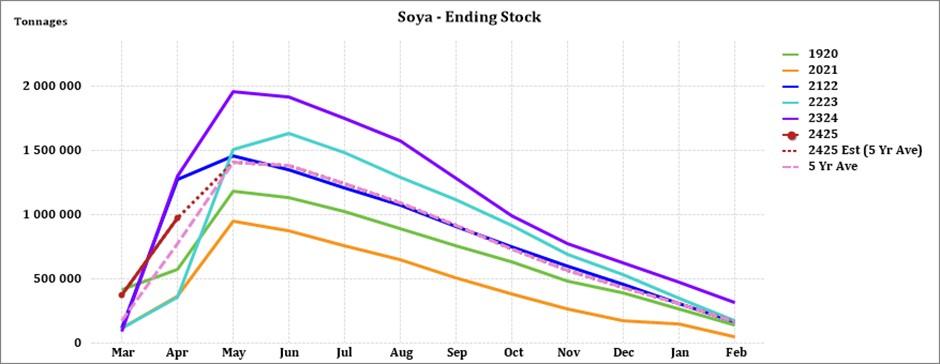
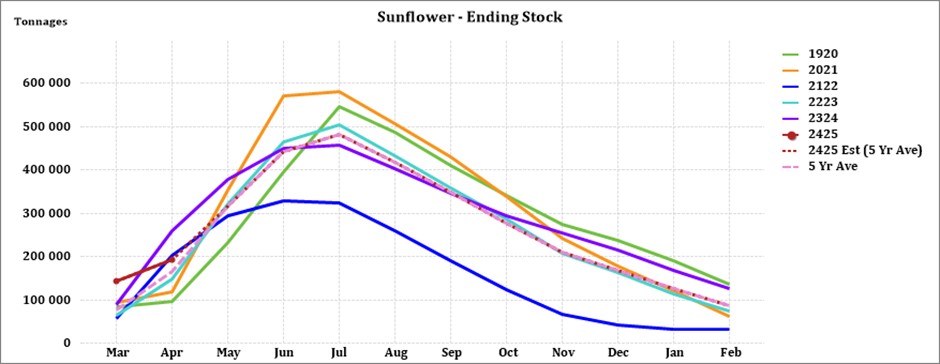
The graphs below show the predicted ending stock for the different commodities according to SAGIS data. A five-year average has been calculated to determine the estimated ending stock for the current season. The predicted white maize in April 2024, is 265 928 t more than the final for the 2022/2023 season. Yellow maize shows a 182 696 t decrease in ending stock compared to the previous season.
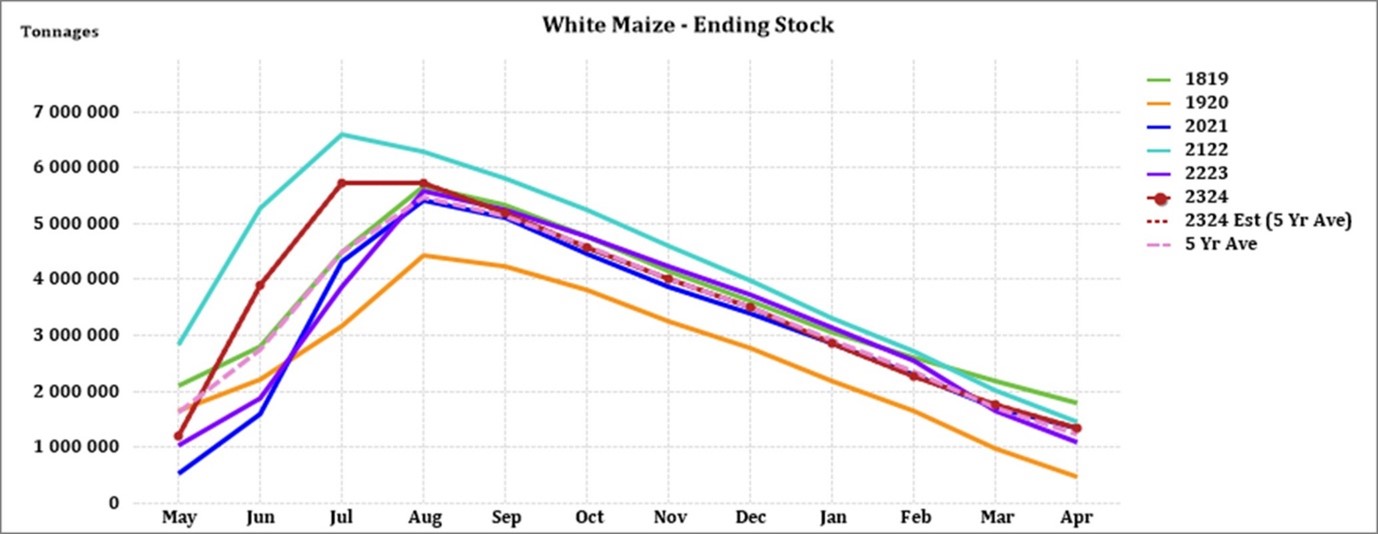
Source: Sagis
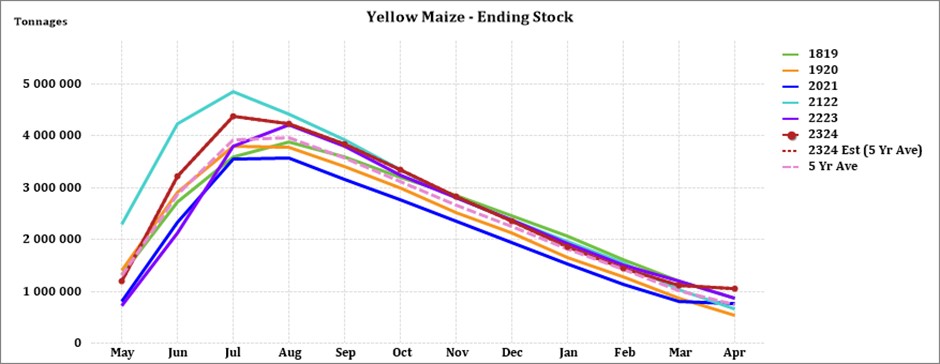
Source: Sagis
Source: Sagis
The predicted soybean ending stock for 2024/2025 is 151 551 t less than the previous season ending stock.
Source: Sagis
The predicted sunflower ending stock for the 2024/2025 season is 41 396 t less than the previous season ending stock.
Crop estimations
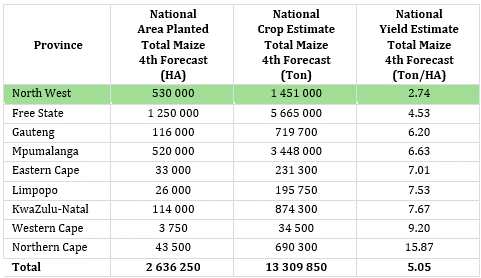
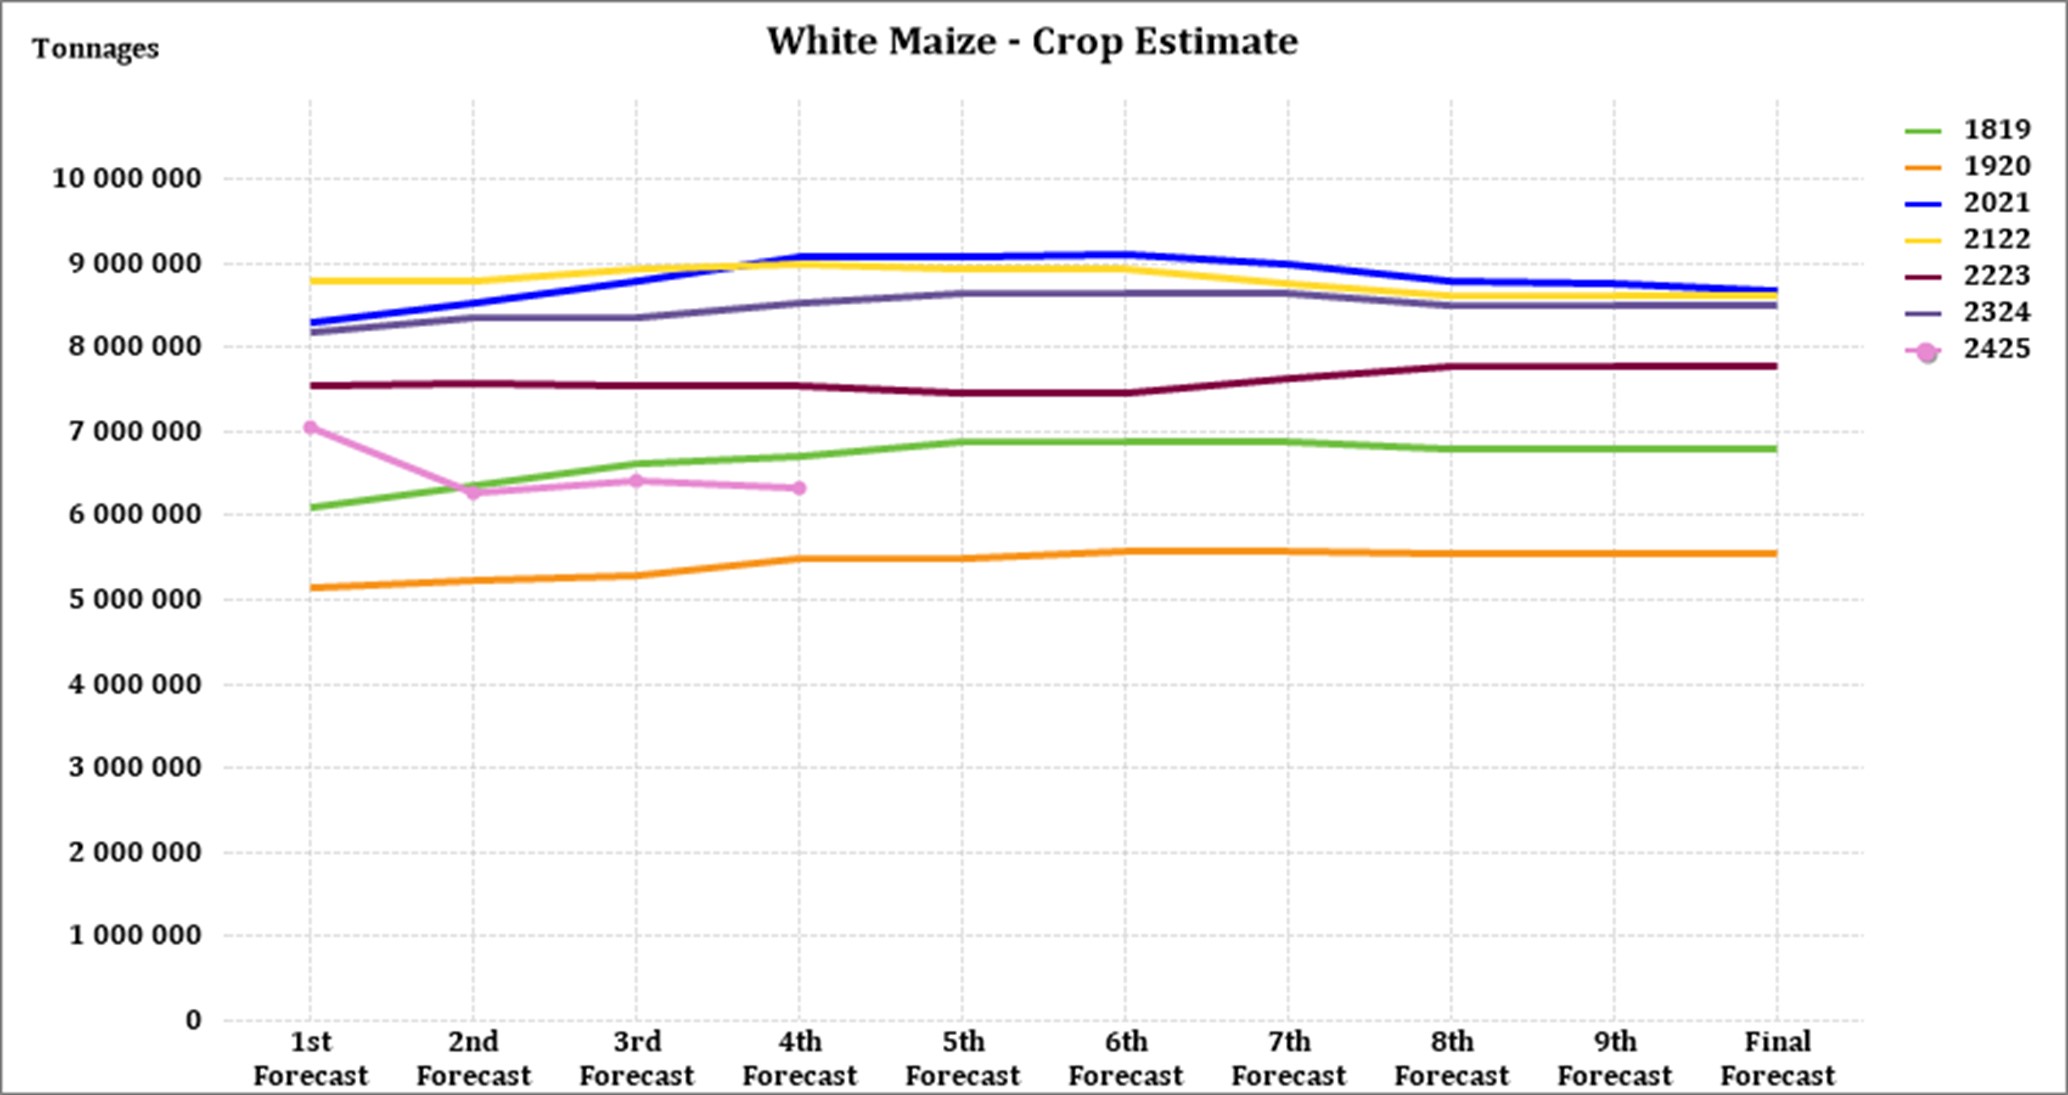
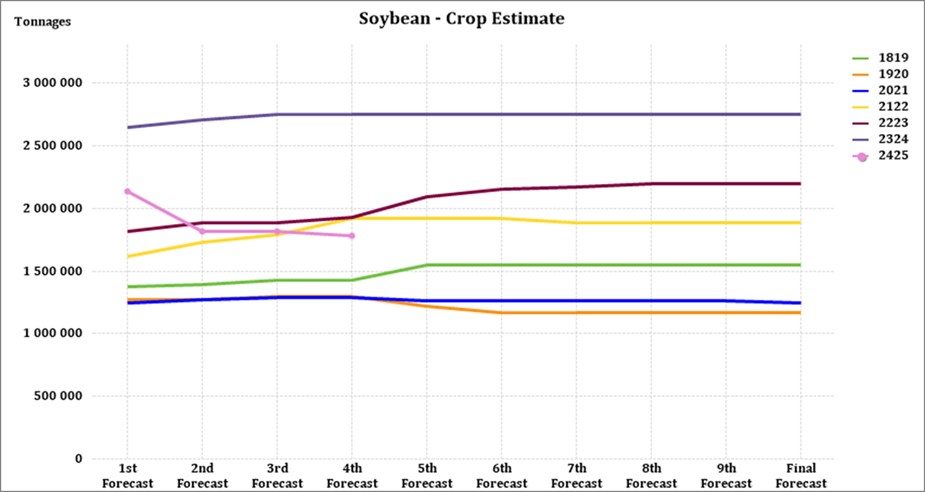
According to the Crop Estimate Committee (CEC) fourth production forecast for 2024, the area estimate for maize is 2,636 million ha, which is 1,9% less than the actual 2,586 million ha planted for the previous season.
Source: CEC (Crop Estimates Committee)
Source: CEC (Crop Estimates Committee)
Source: CEC (Crop Estimates Committee)
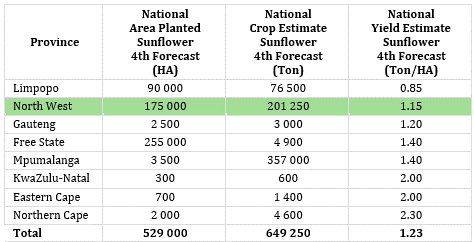
The production forecast for sunflower is revised upwards to 649 250 tons, but it is still 9,83% less than the previous forecast of 720 000 tons. The area estimate for sunflower seed is 529 000 ha while the expected yield is 1,23 t/ha.
Source: CEC (Crop Estimates Committee)
Source: CEC (Crop Estimates Committee)
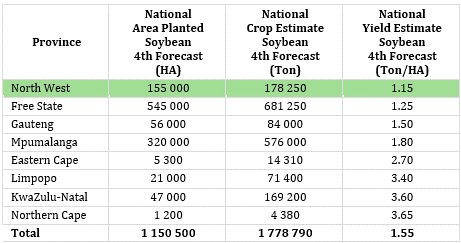
The production forecast for soybeans decreased by 15,22% to 1,814 mills. tons. The estimated area planted to soybeans was revised to 1,151 mills. ha (from 1,122 mill. ha the previous month’s estimate), with an expected yield of 1,58 t/ha.
Source: CEC (Crop Estimates Committee)
Source: CEC (Crop Estimates Committee)
• Imports and exports – national
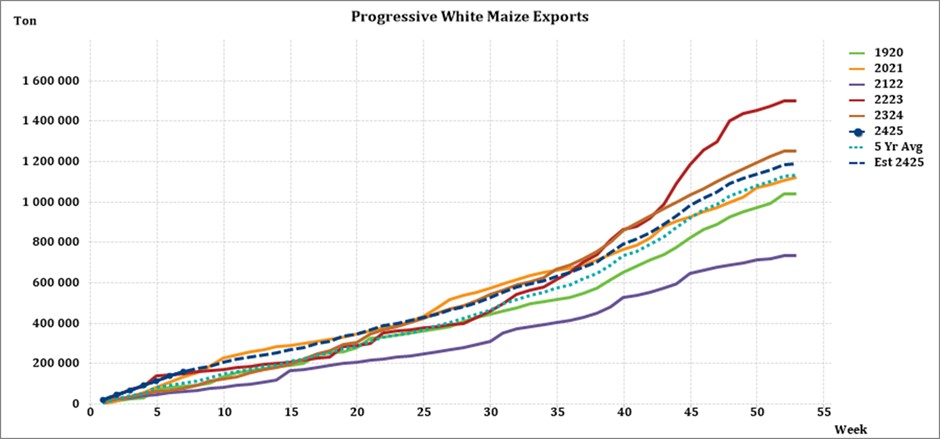
For the production season ending April 2025, 139 722 t of white maize and 77 597 t of yellow maize have been exported to date (week 6 of 52) as seen in the graphs below.
Source: Sagis
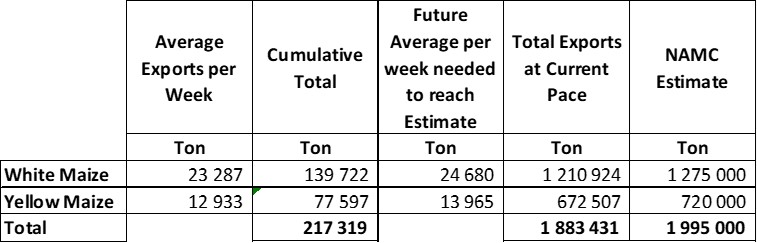
As seen in the table above, the average white maize exports per week are currently 23 287 t. If theoretically, white maize exports remain at the current average per week then there would be 64 076 t less white maize exports than anticipated.
The average yellow maize exports per week are currently 12 933 t. If theoretically, yellow maize exports remain at the current average per week then there would be 47 493 t less yellow maize exports than anticipated.
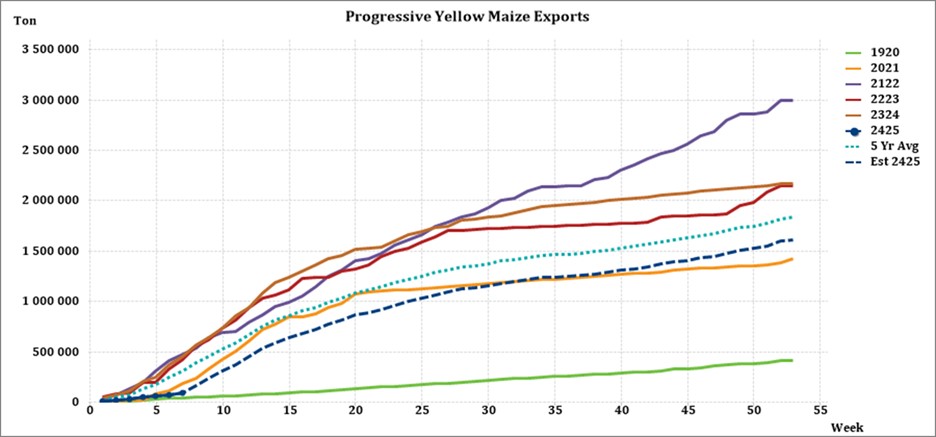
Source: Sagis
• Parity prices
South Africa is a small producer compared to other countries and is thus a price taker (meaning that we cannot influence world prices). Because of this, our local prices are normally between import and export parity, which is illustrated in the figure below. An import parity price is defined as the price which a buyer will pay to buy the product on the world market. This price will include all the costs incurred to get the product delivered to the buyer’s destination.
An export parity price is defined as the price that a local seller could receive by selling his product on the world market e.g., excluding the export costs. The price which the seller obtains is based on the condition that he delivers the product at the nearest export point (usually a harbour) at his own expense.
The graph below reflects the Safex price, import parity and export parity of yellow maize as well as the Safex price of white maize. The import and export parity prices for white maize is not released by Grain SA for this period.
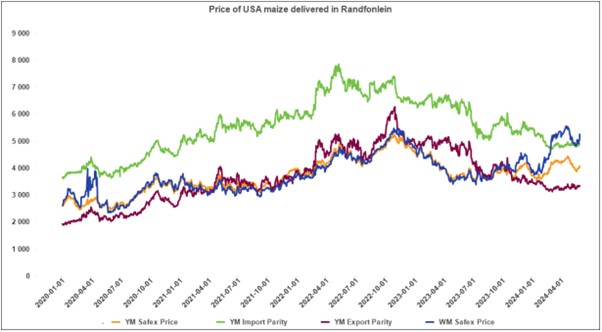
Source: Grain SA
• Grain processing per province
For the marketing year which is May to April (2023/2024), the Free State province dominates the white maize that is used for human consumption and gristing. North West consumed the second most white maize produced for human consumption for the three months November 2023 to January 2024.
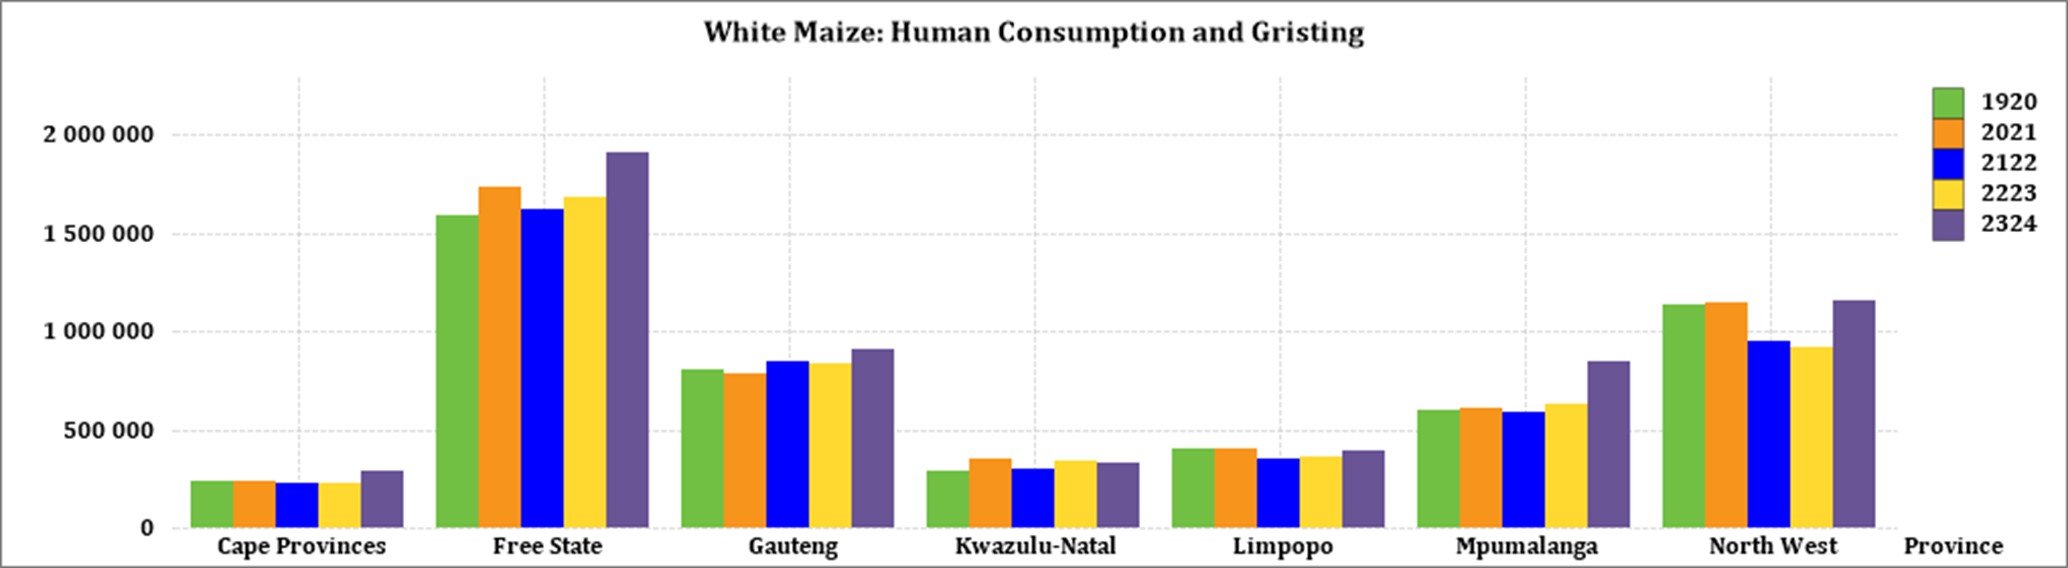
Source: Sagis
The Cape Province used the most white maize for animal feed and industrial usage with North West using the second most.
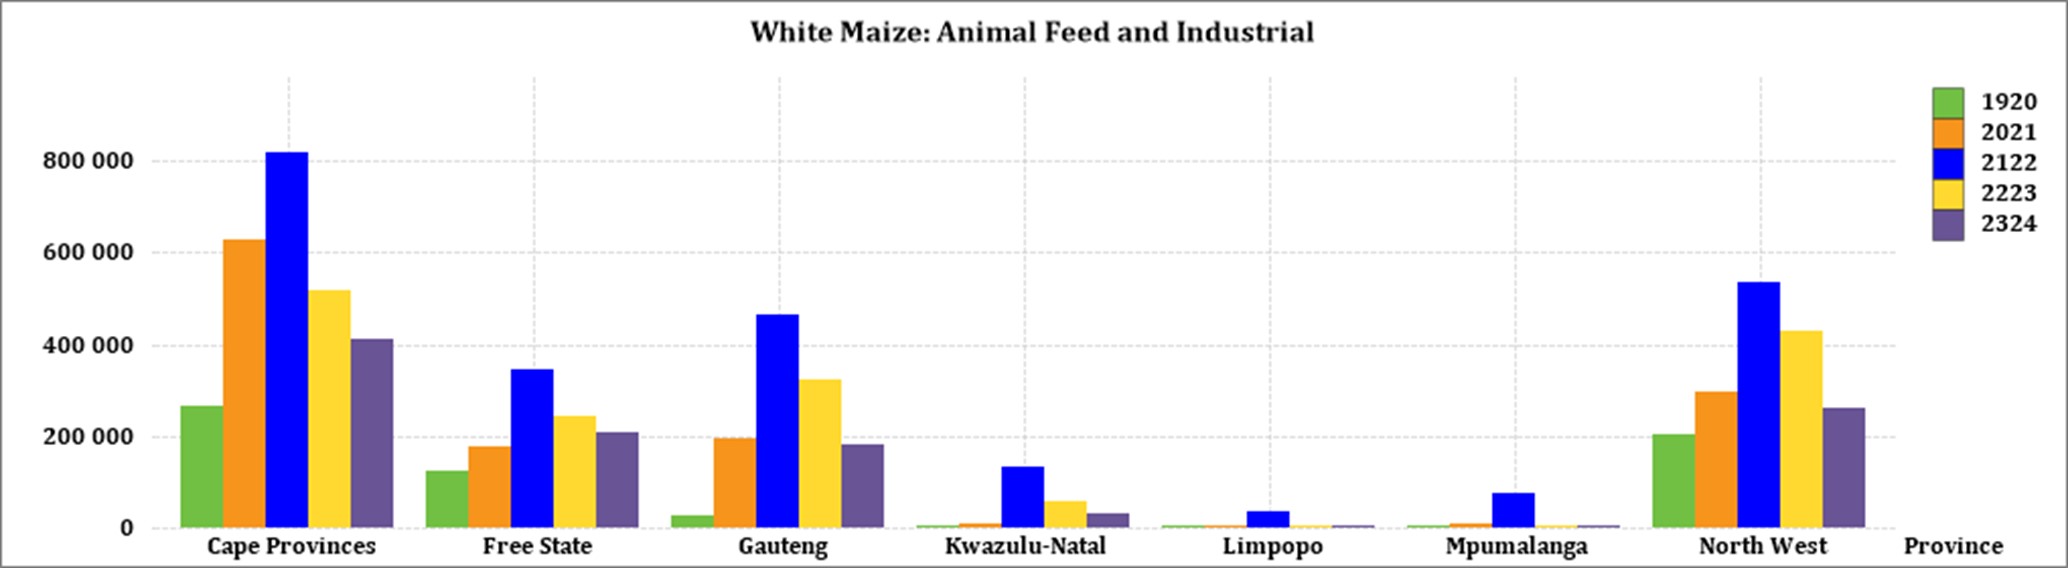
Source: Sagis
Mpumalanga processed the most yellow maize for consumption and gristing and Gauteng processed the most yellow maize for animal feed and industrial purposes.
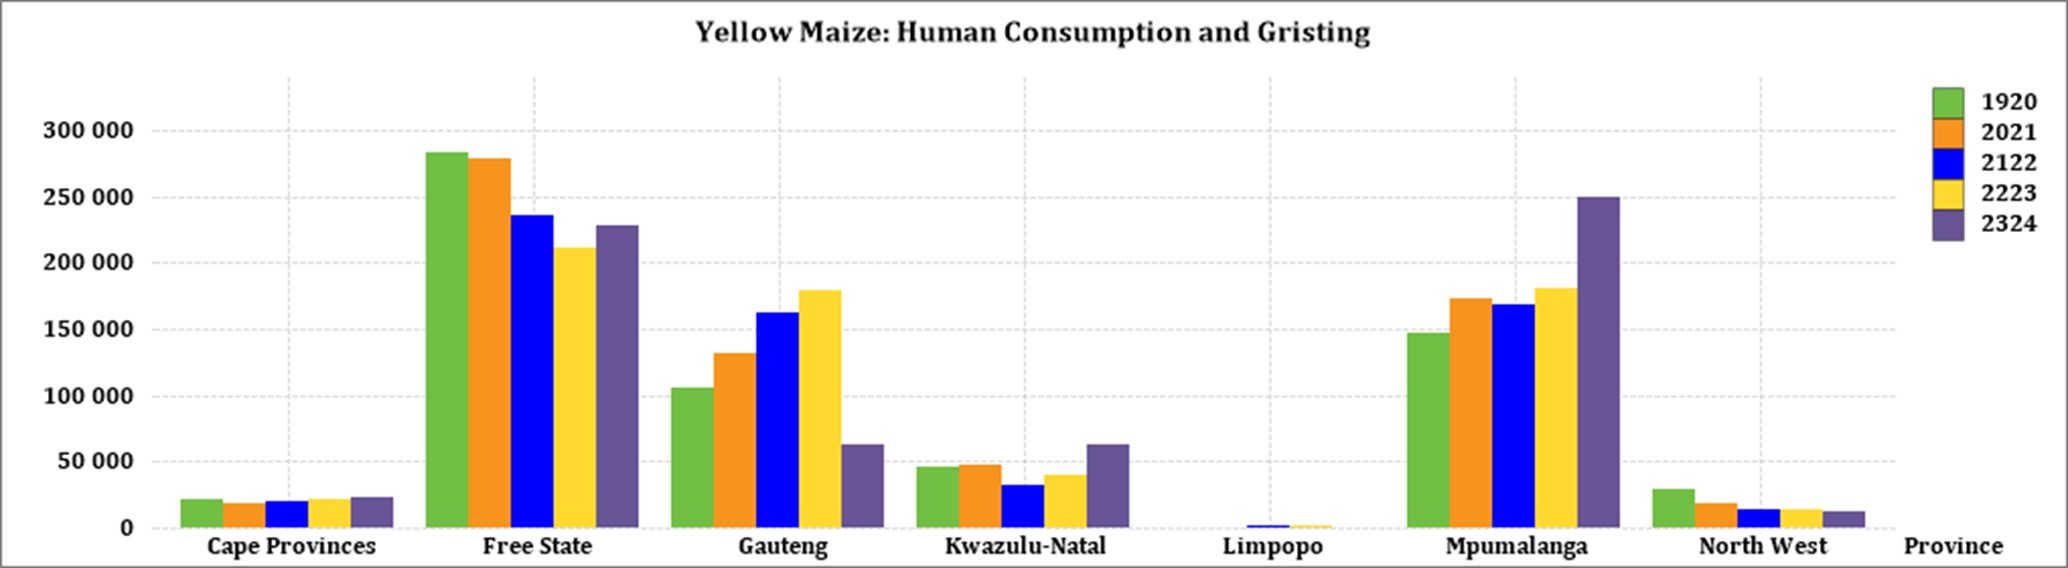
Source: Sagis
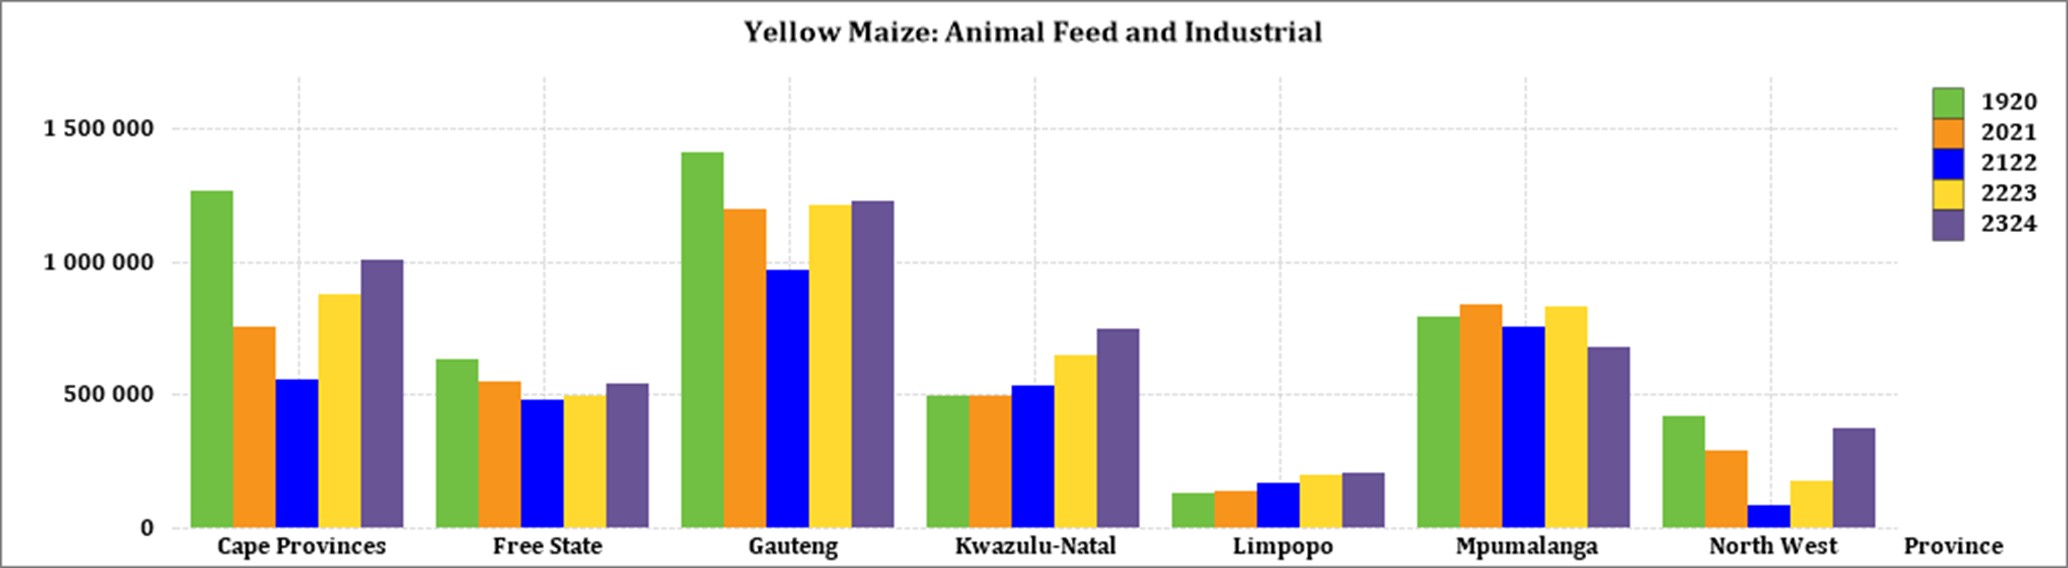
Source: Sagis
• Exchange rate
NWK Group is exposed to foreign exchange rate risk on various business areas, such as commodity prices and trade imports.
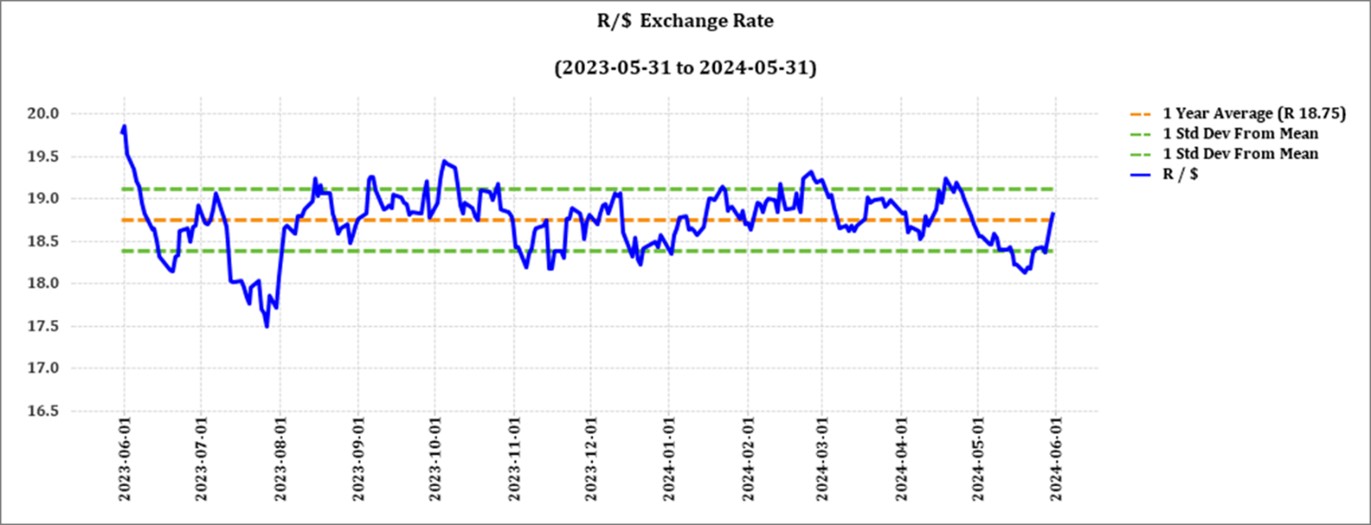
Source: Standard Bank, Corporate and Investment Banking & SARB
On average for May, the South African rand traded at 18,42 per USD, the strongest since July 2023. Losses to trade slightly higher around 18,7 per USD on 3 June was reversed, after four consecutive sessions of decline, as traders weighed prospects of a business-friendly coalition forming after dismal results for the ruling party ANC.
The currency remains supported by expectations of higher-for-longer interest rates. The South African Reserve Bank kept interest rates on hold at 8,25% in its third meeting of the year, as widely anticipated, maintaining its stance in the fight against sticky inflation.
Exchange rate forecast:
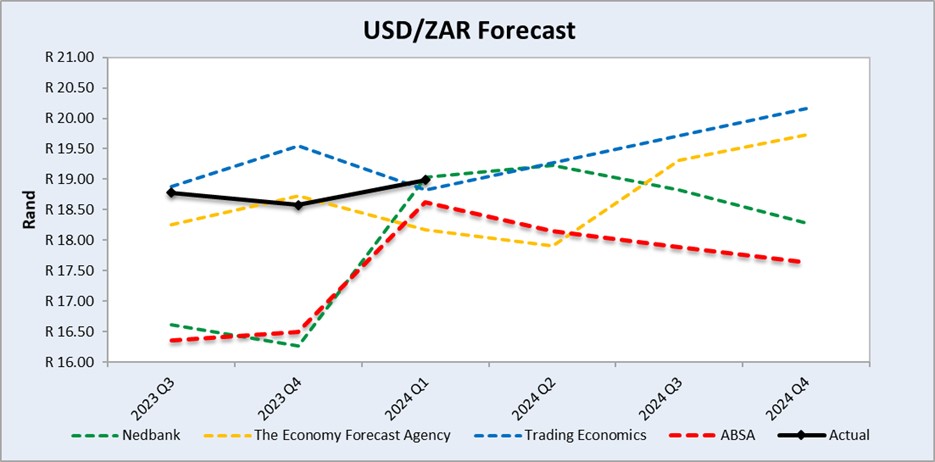
Source: Nedbank CIB; Absa; The Economic Forecast Agency; Trading Economics
The graph above shows the actual USD/ZAR for 2023 Quarter 3 (Q3) to 2024 Quarter 4 (Q4) against the forecasted figures.
• Interest rate risk
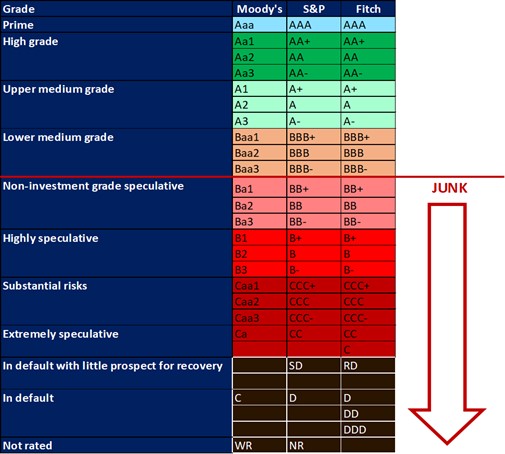
On 27 March 2020, Moody’s downgraded South Africa’s sovereign credit rating to sub-investment grade and placed a negative outlook on the rating. The key drivers for this downgrade include weak economic growth, continuous deterioration in fiscal strength, and slow progress on structural economic reforms. It is now the first time in post-apartheid South Africa that all major rating agencies, i.e., Moody’s, Fitch, and S&P, have South Africa’s credit ratings in sub-investment grade territory. More than a year later and our Moody’s rating remains the same.
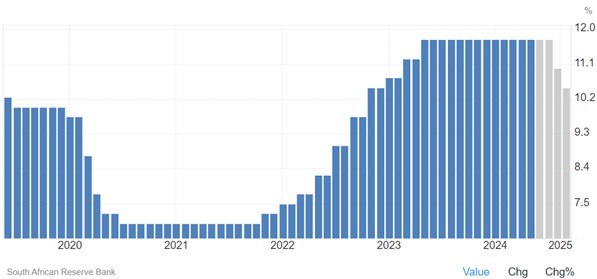
During the previous Monetary Policy Committee (MPC) meeting held on 30 May the committee decided that interest rates will remain unchanged. The repo rate is currently 8,25% and the prime rate is 11,75%. The South African Reserve Bank made several interest rates cuts to bring relief to the economy after Covid-19, but since November 2021 borrowing costs rose again by a cumulative 475 bps.
Interest rate movement:
- 22 September 2022: 9,75%
- 24 November 2022: 10,50%
- 26 January 2023: 10,75%
- 30 March 2023: 11,25%
- 25 May 2023: 11,75%
- 20 July 2023: 11,75%
- 21 September 2023: 11,75%
- 23 November: 11,75%
- 27 March 2024: 11,75%
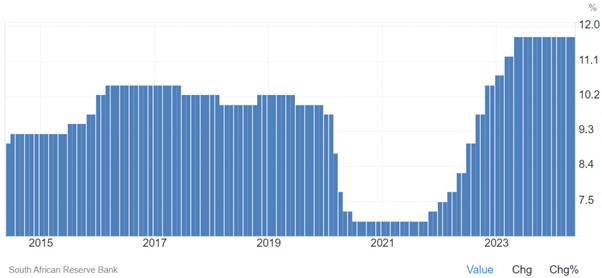
Lending Rate in South Africa remained unchanged at 11,75% in May. Lending Rate in South Africa averaged 11,43% from 1950 until 2024, reaching an all-time high of 25,5% in August of 1998 and a record low of 5% in February of 1950.
Source: South African Reserve Bank
Lending Rate in South Africa is expected to be 11,75% by the end of this quarter, according to Trading Economics global macro models and analysts’ expectations. In the long-term, the South Africa Lending Rate is projected to trend around 10,50% in 2025 and 9,50% in 2026, according to the econometric models.
Source: Trading economics
The following graph shows the prime rate forecast for 2024 Quarter 2 to 2025 Quarter 1.
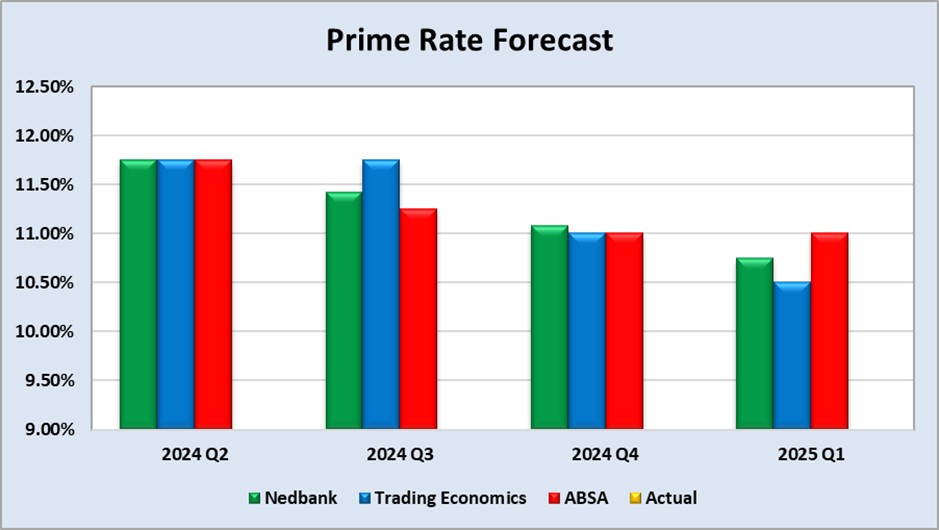
Source: Nedbank CIB; Trading Economics; Absa
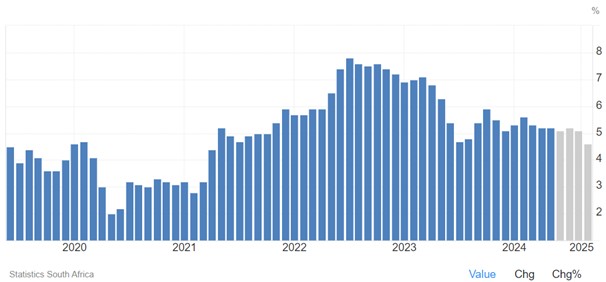
Inflation rate
As the inflation rate is a driver for increases and decreases in interest rates the current rate and forecast have to be assessed to foresee further increases in the interest rate.
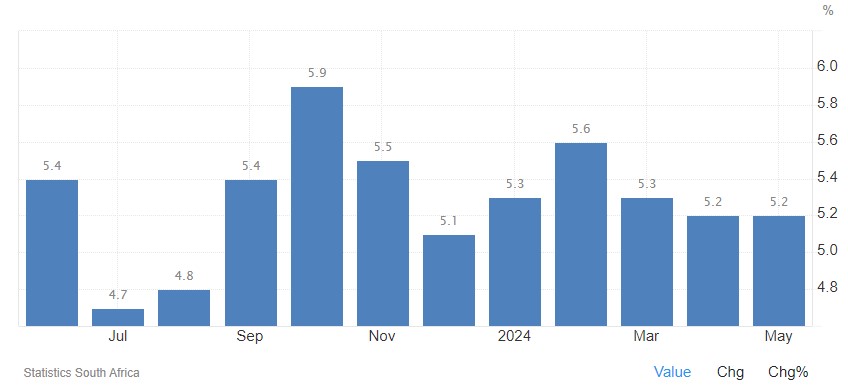
Current: South Africa’s annual inflation rate stood at a four-month low of 5,2% in May 2024, unchanged from April and in line with market forecasts. Still, it remains above the central bank’s preferred target of 4,5%. The rates for four of the twelve product groups remained steady between April and May, including food and non-alcoholic beverages (at 4,7%); housing and utilities (at 5,8%); education (at 6,3%) and household contents and services (at 1,8%).
Moreover, prices slowed down for restaurants and hotels (6,5% vs 7,5% in April) and miscellaneous goods and services (7,1% vs 7,2%) amongst others. Higher rates were recorded for transport, alcoholic beverages and tobacco and recreation and culture. The annual core inflation rate, excluding volatile items such as food and non-alcoholic beverages, fuels and energy, stood at a three-month low of 4,6% in May, the same as in April. Monthly, consumer prices rose by 0,2% in May, after a 0,3% increase in the previous month.
Source: Statistics South Africa
Source: Statistics South Africa
Source: Statistics South Africa
Inflation Rate in South Africa remained unchanged at 5,2% in May. Inflation Rate in South Africa is expected to be 5,1% by the end of this quarter, according to Trading Economics global macro models and analysts’ expectations. In the long-term, the South Africa Inflation Rate is projected to trend around 4,5% in 2025, according to our econometric models.
Source: https://tradingeconomics.com/south-africa/inflation-cpi
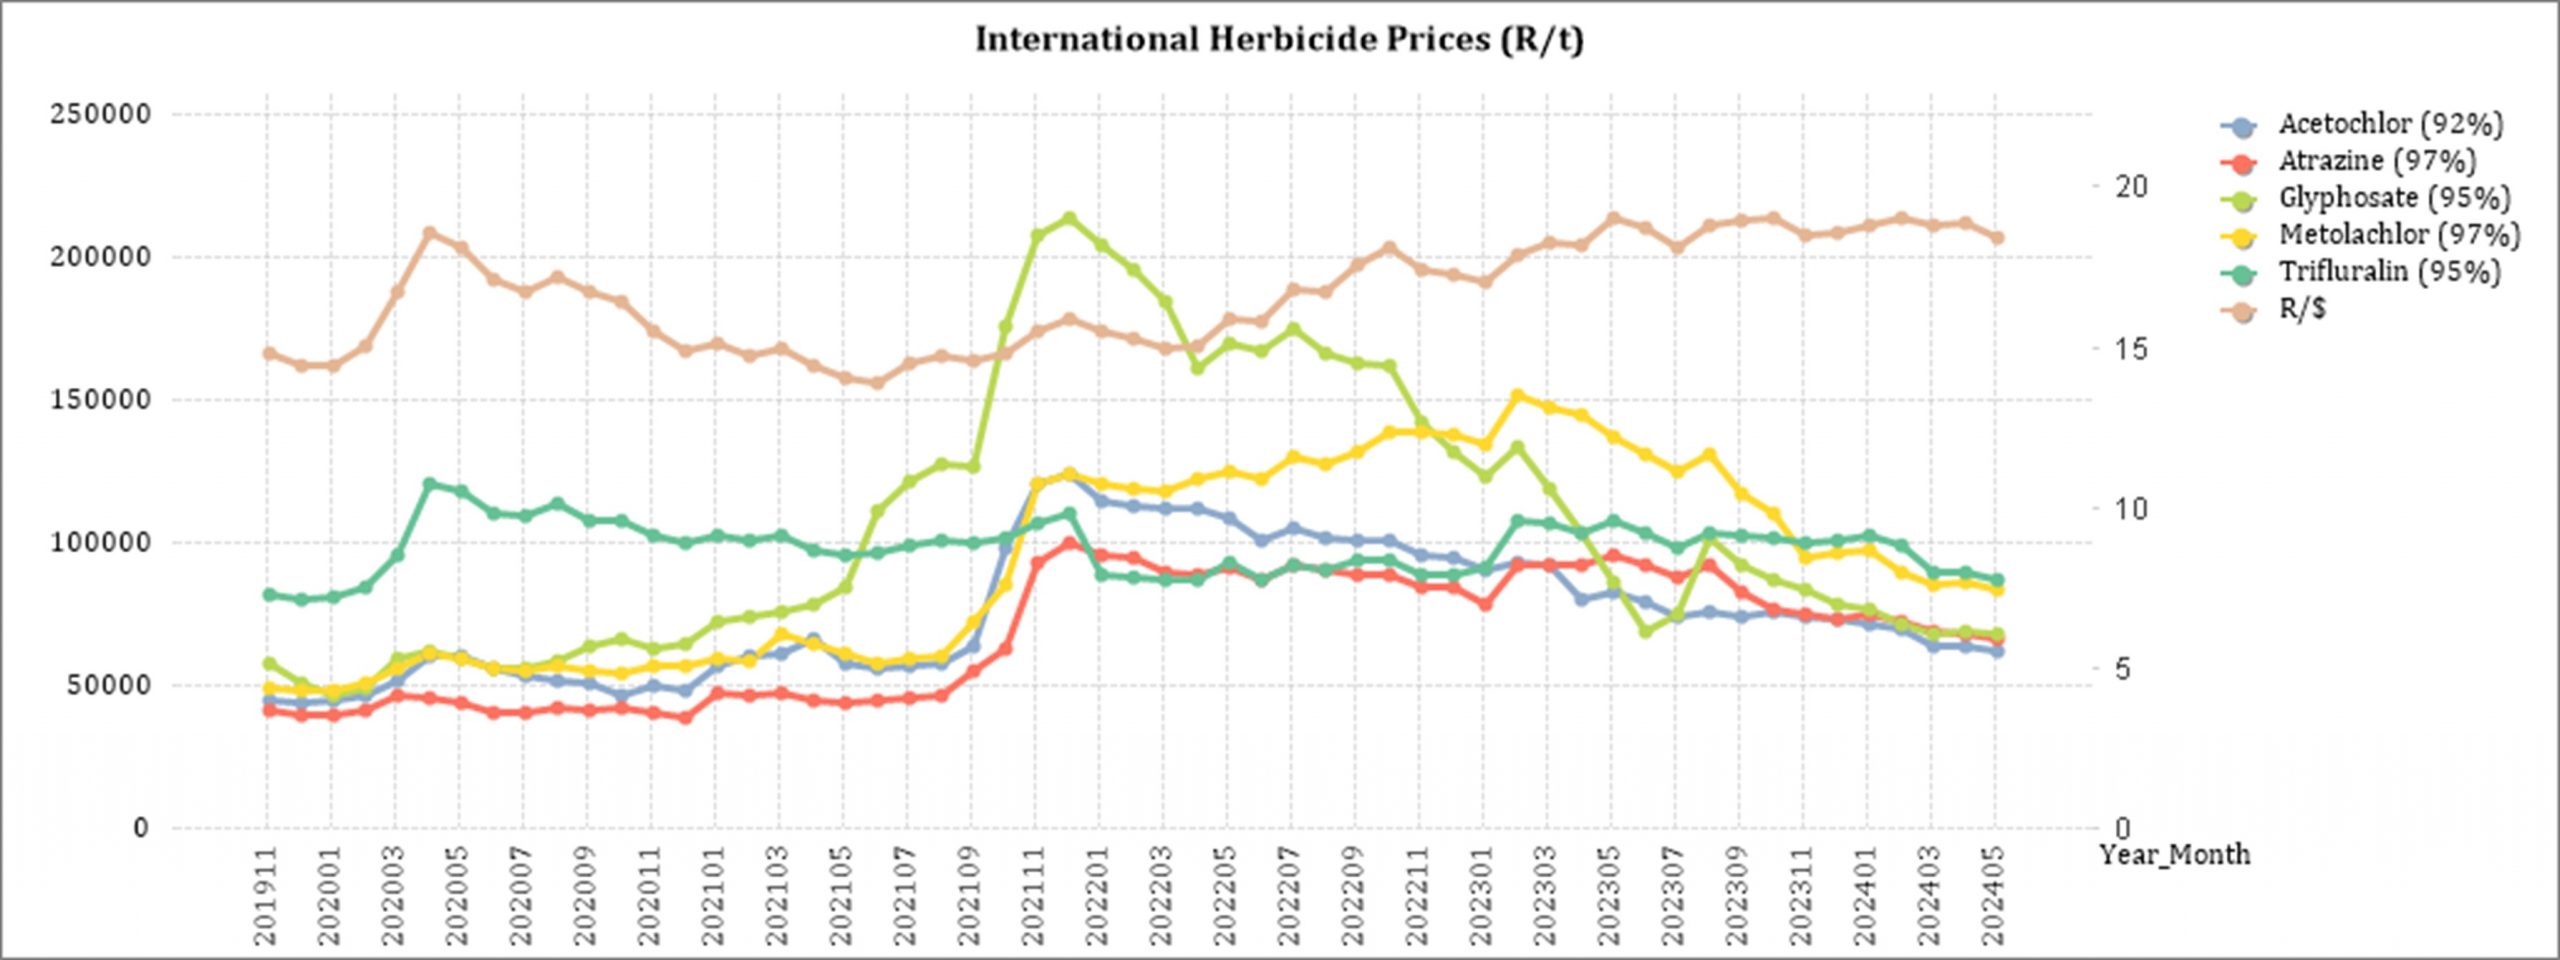
Highlights in the agrochemical sector
China is currently the largest glyphosate supplier in the world. The dynamics of China’s glyphosate greatly impacts the global supply structure, over 80% of glyphosate produced in China is exported, to more than 20 destinations in the world.
In China, the month-to-month analysis reveals a predominantly downward trend in the prices of most herbicides, insecticides and fungicides in dollar terms from April 2024 to May 2024. Specifically, the tables in this report indicate a 1,1% decrease in the rand terms of glyphosate (95%) during the same period.
The depreciation of the rand over the course of a year influences local prices, causing local prices to not decrease as much as in dollar terms. It is important to note that these international decreases in prices have not been experienced in the local market.
Source: Cnchemicals
Herbicides
The following products are the main products regarding herbicides that may have an impact on input costs for producers.
Glyphosate (95%)
Acetochlor (92%)
Atrazine (97%)
Metolachlor (97%)
Trifluralin (95%)
The following comparison is from the June 2024 Grain SA report which reports the previous month’s prices.
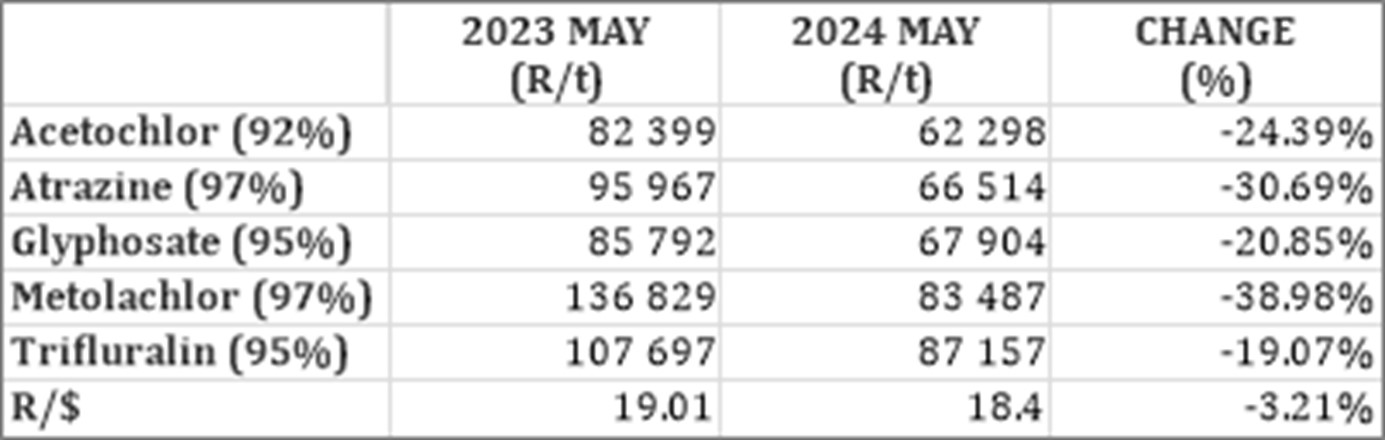
In comparison with the previous year’s prices, all of the products experienced a price decrease. Metolachlor had the biggest decrease with 39,98%.
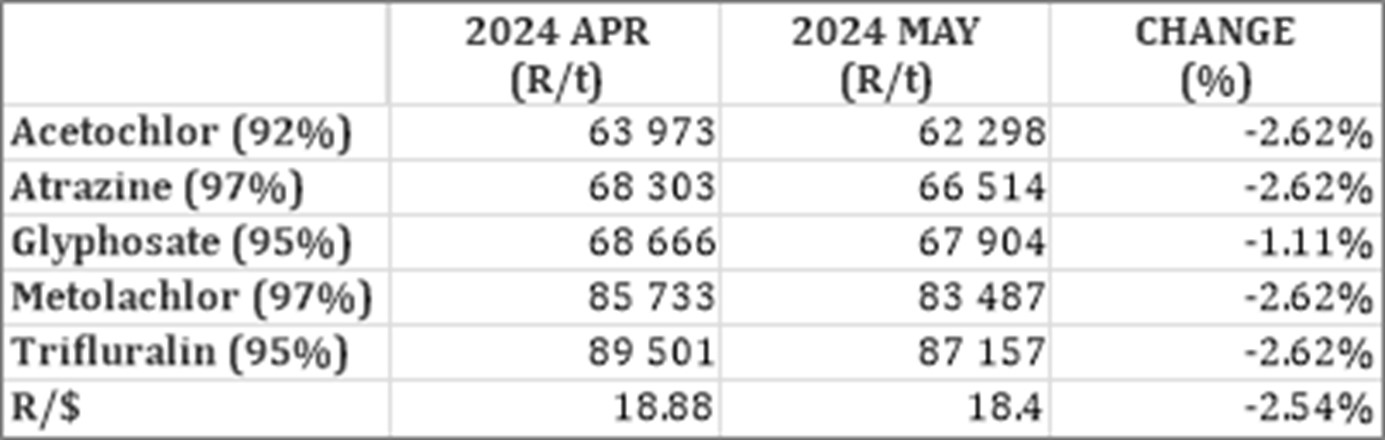
For the two months compared all of the products experienced a price decrease. Four of the products decreased with 2,62%.
The graph below shows the international herbicides prices (R/t) per product from November 2019 to date.
Insecticides
The following products are the main products regarding insecticides that may have an impact on input costs for producers.
Imidacloprid (95%)
Lambda-cyhalothrin (95%)
Carbofuran (99%)
Deltamethrin (98%)
Acetamiprid (95%)
Chlorpyrifos (95%)
Cypermethrin (94%)
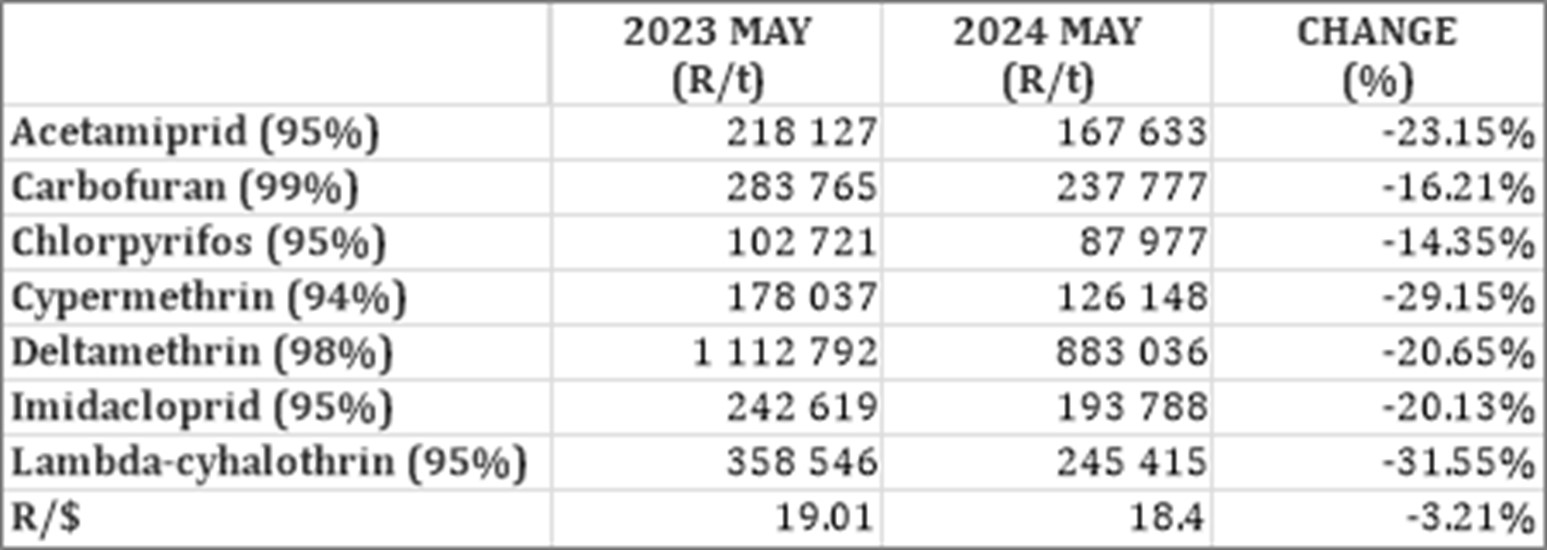
In comparison with the previous year’s prices, all of the products experienced a price decrease. The largest decrease was Lambda-cyhalothrin with 31,55%.
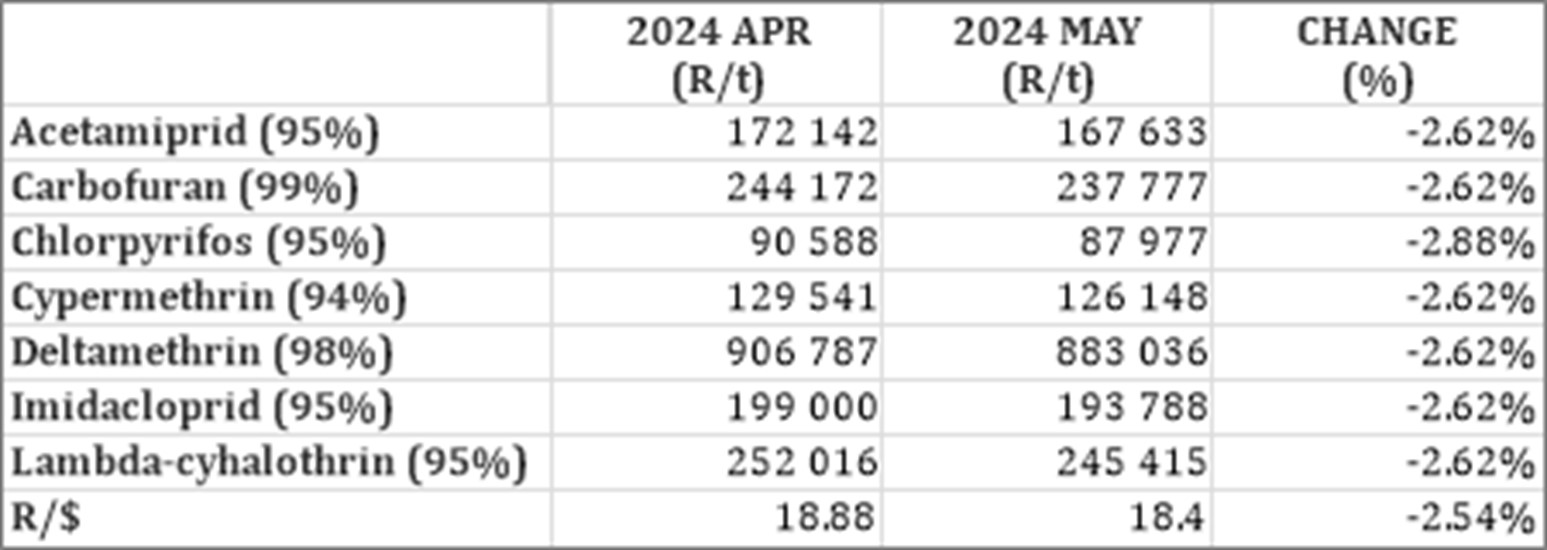
For the two months compared all of the products experienced a price decrease. Chlorpyrifos had the highest decrease down 2,88% and six of the products decreased with 2.62%.
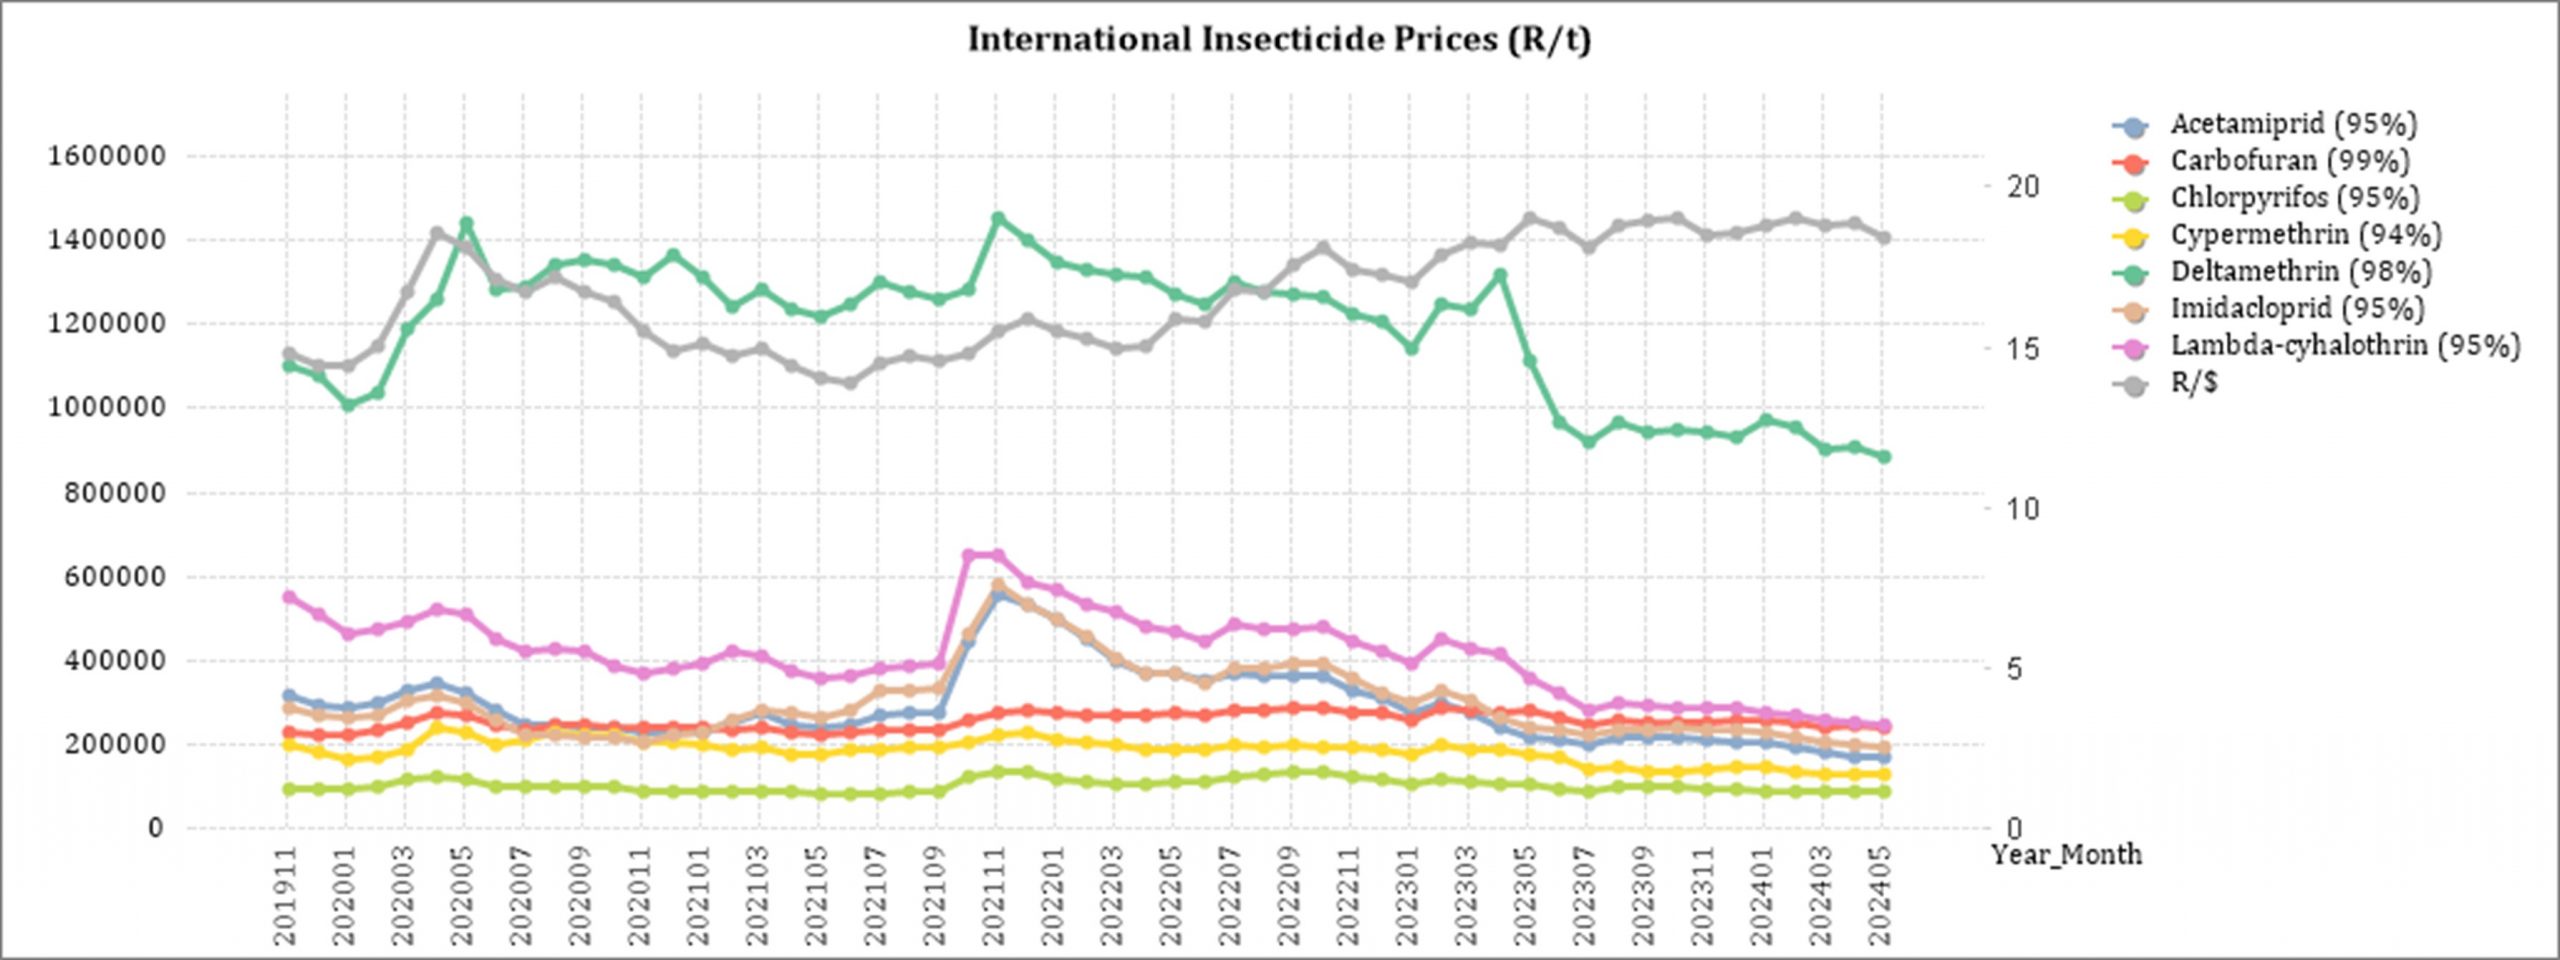
The graph below shows the international insecticide prices (R/t) per product from November 2019 to date.
Fertiliser
The following fertiliser products are being analysed:
Ammonia (Middle East)
Urea (46%) (Eastern Europe)
DAP (USA Gulf)
KCL (CIS)
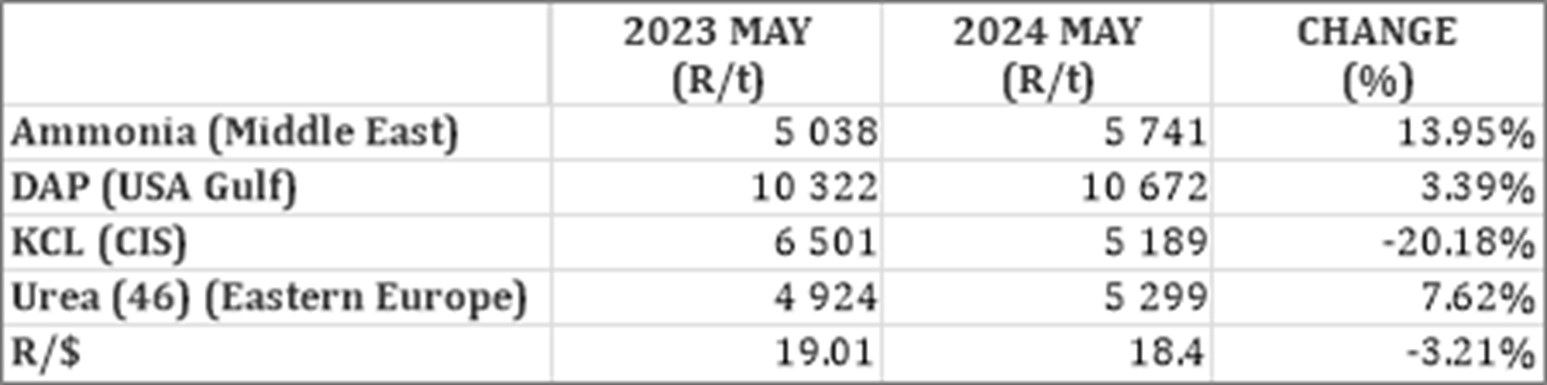
As seen in the table above one of the main fertiliser products decreased on a year-on-year basis. The only decrease, based on average international prices (R/t), was KCL (CIS) (20,18%). The rest experienced a price increase, with Ammonia having the biggest price increase of 13,95%.

For the two months compared three of the products experienced a price decrease. Urea had the highest decrease with 7,05%.
The graph below shows the international fertiliser prices (R/t) per product from November 2019 to date.
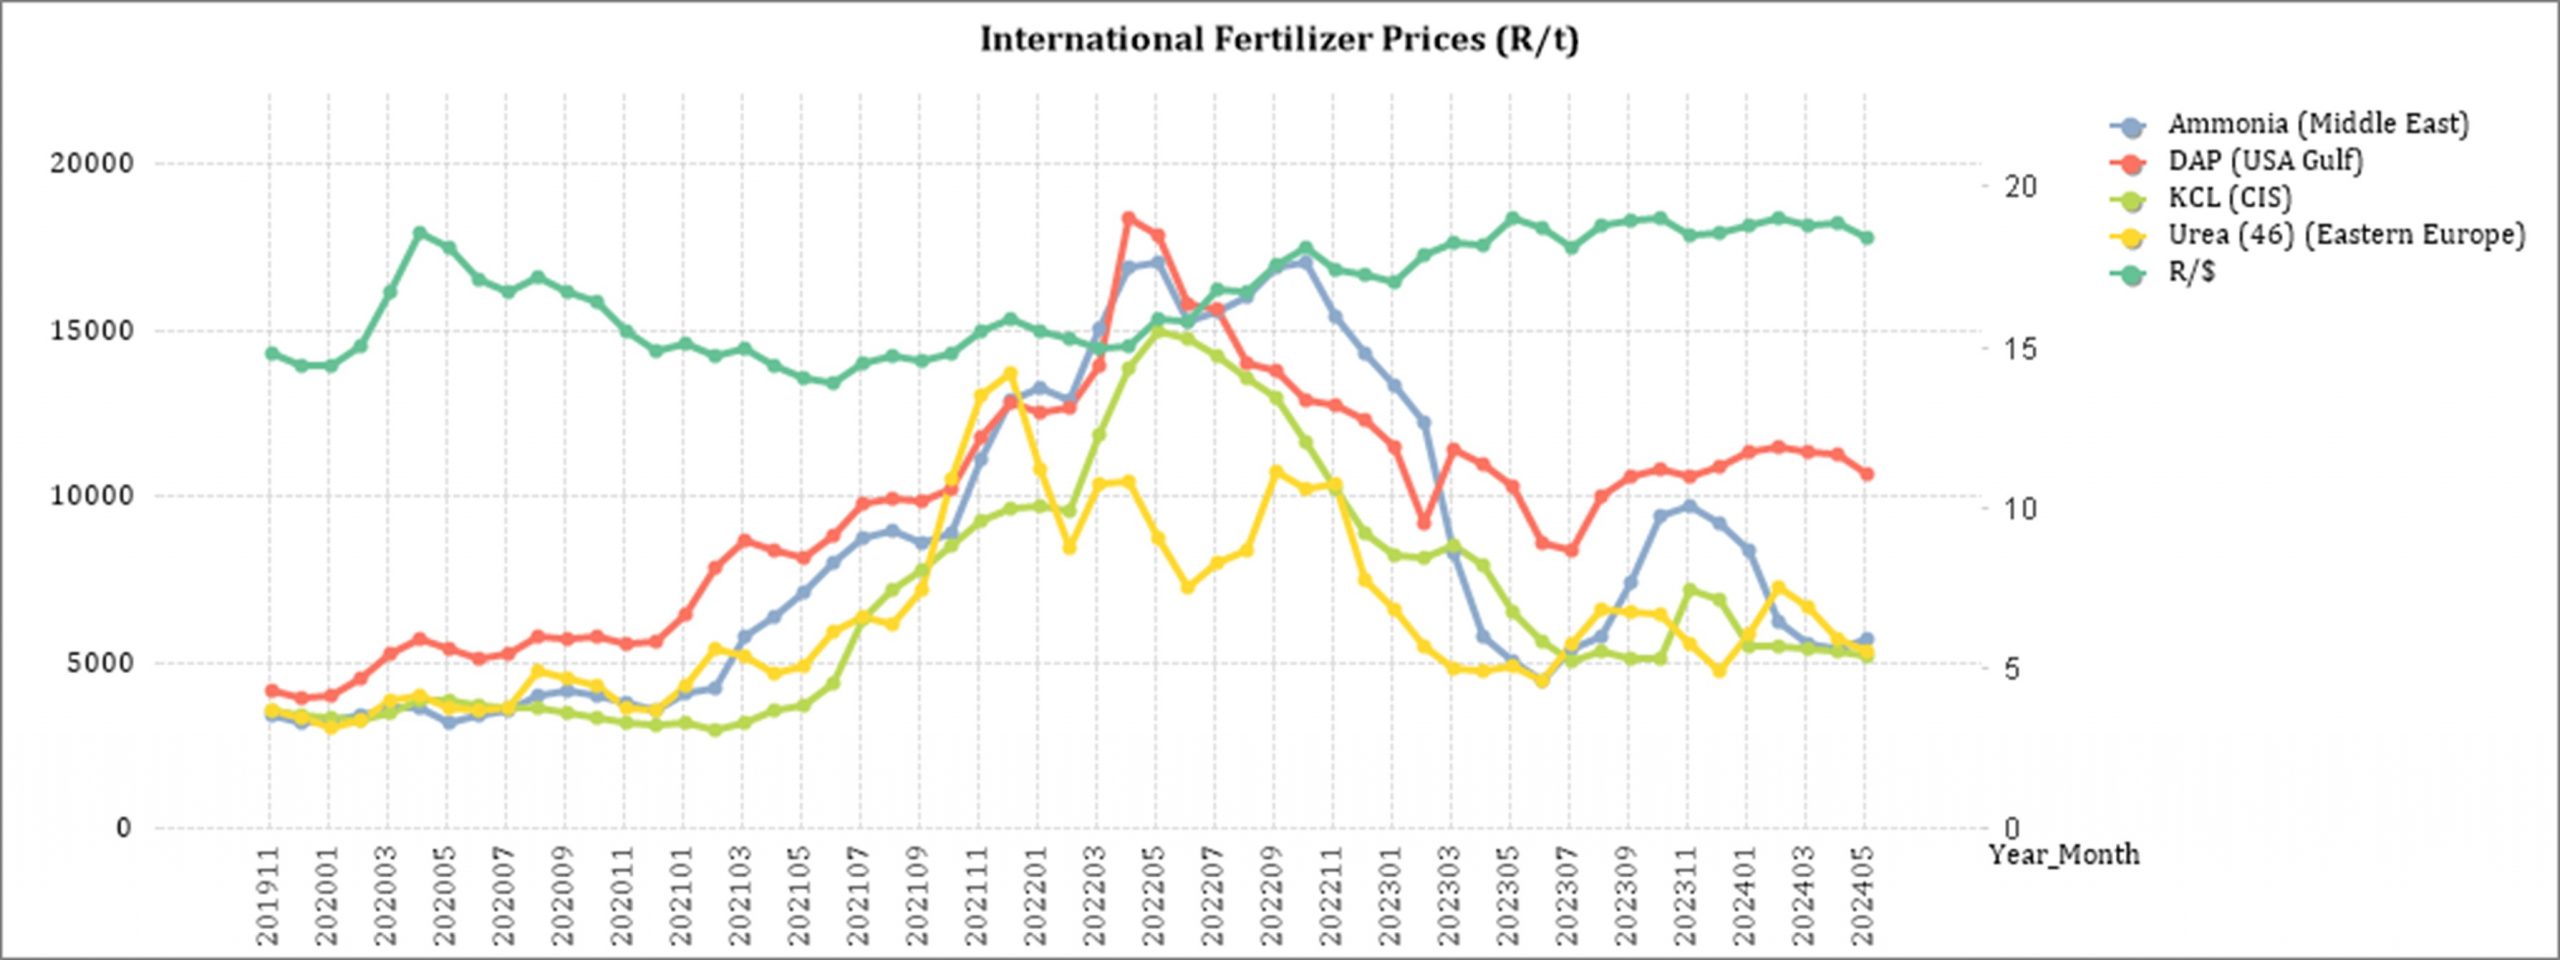
Sources: Grain SA – https://www.ft.com/content/4d746aa5-29e3-4796-b9e6-0b64c6865389
Nitrogen:
Urea: This week the Egyptian gas supplies curtailed, which prompted panic buying of Egyptian urea, adding a good $20 to $30/t to the price. Egyptian gas supplies have been limited for years now as their gas fields are being exhausted, the start of summer contributes to the spikes in electricity demand, gas consumption often exceeds supply. The Egyptian government cuts back of fertilizer production and we see short-term outages. This week Egyptian gas supplies were back online and ammonia-urea plants were busy restarting with minimal production actually being lost – but damage was done in terms of hysteria and urea prices around the world were dragged up.
Ammonia: Ammonia price was flat in May, indicating equilibrium between supply and demand. There are a lot of plants, especially in the Middle East and South East Asia down for maintenance, and with the addition of Egyptian plants stopping briefly this week, the lack of price movement on ammonia suggests a weak demand.
Phosphates: Phosphate prices increased a few dollars again in May. Chinese exporters are showing a lot of discipline in offering prices and have been able to gradually raise their prices. While the India demand for DAP is quite substantial, it seems that none of the phosphate producers are ready to chase business with discount prices.
Potash: The general elections at the end of May in India, has caused a further delay in the already late annual Indian contract price for Potash. Buying has substantially slowed as various regional markets are looking at the Indian price to establish a reference number – in the absence of this Indian contract being settled. Most buyers are pausing procurement, which is adding to the oversupply situation.
Sources
FCurve /F Curve Insight
https://www.grainsa.co.za/upload/report_files/Chemical-and-Fertilizer-Report-April-2024.pdf
Source: GrainSA
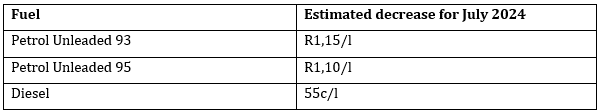
There is a possibility that fuel prices may decrease further in July according to unaudited data from the central energy fund. The estimated decreases are as follows:
FUTURE PRICES
The graphs below illustrate the market sentiment for maize, in the form of future contracts, for the upcoming contract months. The market sentiment is the expectation of supply and demand fundamentals relating to white and yellow maize in South Africa.
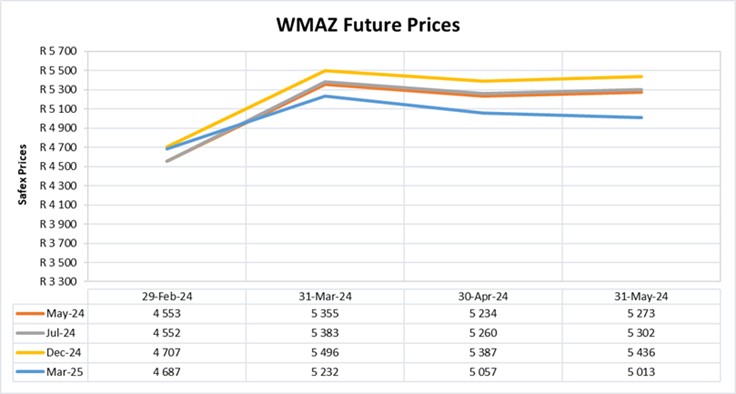
Source: Sagis/JSE
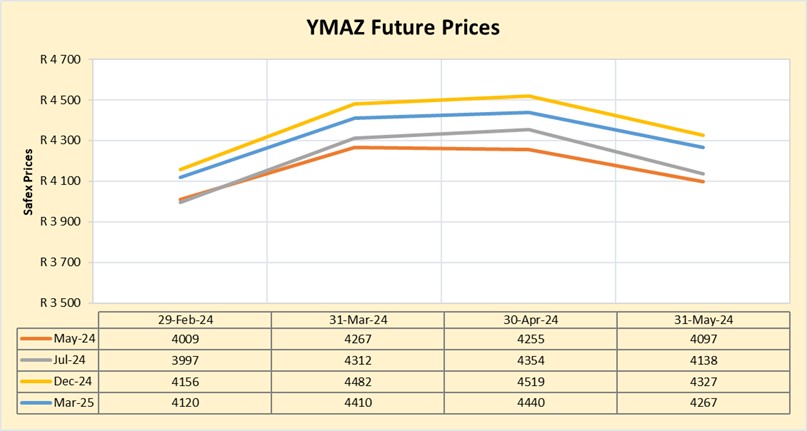
Source: Sagis/JSE
According to the Absa Agri Trends report, released 30 May 2024, CBOT corn prices followed an upward price trend, increasing by 3,5% month-on-month as wet weather in the US caused planting delays in the past few weeks. The US Department of Agriculture’s Crop Progress report showed that as of May 26,83% of the 2024 US corn crop had been planted, which is slightly ahead of the five-year average.
Safex maize prices increased week-on-week by 3,3% on May 28 underpinned by the slightly lower production forecast by the Crop Estimation Committee. Maize prices have decreased from this production season’s highs seen in April and are expected to continue trading around the R5 000 per ton mark for white maize and R4 000 per ton mark for yellow maize.
Analysts expect that the adverse weather effects on this season’s maize crop have been fully priced in and local supply is expected to meet local demand, however, the high regional demand poses an upside price risk. The high regional demand poses an upside price risk.
Source:
chrome-extension://efaidnbmnnnibpcajpcglclefindmkaj/https://agrink.co.za/downloads/ABSA%20Agri%20Trends%20Grains%20and%20Veggies.pdf
Fraud risk
FRAUD AWARENESS
Fraud.com identified their top ten fraud trends for 2024. The last four fraud trends are listed below.
-
- Ongoing challenge of balancing fraud and customer friction: Online businesses must balance risk and opportunity when mitigating fraud. In the case of online shopping, the amount of “friction” customers experience during the checkout process correlates with their conversion success. Merchants and issuers seek alternative authentication solutions (such as passive behavioural biometrics and password less authentication via biometrics with liveness detection) to attain this balance to improve customer experience and reduce risk.
- Rise of synthetic identities: According to the McKinsey Institute, synthetic identity fraud is the fastest-growing type of financial crime in the United States and is also on the rise around the globe. Indeed, synthetic identity fraud comprises 85% of all fraud right now. With this type of fraud, fraudsters create new identities by piecing together elements of a person’s personal information and combining them with false identifiers. Essentially, they take bits of legitimate data, add fictitious information, and create a new identity. Organisations are struggling to prevent synthetic identity fraud; after all, the whole point of synthetic identity fraud is to create a synthetic victim that does not exist in real life.
- Escalating cost of fraud: The total cost of fraud is becoming a genuine concern, from fraud losses, prevention tools and headcount costs to the customer lifetime value impact. It’s estimated that Fraud loss is $5,4 trillion globally; according to the University of Portsmouth, fraud accounts for approximately $185 billion in losses in the U.K. and a 9,9% increase in the cost of fraud for US financial services firms. Why the increase? As more and more people have turned to online and mobile channels to shop, fraudsters again have followed, thus the increase in fraud losses and associated costs with fighting fraud.
- Account security: To protect against fraudsters, organisations need to take a layered approach to account security. The culprit behind system attacks is often single-factor authentication methods that result in unauthorised access to accounts, enabling customer account fraud, identity theft, ransomware attacks, and other fraudulent activity, notes the Federal Financial Institutions Examination Council. With multi-factor authentication, institutions use more than one distinct authentication factor to successfully authenticate customers, such as behavioural biometrics, device id, and biometric authentication.
Source: https://www.fraud.com/post/top-10-fraud-identity-theft-trends


