
The NWK Limited external factors report provides an overview of the main external factors that NWK and its clients are exposed to at a specific point in time. This report opts to aid in a timely basis to foresee external market and other factors that may have an impact on any business and clients. The main focus of this document is to have a closer look at external factors that can affect any business and our customers.
Executive summary
In a gazette published on Tuesday (8 February 2022), Minister Thulas Nxesi said that the national minimum wage is now R23.19 for each ordinary hour. This change will take effect from 1 March 2022. This adjustment of the minimum wage for farmworkers would amount to an increase of about R240 per month for a farmworker. This will put a further constrain on cashflows of farmers.
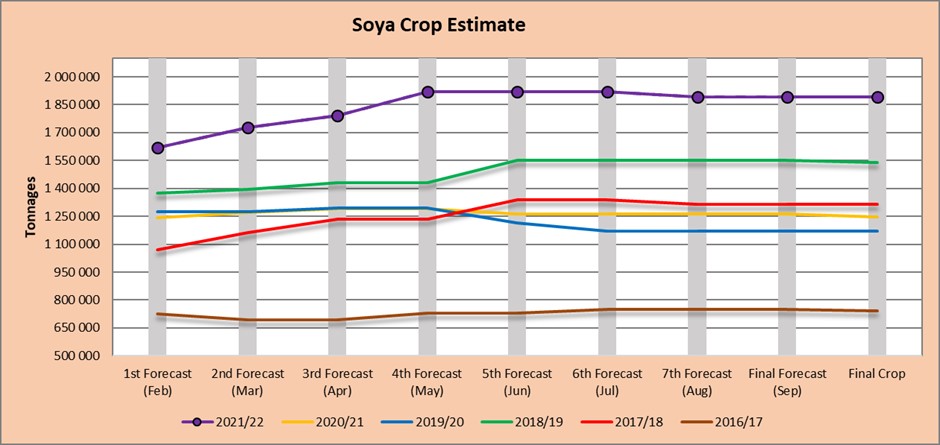
The National Agricultural Marketing Council (NAMC) predicts 30 April 2022 ending stock for white and yellow maize to exceed that of the 2020/2021 season. Their forecast for white maize for the season is that of an excellent harvest. The estimated maize crop is 6% bigger than the 2020/2021 crop. The three main maize producing areas, namely the Free State, Mpumalanga and North West provinces are expected to produce 84% of the 2021/2022 crop.
The repo rate has been cut by 300 basis points to help mitigate the economic fallout of the COVID-19 pandemic until November 2021. During January 2022 the Monetary Policy Committee (MPC) of the South African Reserve Bank (SARB) increased the repo rate with 25 basis points, thus the repo rate is currently 4% and the prime rate is 7,5%.
The Agrochemical sector is starting to recover from China’s ‘Double Control Policy’. The double control policy provides a clear alert level of energy consumption intensity reduction and amount reduction.
Market risk
GRAIN MARKET ANALYSIS
- Ending stock – national
Ending stock data is gathered from the NAMC. The estimates are reassessed and reported by the Grain and Oilseeds Supply and Demand Estimates Committee. The following is a summary of the February 2022 ending stock estimates for the 2021/202 season:
The following is a summary of the February 2022 ending stock estimates for the 2021/2022 season:
- Sunflower => 26 864 tons
- Soybeans => 182 093 tons
- Sorghum => 109 015 tons
The following is a summary of the April 2022 ending stock estimates for the 2021/2022 season in tonnages:
- White maize => 1 669 432 tons
- Yellow maize => 937 632 tons
The following is a summary of the September 2022 ending stock estimates for the 2021/2022 season:
- Wheat = 583 559 tons
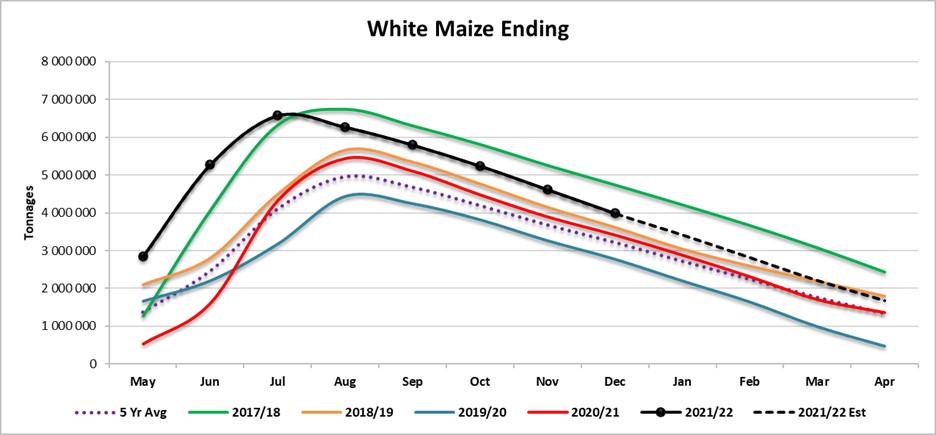
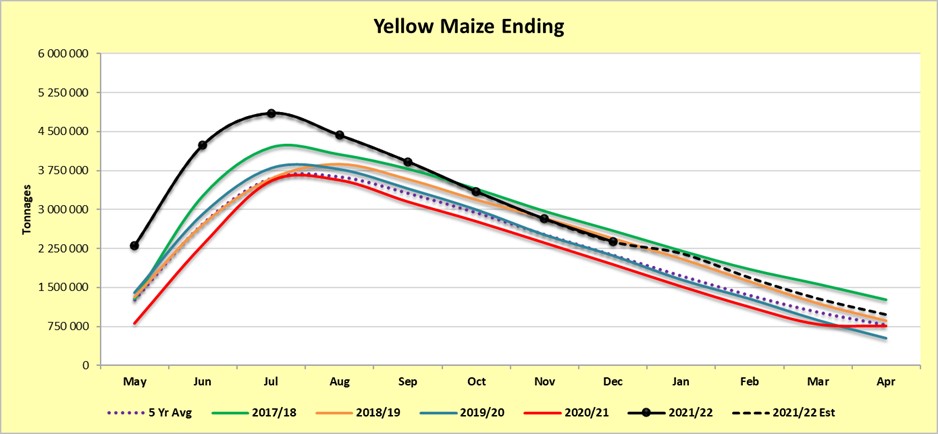
Graph 1 shows the ending stock for white maize for April 2022, which is 314 479 tons or 23% more than the 2020/2021 season. Graph 2 shows a 175 679 tons or a 23% increase in ending stock estimation for the 2021/2022 season compared to the previous season.
Source: Sagis
Source: Sagis
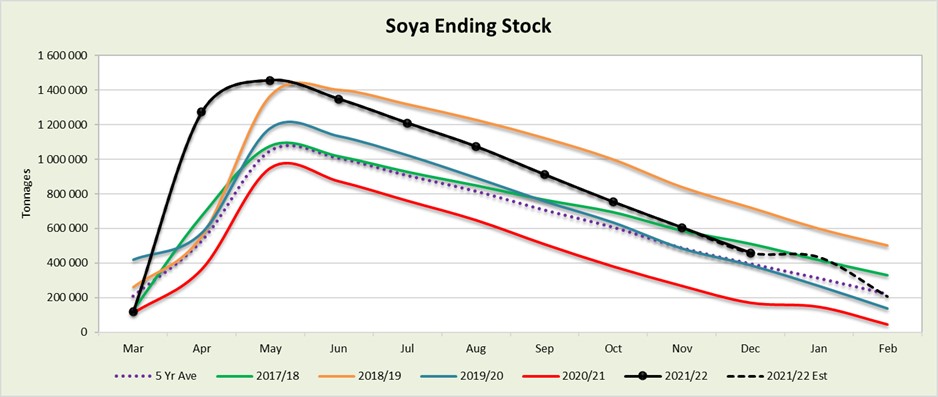
The actual soya ending stock for February 2022 is 136 040 tons more than February 2021 (Graph 3).
Source: Sagis
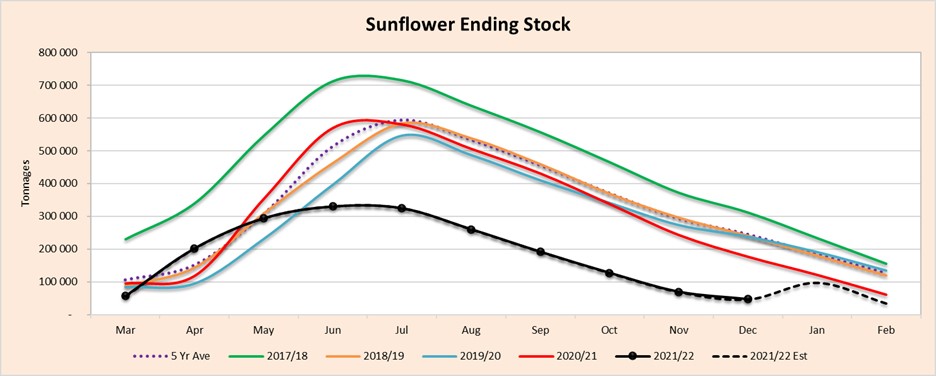
The actual sunflower ending stock is 56% (34 100 tons) less than the previous seasons ending stock (Graph 4).
The sharp rise after the dip for sunflower seed and soybeans could mean that the ending stock could be less than what NAMC predicted, according to our forecasting.
Source: Sagis
- Crop estimations
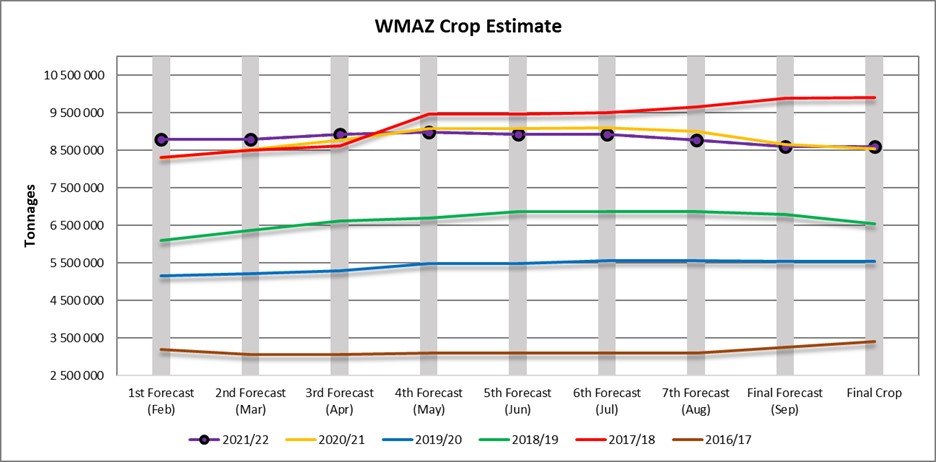
According to the Crop Estimate Committee (CEC) the final maize crop is 16,315 million tons, which is 7% or 1,015 million tons more than the previous season’s 15,300 million tons. The final area planted for maize is 2,755 million hectares, with a yield of 5,92 t/ha. The three main maize producing areas, namely the Free State, Mpumalanga and North West provinces re expected to produce 87% of the 2021 crop.
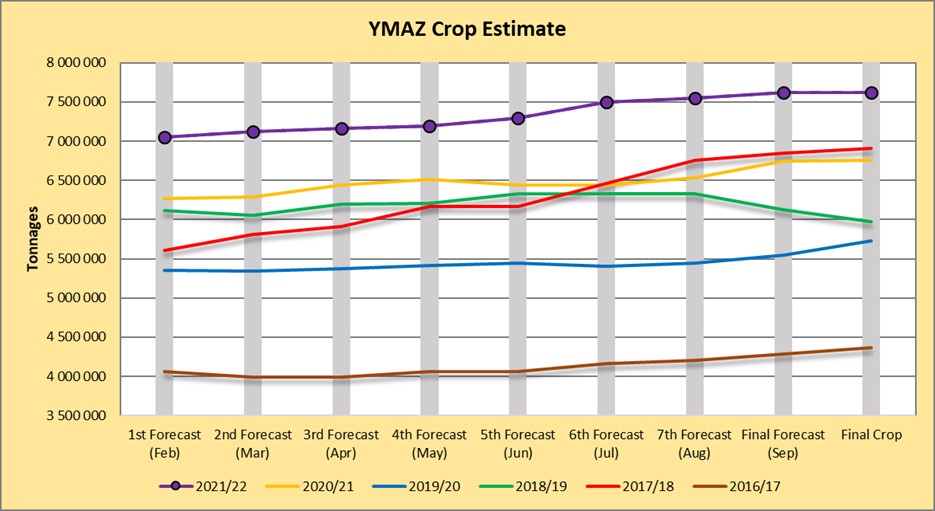
The area estimate for white maize (Graph 5) is 1,576 million hectares and for yellow maize the area estimate is 1,034 million hectares. The final white maize crop is 8,600 million tons. The final yield for white maize is 5,08 t/ha. In the case of yellow maize (Graph 6) the final crop is 7,715 million tons. The yield for yellow maize is 7,25 t/ha.
Source: CEC
Source: CEC
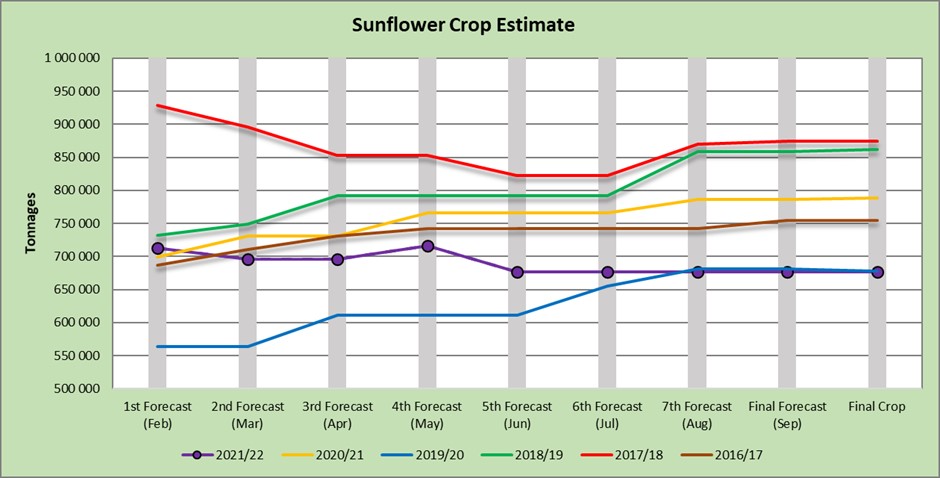
The final production figure sunflower seed (Graph 7) is 678 000 tons. The final area planted for sunflower seed is 477 800 ha, while the expected yield is 1,42 t/ha.
Source: CEC
The final production figures for soybeans are 1 897 000 tons. The final area planted for soybeans is 827 100 ha with a yield of 2,29 t/ha (Graph 8).
Source: CEC
- Imports and exports – national
Source: Sagis
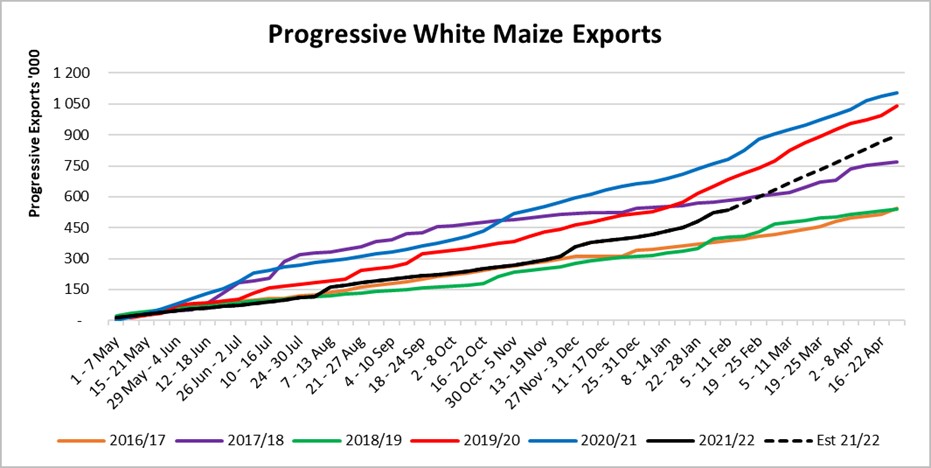
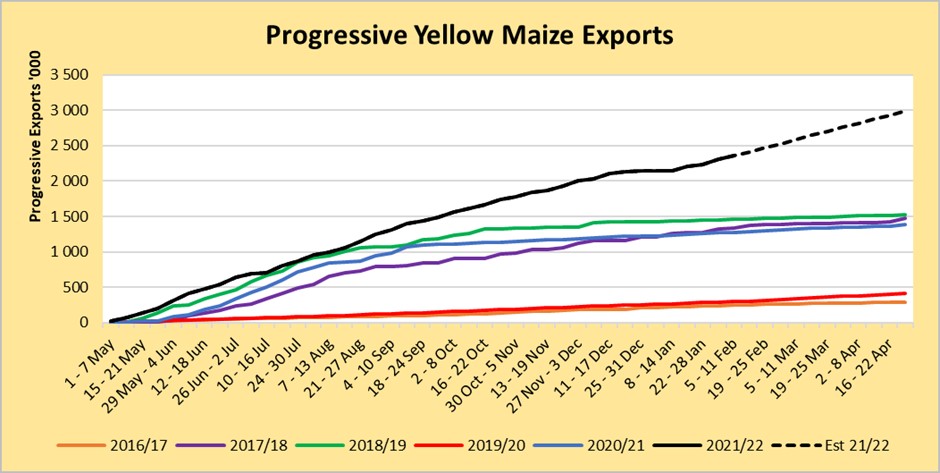
To date, 535 009 tons of white maize (Graph 9) and 2 357 300 tons (Graph 10) of yellow maize have been exported since the beginning of May 2021.
Source: Sagis
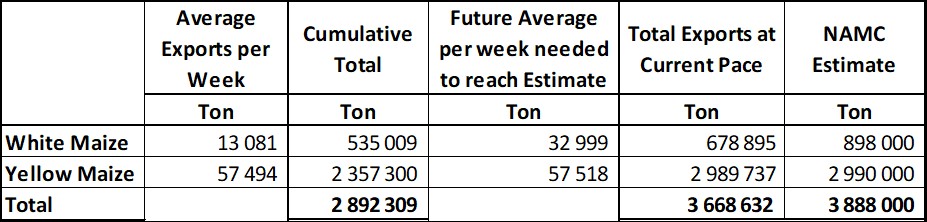
As seen in Table 1 the average white maize exports per week are currently 13 081 tons. If theoretically, white maize exports remain at the current average of 13 081 tons per week then there would be 219 105 tons less white maize exports than anticipated.
The average yellow maize exports per week are currently 57 494 tons. If theoretically, yellow maize exports remain at the current average of 57 494 tons tons per week then there would be 263 tons less yellow maize exports than anticipated.
- Parity prices
South Africa is a small producer compared to other countries and is thus a price taker (meaning that we cannot influence world prices). Because of this, our local prices are normally between import and export parity, which is illustrated in which is illustrated in Graph 11. An import parity price is defined as the price which a buyer will pay to buy the product on the world market. This price will include all the costs incurred to get the product delivered at the buyer’s destination.
An export parity price is defined as the price that a local seller could receive by selling his product on the world market for example, excluding the export costs. The price which the seller obtains is based on the condition that he delivers the product at the nearest export point (usually a harbour) at his own expense.
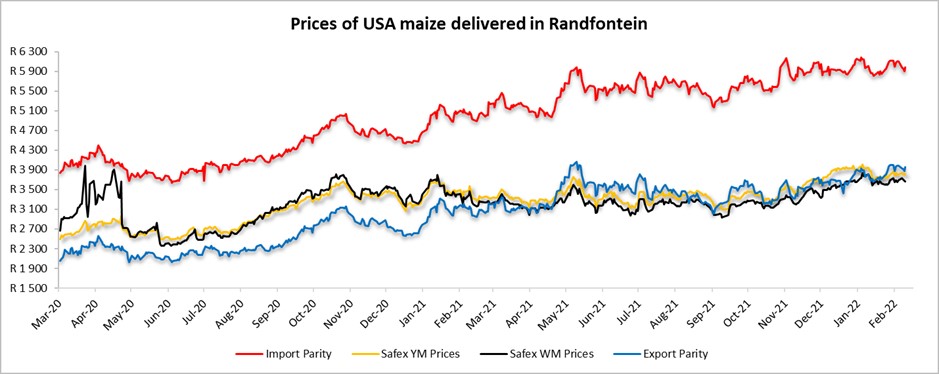
Source: Grain SA
- Producer deliveries – provincial
For the marketing year which is May to April the Free State province dominates the white maize which is used for human consumption and gristing. North West showed a significant increase for the 2020/2021 season with a 1% rise over the previous season (Graph 12).
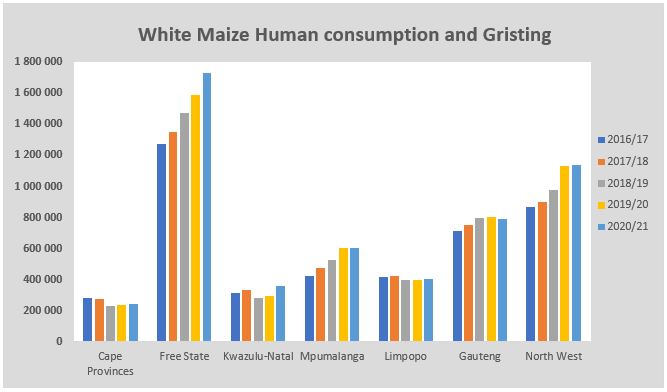
Source: Sagis
North West has a decreasing trend in yellow maize which is used for consumption and gristing. Only 18 563 tons of yellow maize was used in the 2020/2021 season that ended April 2021 (Graph 13).
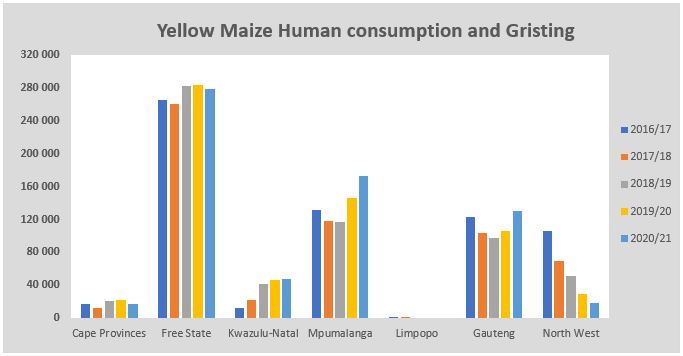
Source: Sagis
- Exchange rate
NWK Group is exposed to foreign exchange rate risk on various business areas, such as commodity prices and trade imports.
On a monthly average basis, the rand depreciated against the US dollar with 2,37% (0,38c) over the period December 2021 to January 2022. The one-year average for rand/US dollar is 14,82. Moreover, the average rand/US dollar exchange rate for the period January 2022 was R15,50 compared to R15,87 in December 2021 (Graph 14).
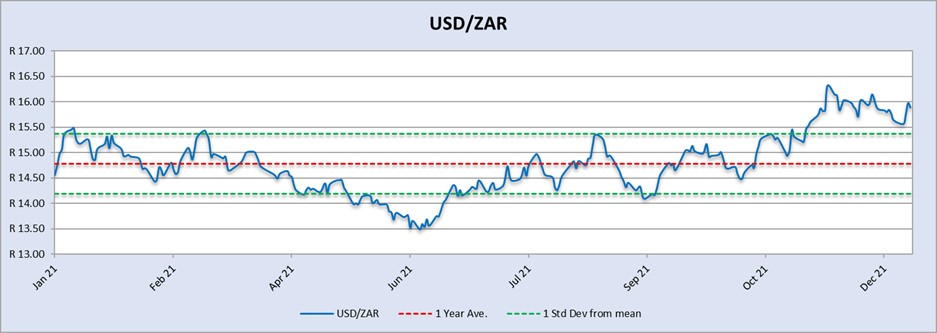
Source: Standard Bank, Corporate and Investment Banking & SARB
Exchange rate forecast:
Graph 15 shows the actual USD/ZAR for 2021 Quarter 3 (Q3) and 2021 Quarter 4 (Q4) against the forecasted figures. Trading Economics’s forecast for 2021 Q4 was the closest to actual. According to Nedbank and Trading Economics the rand will weaken in the year 2022.
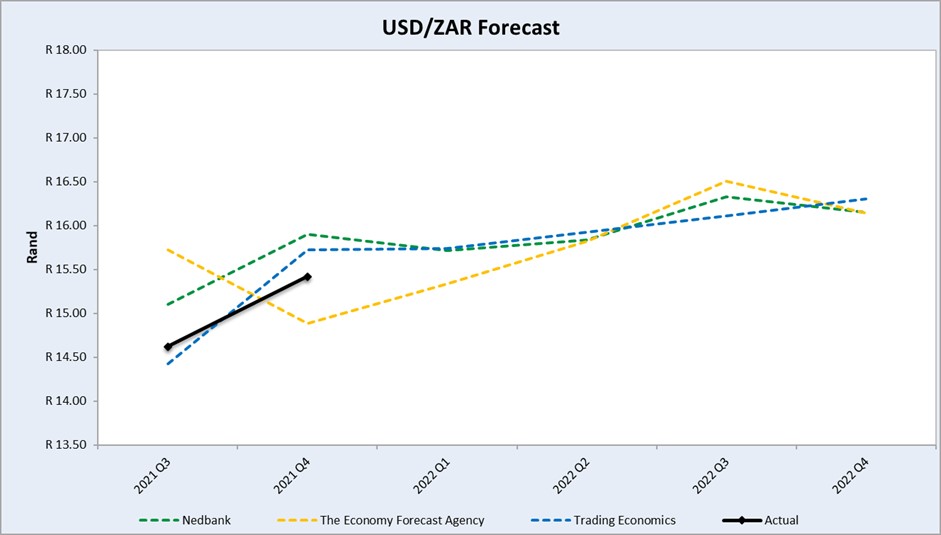
Source: Nedbank CIB; Absa; The Economic Forecast Agency; Trading Economics
- Highlights in the agrochemical sector
In the first quarter of 2022, the fading impact of the ‘Double Control Policy’ will support China’s agrochemical operation rate from March 2022. The double control policy provides a clear alert level of energy consumption intensity reduction and amount reduction. In accordance with China’s Paris Agreement pledge to become carbon neutral. In December China’s annual Central Economic Work Conference released the principle of ‘Double Control Policy’, which mentioned that ‘renewable energy and raw material energy, which is for production (not for fuel or power), are not included in the total energy consumption control’. The clarification supported diminishing the impact of the ‘Double Control Policy’ on ordinary industry operations in 2022. Not only are raw material producers slowly back to normal, but also the upstream manufacturers, especially intermediate producers, can plan for consistent supply for the new season.
Source: Agribusiness Global Direct
Herbicides
The following comparison is from the February 2022 Grain SA report which reports the previous month prices.
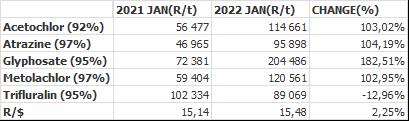
Year to year change (R/t): In comparison with the previous year’s prices, there was a significant increase in prices in four of the five main products. From an increase of 102,95% in Metolachlor to an increase of 182,51% in glyphosate. The only product that has a price decrease was Trifluralin with a decrease of -12,96%.
The R/$ exchange rate deviates 2,25% from last year and also have an impact on prices.
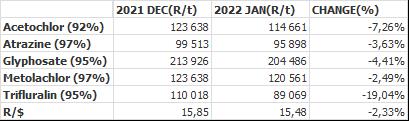
Herbicides – month to month change (R/t): From December 2021 to January 2022 there was a decrease in price on all of the products. The largest price decrease was Trifluralin with -19,04%. Graph 16 shows the international herbicides prices R/t per product from November 2019 up to January 2022.
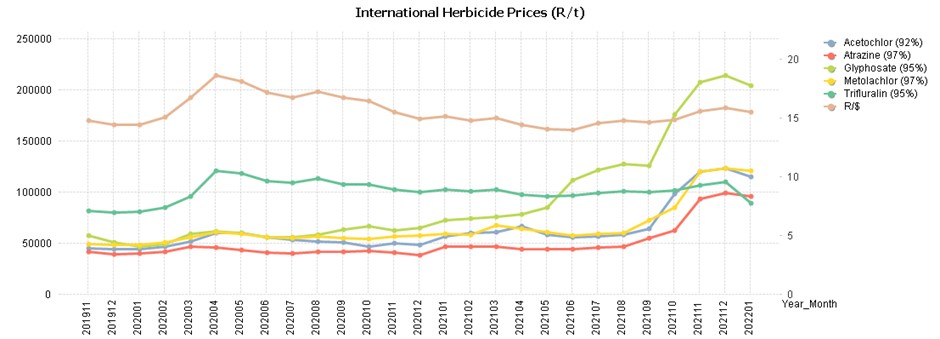
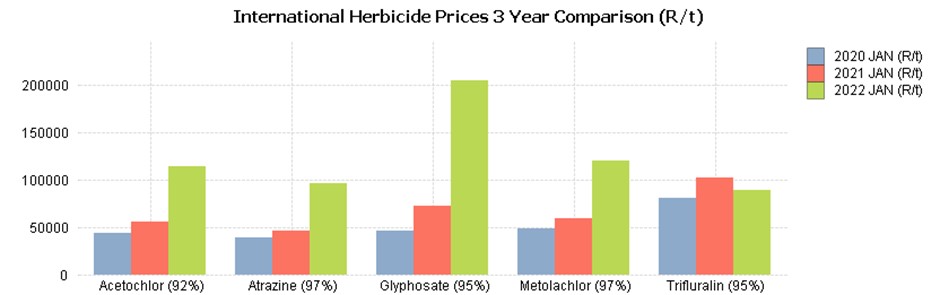
Graph 17 compares the international herbicides prices rand per ton per product from January 2020 to January 2022. The increase in the products can be seen here except Trifluralin which has decreased since 2021.
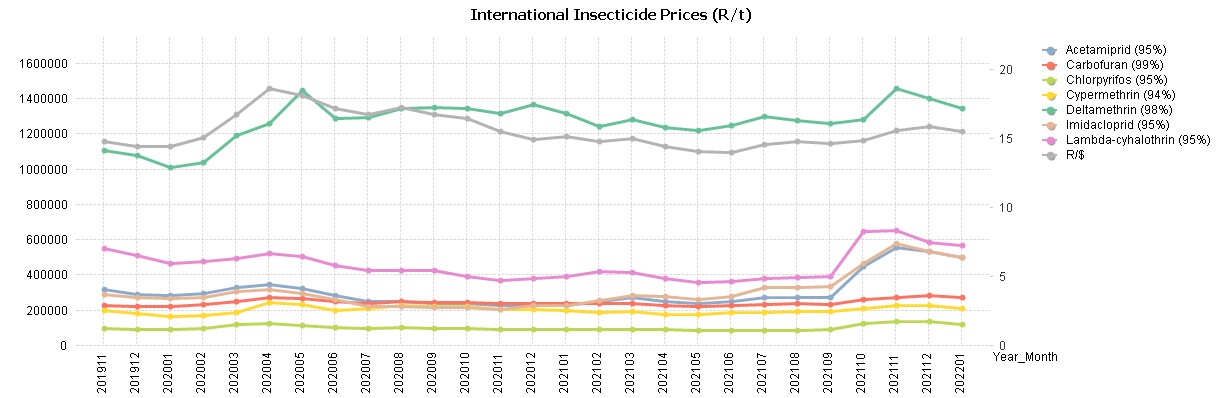
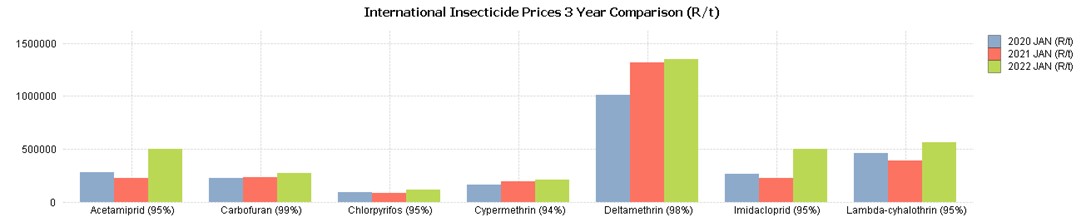
Insecticides
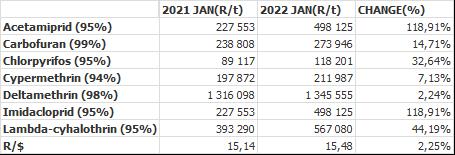
Insecticides – year to year change (R/t): In comparison with the previous year’s prices, there was a significant increase in prices in four of the four main products. An increase of 118,91% in Imidacloprid and an increase of 118,91% in Acetamiprid. There was also a 44,19% increase in Lambda-cyhalothrin and a 32,64% increase in Chlorpyrifos.
The R/$ exchange rate deviates 2,25% from last year and also has an impact on prices.
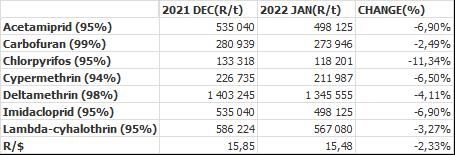
Insecticides – month to month change (R/t): From December 2021 to January 2022 there was more of a decrease in prices than an increase. All of the products show a decrease in prices, both in dollar and rand terms.
Fertiliser
Highlights in the fertiliser market:
- China announced the suspension of fertiliser exports until June 2022 to ensure domestic availability amid food security concerns China’s exports of DAP (diammonium phosphate) and urea account for approximately one third and one-tenth of global trade, respectively.
- Russia recently announced restrictions on nitrogen and phosphate fertiliser exports for six months, effective December 2021.
- 2022 outlook urea prices are anticipated to decline marginally in 2022 as feedstock costs moderate DAP prices are projected to remain elevated in the first half of 2022 on expectations of tight supply unless Chinese export restrictions are relaxed earlier than anticipated.
- MOP (Muriate of potash) contract prices are forecast to surge in 2022 following significant increases in spot prices. Upside risks to the outlook include further supply disruptions while downside risks (especially in the longer term) include intensification of environmental policies restricting fertilizer use.
Source: GrainSA/World Bank Blogs
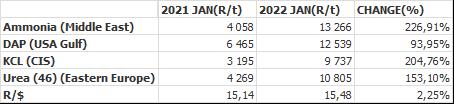
Fertiliser – year to year change (R/t): As seen in Table 6 all of the main fertiliser products increased significantly from January 2021 to January 2022. The highest increase was ammonia with 226,91%, followed by KCL 204,76% and urea 153,10% and DAP with 93,95%, based on average international prices R/t. The exchange rate differs 2,25 % from the previous year, so the increase in rand terms was also due to the exchange rate.
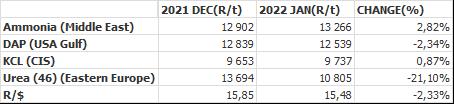
Fertiliser – month to month change (R/t): For the two months December 2021 to January 2022, there was a decrease in the price of two products, urea with -21,10% and a -2,34% decrease in DAP in the international fertiliser prices.
The only products with a price increase are ammonia and KCL with a 2,82% and 0,87% increase respectively.
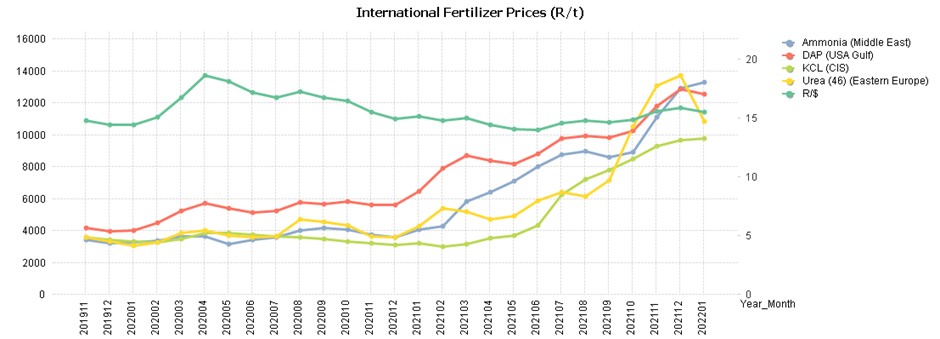
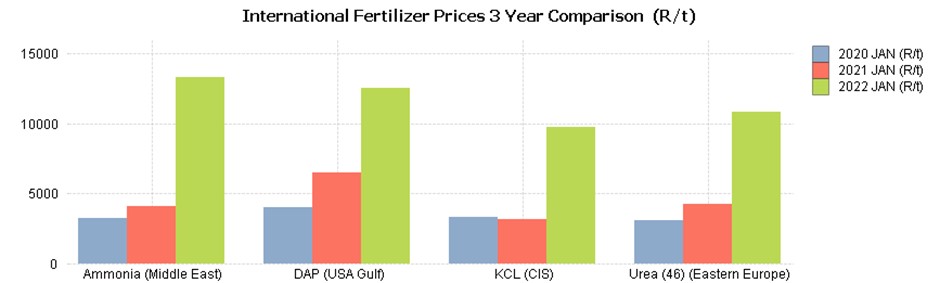
On Graph 21 the increase in international fertiliser prices can be seen. The three years that are compared in the graph are 2020, 2021, 2022.
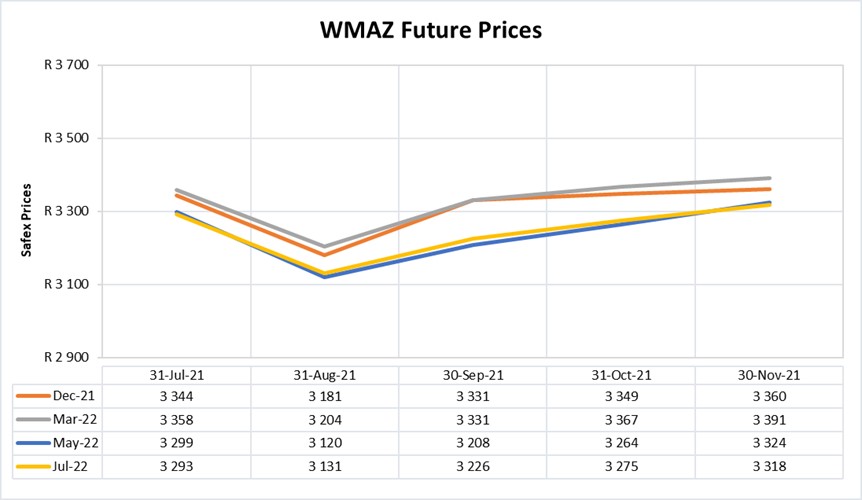
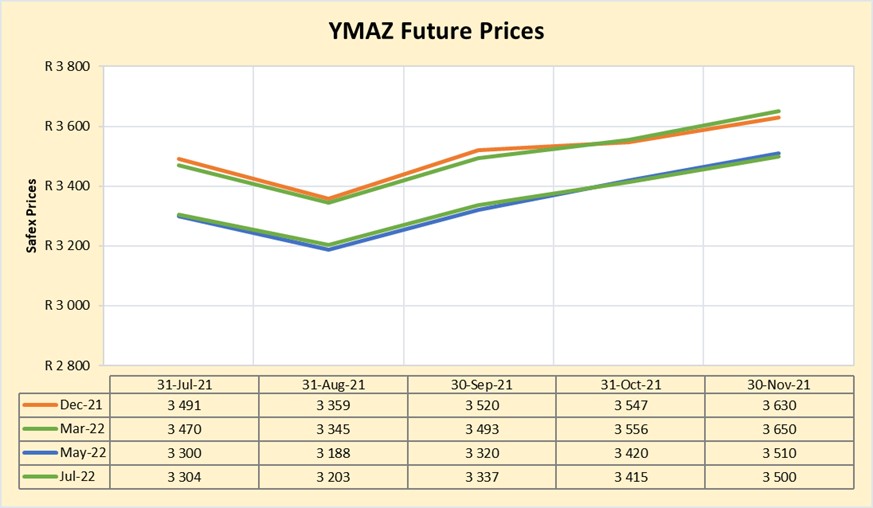
- Future prices
Graphs 22 and 23 illustrate the market sentiment for maize, in the form of future contracts, for the upcoming contract months. The market sentiment is the expectation of supply and demand fundamentals relating to white and yellow maize in South Africa.
Source: Sagis
Source: Sagis
WEATHER AND CLIMATE
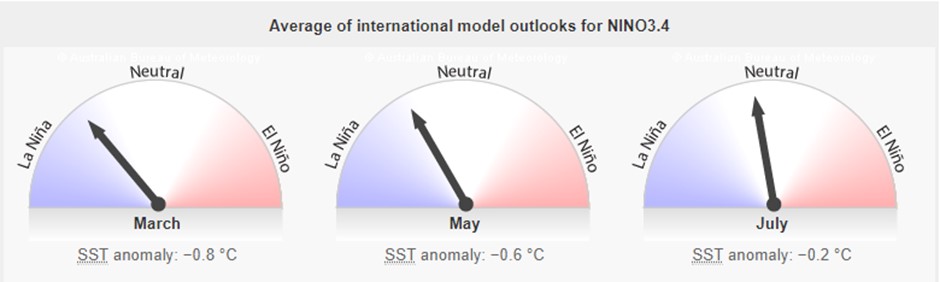
In February 2022, below-average sea surface temperatures (SSTs) weakened during January 2022, though anomalies stayed negative across most of the east-central and eastern equatorial Pacific Ocean.
In summary, a La Niña is favoured in the next couple of months, with a 77-100% chance of La Niña from January 2022 until March 2022.
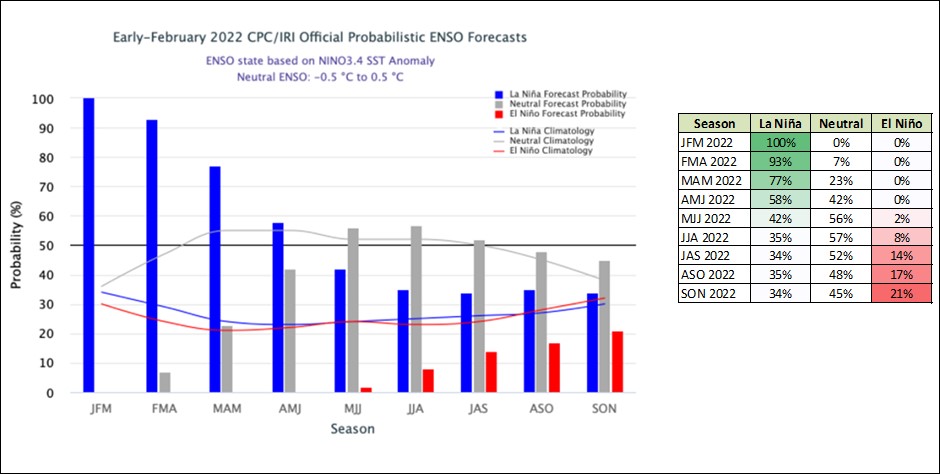
La Niña remains active in the tropical Pacific. Model outlooks suggest the La Niña is at or nearing its peak with a return to neutral ENSO (El Niño-Southern Oscillation) likely in the coming months. All but one of the model outlooks suggest tropical Pacific Sea temperatures will return to neutral early to mid-autumn.
INTEREST RATE RISK
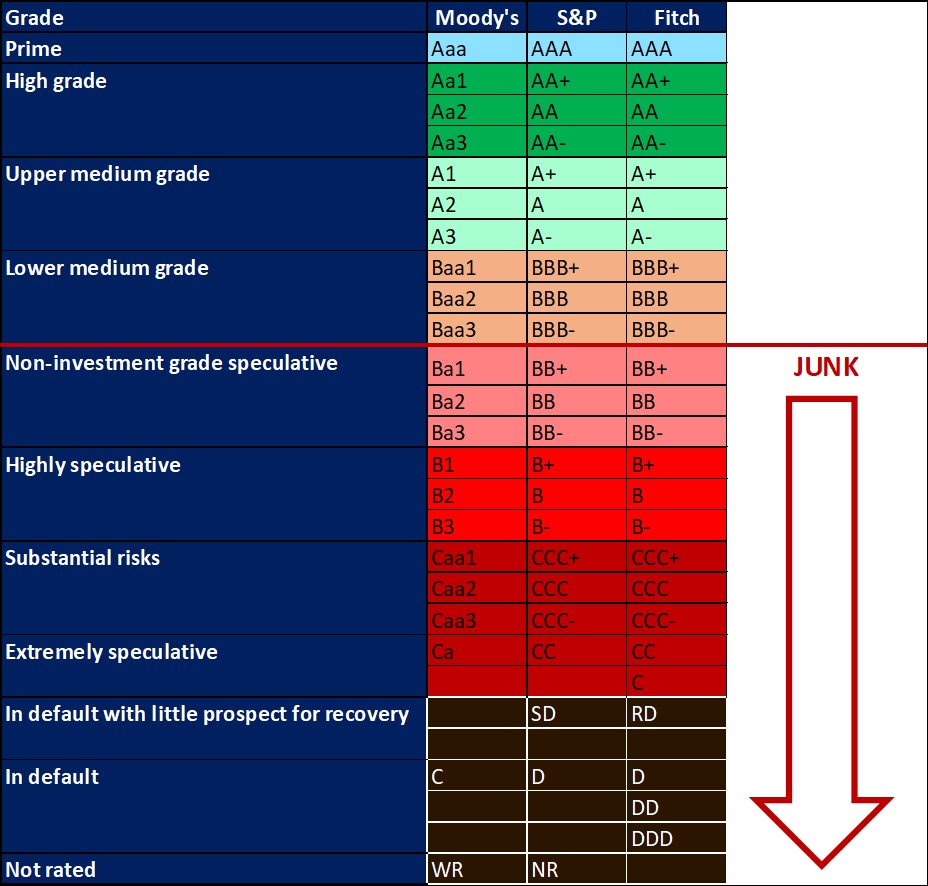
On 27 March 2020, Moody’s downgraded South Africa’s sovereign credit rating to sub-investment grade and placed a negative outlook on the rating. The key drivers for this downgrade include weak economic growth, continuing deterioration in fiscal strength, and slow progress on structural economic reforms. It is now the first time in post-apartheid South Africa where all major rating agencies, that is, Moody’s, Fitch and S&P, have South Africa’s credit ratings in sub-investment grade territory.
The COVID-19 pandemic forced the South African Reserve Bank to make a number of interest rate cuts to bring relief to the economy. Interest rate movement:
- 20 March 2020 – 8,75%
- 15 April 2020 – 7,75%
- 22 May 2020 – 7,25%
- 23 July 2020 – 7,00%
- 18 November 2021 – 7,25%
- 27 January 2022 – 7,50%
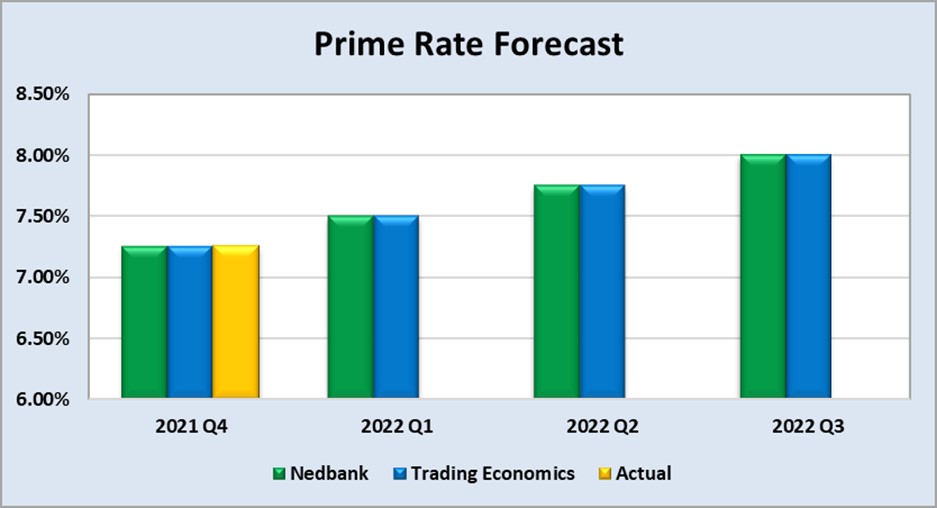
Graph 22 shows the prime rate forecast for 2021 Q4 to 2022 Q3. Nedbank as well as Trading Economics’ forecast that the prime interest rate will increase with 25 basis points for 2022 Q1. The next MPC meeting date is 24 March 2022.
Fraud risk
FRAUD AWARENESS
TIPS TO RECOGNISE FRAUD OR A SCAM
- It seems too good to be true – for example, a holiday that’s much cheaper than you’d expect.
- Someone you don’t know contacts you unexpectedly.
- You suspect you’re not dealing with a real company – for example, if there’s no postal address or free email address provider like @gmail.
- You’ve been asked to transfer money quickly.
- You’ve been asked to pay in an unusual way – for example, with Cryptocurrency and vouchers.
- You’ve been asked to give away personal information like passwords or PINs.
- You haven’t had written confirmation of what’s been agreed.
HOW TO PROTECT YOURSELF AGAINST FRAUD
- Do not open suspicious texts, pop-up windows or click on links or attachments in emails – delete them.
- Be careful about giving personal information away.
- Make your online accounts secure.
- Resist the pressure to act immediately.
- Choose your passwords carefully and update regularly.
- Beware of–make sure to not connect with–fake people/accounts.


