
The NWK Limited external factors report provides an overview of the main external factors that NWK and its clients are exposed to at a specific point in time. This report opts to aid in a timely basis to foresee external market and other factors that may have an impact on any business and clients. The main focus of this document is to have a closer look at external factors that can affect any business and our customers.
Executive summary
Fortunately, the inflation rate rose with 0,1% to 4,8% in August. Retail trade decreased with 1,8% in July on a year-to-year basis. The unemployment rate eased slightly to 32,6% in the second quarter of 2023. The GDP growth for the second quarter was 0,6%. The Policy Uncertainty Index eased to 71,8 points in Q3 from a record high of 76,2 in Q2.
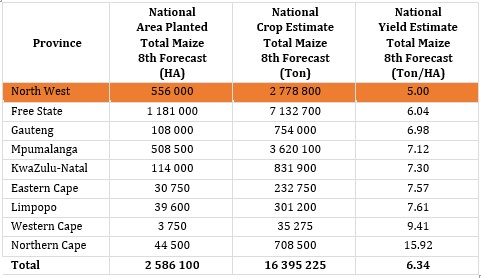
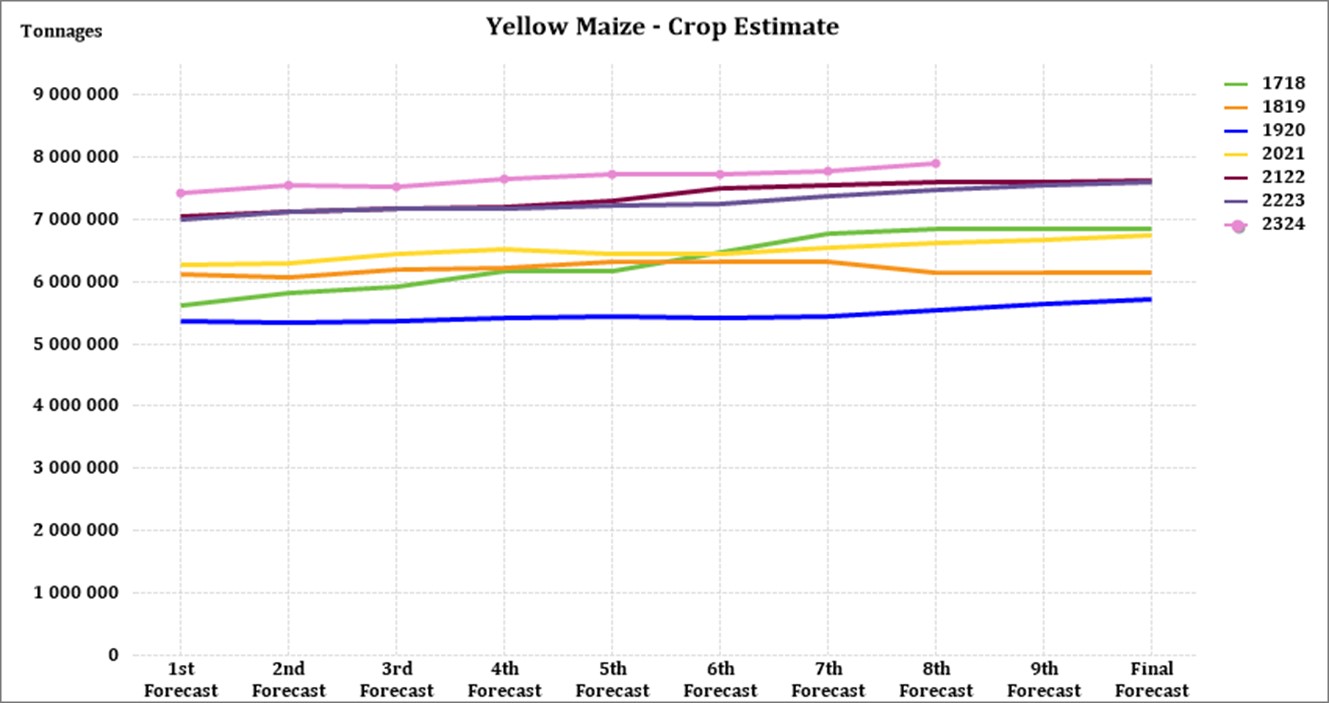
The National Agricultural Marketing Council (NAMC) projected the ending stock for 30 April 2024 of white and yellow maize to be less than the 2022/2023 season. According to the eighth maize forecast the three main maize producing areas, namely the Free State, Mpumalanga and North West are expected to produce 83% of the 2022/2023 crop.
During the previous Monetary Policy Committee (MPC) meeting held on 21 September the committee decided that interest rates will remain unchanged. The repo rate is currently 8,25% and the prime rate 11,75%.
Load shedding poses long term risks for the agricultural sector on a supply and input cost level. Cost-effective and sustainable alternative solutions must be considered in order to reduce the dependency on Eskom for electricity. With fuel prices sky rocketing and producers being more and more reliant on generators for electricity this is a disaster.
According to the World Economic Forum (WEF) the number one short term risk is cost of living despite the ease in inflation.
Business climate: Key risk drivers
A few highlights regarding certain risk drivers are mentioned below.
According to Trading Economics South Africa’s annual inflation rate rose to 4.80% in August of 2023 from 4.70% in the prior month, still at the upper limit of the South African Reserve Bank’s target range of 3% to 6%. Matching market estimates, after four consecutive months of decline.
Brent crude oil monthly average prices increased by $7,57 per barrel from August to September. South Africa’s retail trade decreased with 1,8% from a year earlier in July, matching the downturn observed in June, and worse than market forecasts of a 1,2% fall. This is the eighth consecutive month of decline in retail activity.
According to Statistics SA, South Africa’s unemployment rate eased slightly to 32,6%. In the second quarter of 2023, about 894 000 people were employed in primary agriculture, up 1% q/q and 2% y/y. This is the highest farm employment level since the last quarter of 2016 and is well above the long-term agricultural employment of 780 000.
The GDP growth rate rose to 0,6% on quarter for the second quarter in 2023. Eight of the ten activities picked up in the first quarter.
The local Safex price was considered unprofitable according to September 2023 white maize spot prices. According to the World Bank’s grain price index wheat and maize prices declined 8% in the first quarter. The war in Ukraine remains a major risk that could unsettle wheat, maize, oilseeds, and fertiliser prices. South Africa’s new season looks positive and it seems that Africa will once again have a high demand for maize which will support prices. Agricultural prices are forecast to decline by 7% in 2023 before stabilizing in 2024.
The next World Bank report will be released during October. Adverse weather patterns can reduce yields and also affect the Safex price; during September sea-surface temperatures rose further, moving toward an El Niño until at least February 2024. The solar cycle is approaching its turning point in 2025, which also indicates less rainfall predicted for coming years.
The Iron ore price saw a big increase of $13.72 per metric ton from August to September. Prices for iron ore cargoes with a 63.5% iron ore content for delivery into Tianjin fell below $120 per tonne from the five-month-high of $125.5 per tonne from September 15th.
The Policy Uncertainty Index (PUI) eased to 71,8 points in Q3 from a historical high of 76,2 points in Q2. While several contrary factors kept the PUI elevated, there were apparently enough positive ones to bring the PUI slightly lower although remaining well in the negative territory. The PUI is the net outcome of positive and negative factors influencing the calibration of policy uncertainty over the relevant period. It is seen to have important implications for business confidence and the investment climate in the country.
Sources
https://tradingeconomics.com/south-africa/inflation-cpi
https://tradingeconomics.com/commodity/brent-crude-oil
https://tradingeconomics.com/south-africa/unemployment-rate
https://www.agbiz.co.za/content/open/21-august-2023-agri-market-viewpoint-747
https://tradingeconomics.com/south-africa/gdpgrowth#:~:text=South%20Africa%20GDP%20Grows%201.2,expectations%20of%20a%200.7%25%20growth
https://www.statssa.gov.za/?page_id=737&id=1
https://tradingeconomics.com/commodity/iron-ore
NWU Business School Policy Uncertainty Index (PUI) 4Q 2022_09012023_pdf
https://openknowledge.worldbank.org/server/api/core/bitstreams/6864d537-d407-4cab-8ef1-868dbf7e07e2/content
PUI_2023Q3_29 September 203.pdf
Agbiz Confidence Index (ACI) rebounds in Q3, 2023
The Agricultural Business Chamber (Agbiz) quarterly conducts a survey in order to create an Agribusiness Confidence Index (ACI). The Agbiz/IDC ACI, which was released on 13 March 2023, reflects the perceptions of at least 25 agribusiness decision-makers on the ten most important aspects influencing a business in the agricultural sector.
These ten aspects are:
- turnover;
- net operating income;
- market share;
- employment;
- capital investment;
- export volumes;
- economic growth;
- general agricultural conditions;
- debtor provision for bad debt; and
- financing cost.
These aspects are used by agribusiness executives, policymakers and economists to understand the perceptions of the agribusiness sector. It also serves as a leading indicator of the value of the agricultural output while providing a basis for agribusinesses to support their business decisions.
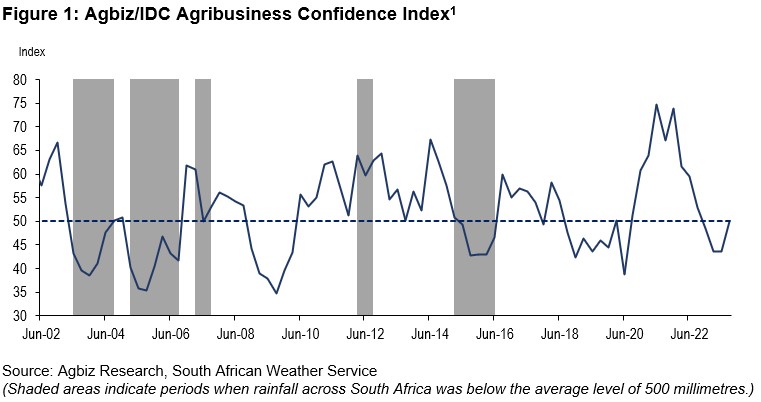
After remaining below the 50-point mark for three consecutive quarters, the Agbiz/IDC Agribusiness Confidence Index (ACI) rebounded by 6 points from Q2 2023 to 50 in Q3 2023. This improvement indicates that agribusinesses are cautiously adapting to the challenging operating business conditions in the country stemming from the numerous long-standing challenges such as deteriorating infrastructure, failing municipalities, intensified geopolitical tension, and persistent episodes of load-shedding. The readings above the neutral 50-point mark imply that agribusinesses are optimistic about business conditions in South Africa. This survey was conducted between the last week of August and the first week of September, covering businesses operating in all agricultural subsectors across South Africa.
The graph below shows the Agribusiness Index from 2002 to middle 2022.
The ACI is comprised of ten subindices, of which seven declined in the first quarter of 2023. The turnover subindex fell by 9 point to 74, while the net operating income subindex rose by 4 points to 59 points. Firms in the summer and winter grains, financial services and livestock mainly underpinned this optimism. The sentiment mostly mirrors the benefits of an ample agricultural harvest in the 2022/23 season.
The employment subindex lifted by 11 points to 59. This optimism is unsurprising as the sector recently registered an improvement in jobs. For example, about 894 000 people were employed in primary agriculture in the second quarter, up 1% q/q and 2% y/y. This is the highest farm employment level since the last quarter of 2016 and is well above the long-term agricultural employment of 780 000.
Confidence in the capital investments subindex increased by 19 points to 73. We suspect the sharp improvement in sentiment could be linked mainly to investment in renewables to cope with the intensified load-shedding. The data for other agricultural equipment, such as tractors and harvester sales, has declined slightly in recent months.
The sub-index measuring the volume of exports sentiment declined by 17 points to 43. This deterioration in sentiment signals the expected decline in export volumes this year from the robust levels of 2022, although the harvest is reasonably decent in all major crops and fruits. Ongoing worries about underperforming logistics could also be a cause for this pessimism.
Confidence in the general economic conditions increased by 16 points to 26. The recent positive growth figures for the year’s second quarter perhaps influenced the sentiment.
The general agricultural conditions subindex rose 8 points to 56 in Q3 2023. Favourable production conditions in the winter grains regions of the country mainly supported this increase. Still, there are growing concerns about the upcoming 2023/24 summer crop season due to the expected El Niño, although we suspect its impact will likely be mild.
The market share of the agribusiness subindex is up 2 points from Q2 to 59. The respondents that mainly underscored this improvement were primarily in the summer and winter grains, while other subsectors maintained an unchanged view from the last quarter.
The subindices of the debtor provision for bad debt and financing costs are interpreted differently from the abovementioned indices. A decline is viewed as a favourable development, while an uptick signals growing financial strain.
In the third quarter, the subindex for debtor provision for bad debt was up by 8 points to 41, which is unfavourable and signals a possible pressure in financing as businesses are possibly increasing borrowing to finance the alternative energy sources. Meanwhile, the financing costs indices fell by 1 point to 6, signalling that companies likely believe the interest rate hike cycle has ended.
In conclusion, the Agbiz/IDC ACI’s Q3 results show a slightly upbeat mood after the past three-quarters of deterioration in sentiment. “Still, the long-standing challenges of weakening municipalities, deteriorating roads, rising crime, inefficient logistics, and persistent load-shedding remain the major challenges that could undermine the sector’s long-term growth. These are aspects that both the government and private sector should collaboratively work to resolve to attract investments,” says Wandile Sihlobo, chief economist of the Agricultural Business Chamber of SA (Agbiz).
Source: www.agbiz.co.za, Issued by Wandile Sihlobo, chief economist: Agbiz, 19 September 2023
Weather and climate
NATIONAL ASSESSMENT
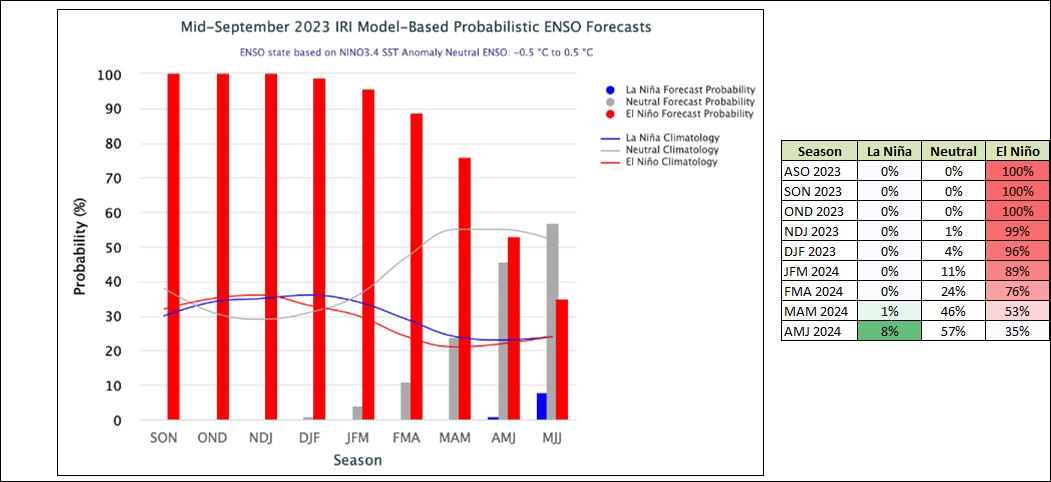
The El Niño-Southern Oscillation (ENSO) is now in an El Niño phase at 100%. The chance of an El Niño still being present in April 2024 is 76%.
A strong El Niño is predicted for the coming rainfall season as the likelihood percentages vary from 100% to 89% until March 2024. The impact of El Niño on the coming 2023/2024 season is predicted to not have such a severe impact as the previous three years experienced above-average rainfall, allowing for enough soil moisture to still produce average to above-average yields. The impact on the 2024/2025 season will be analysed based on the 2023/2024 rainfall received.
The Burea’s ENSO Outlook is at El Niño which means that El Niño is anticipated to continue until the southern hemisphere summer. Persistent values warmer than +0,8°C are typical of an El Niño.
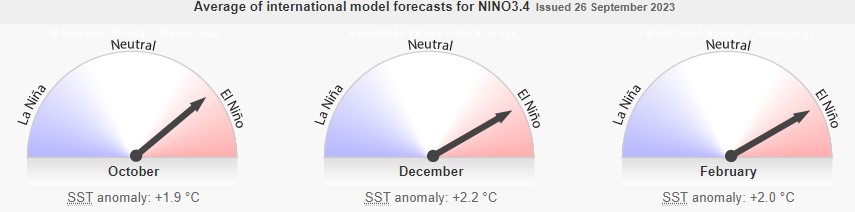
According to the graph below, ENSO is in an El Niño phase, and ocean temperatures near the equator are slowly starting to get warmer. The upward trajectory of the graph shows that there will be less rain than usual as temperatures rise.
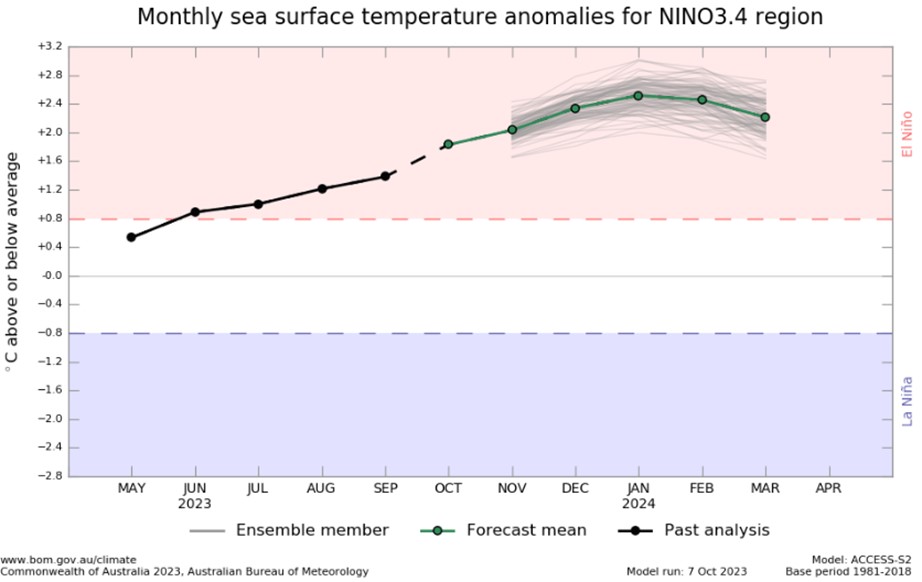
Source: Australian Government – Bureau of Meteorology
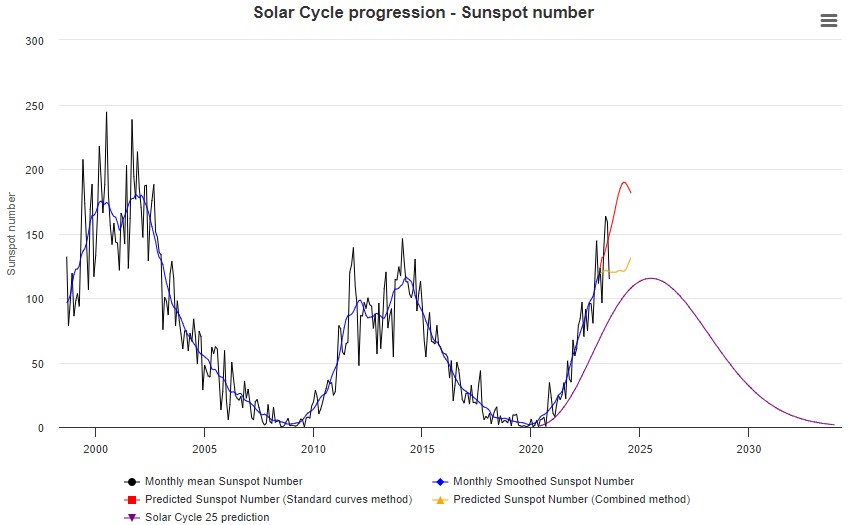
SUNSPOTS
Sunspots are darker, cooler areas on the surface of the sun that arise due to disturbances in the sun’s magnetic field. Every eleven years, the number of spots dotting the surface of the sun increases and decreases and forms the solar cycle.
Sources
https://www.sciencedirect.com/science/article/abs/pii/S136468262200116X#:~:text=It%20was%20observed%20that%20rainfall,an%20increasing%20effect%20on%20rainfall
https://www.space.com/solar-cycle-frequency-prediction-facts May 27, 2022
https://eos.org/articles/why-did-sunspots-disappear-for-70-years-nearby-star-holds-clues 10 June, 2022.
According to science direct the rainfall rate is directly related to the sunspot number but shows different characteristics during solar maximum years. Though a lag correlation exists between sunspot number and rainfall, sunspots have an increasing effect on rainfall. Studies show that the more sunspots are present the higher the rainfall and the less sunspots the lower the rainfall.
ENSO occurs at irregular interval between three and seven years causing global climate system variation. Considering this event occurs periodically, it might be triggered by the eleven years of solar cycle as an energy source.
The graph below shows the eleven year solar cycles since before the 2000s. As the graph is in an upward trajectile higher rainfall can be expected – La Niña. As the graph reaches its turning point and moves in a downward trajectile less rainfall is expected characteristic of an El Niño.
The last three years were La Niña years and as the graph is approaching its forecasted turning point in 2025 an El Niño can be expected for the coming years. ENSO indicators are currently at ENSO-alert levels as the current El Niño is expected to continue through to Spring. In July and August 2023, the actual sunspot numbers exceeded the predicted values and the predicted range, indicating that the current phase of increasing sunspots is associated with more rainfall, while a decreasing phase typically corresponds to less rainfall.
One could make the assumption that ENSO-neutral conditions start to develop as the number of sunspots are close to reaching their maximum for the solar cycle and then turn towards El Niño as the sunspots get less and the graph is in a downward trajectile.
Market risk
GRAIN MARKET ANALYSIS
• Ending stock – national
Ending stock data is gathered from the NAMC. The estimates are reassessed and reported by the Grain and Oilseeds Supply and Demand Estimates Committee. The following is the projected ending stock for April 2024 in tonnages for the 2023/2024 season:
- White maize => 1 615 200 t
- Yellow maize => 1 201 257 t
The following is a summary of September 2023 ending stock estimates for the 2022/2023 season:
- Wheat => 568 383 t
The following is a summary of the February 2024 projected final ending stock for the 2023/2024 season:
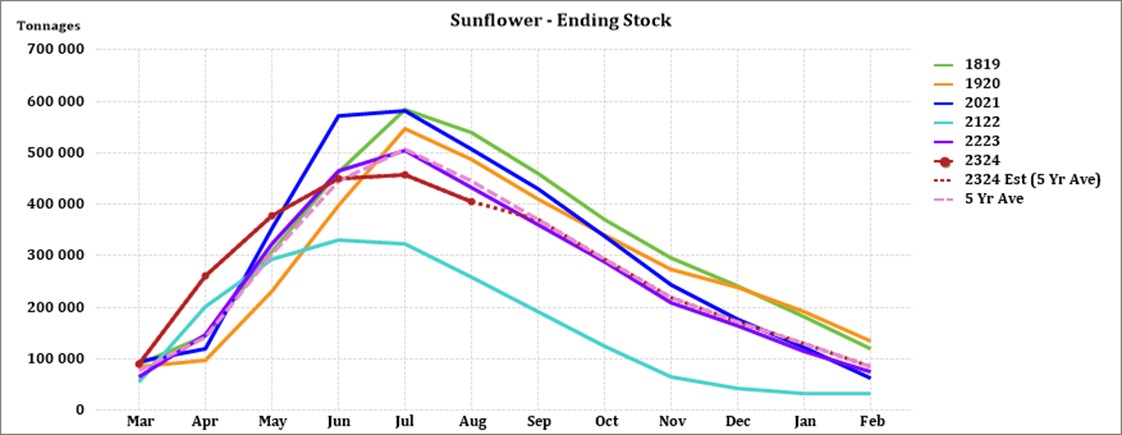
- Sunflower => 69 157 t
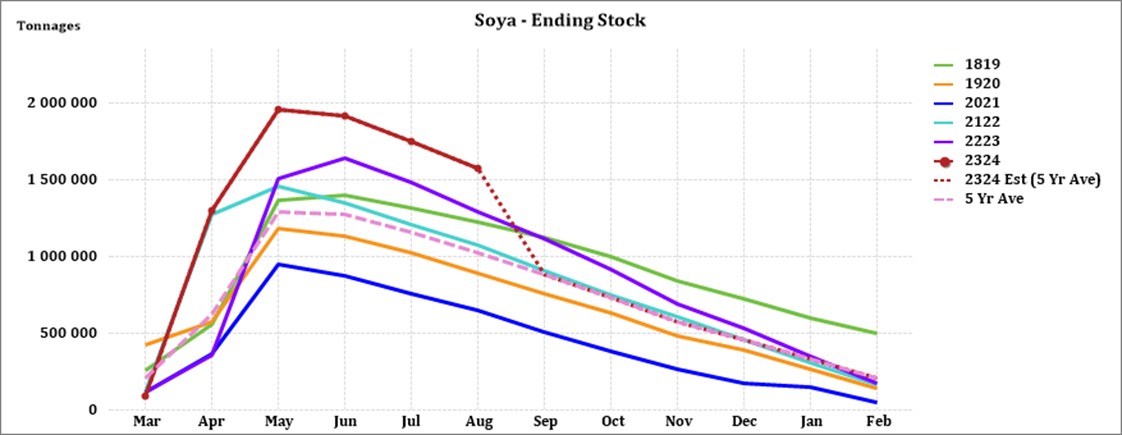
- Soybeans => 434 147 t
- Sorghum => 24 936 t
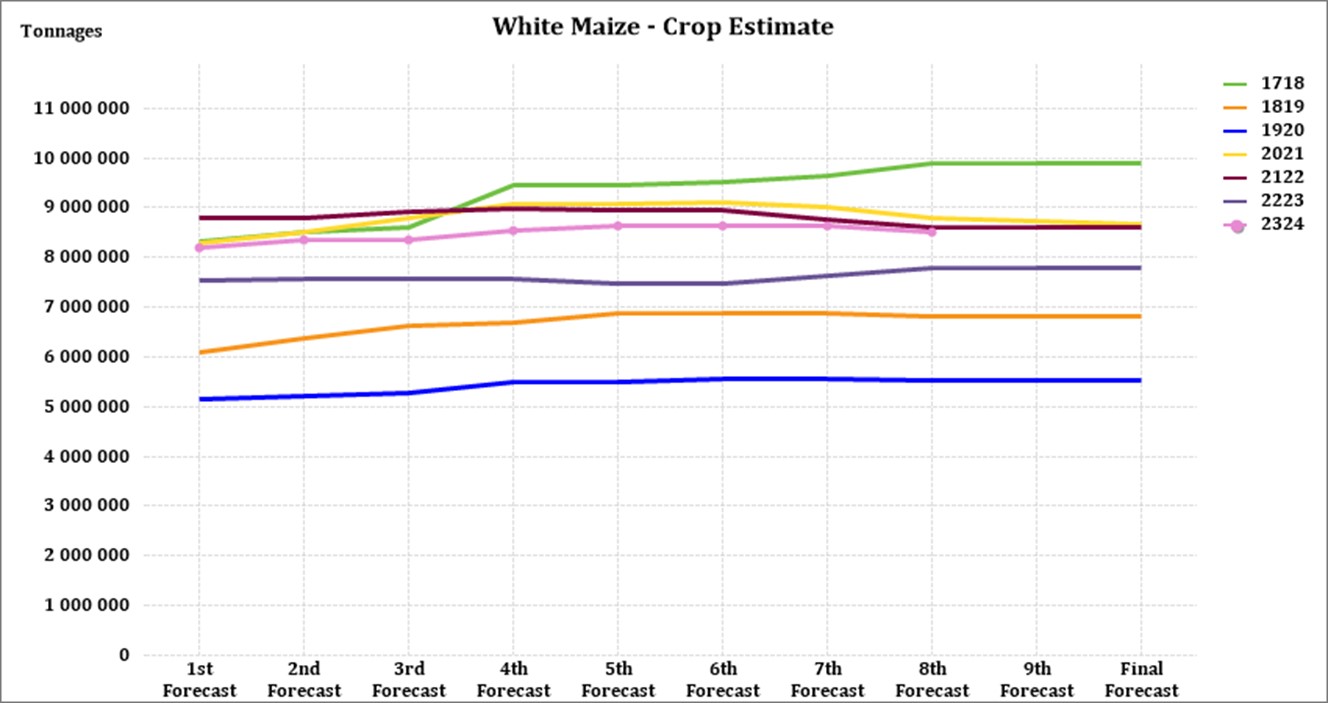
The graphs below show the predicted ending stock for the different commodities according to SAGIS data. A five-year average has been calculated to determine the estimated ending stock for the current season. The predicted white maize in April 2024, is 152 578 t more than the final for the 2022/2023 season. Yellow maize shows a 134 761 t decrease in ending stock compared to the previous season.
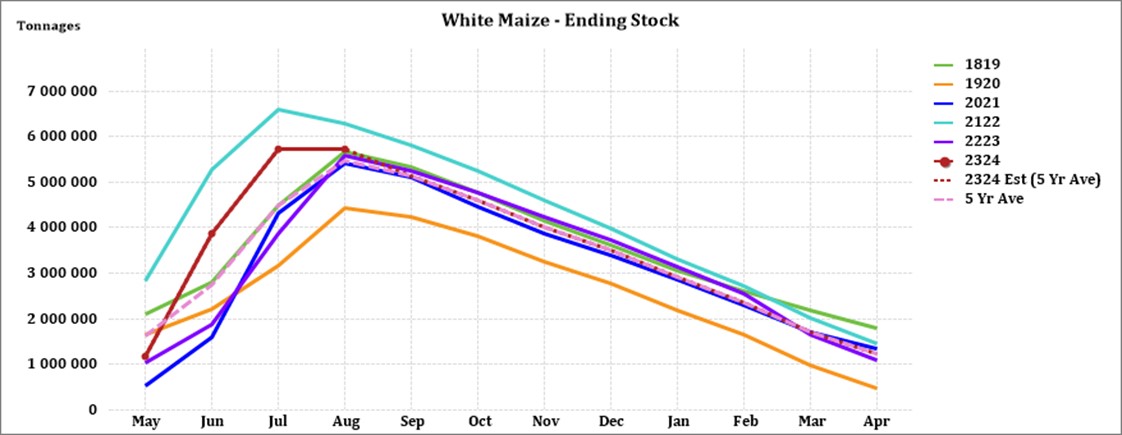
Source: Sagis
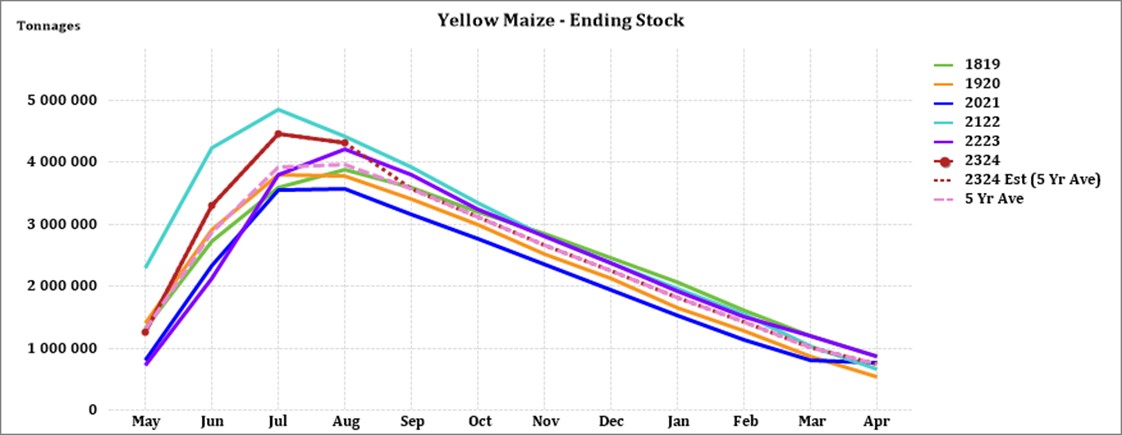
Source: Sagis
Source: Sagis
The forecasted soybean ending stock for February 2024 is 33 510 t more than February 2023.
Source: Sagis
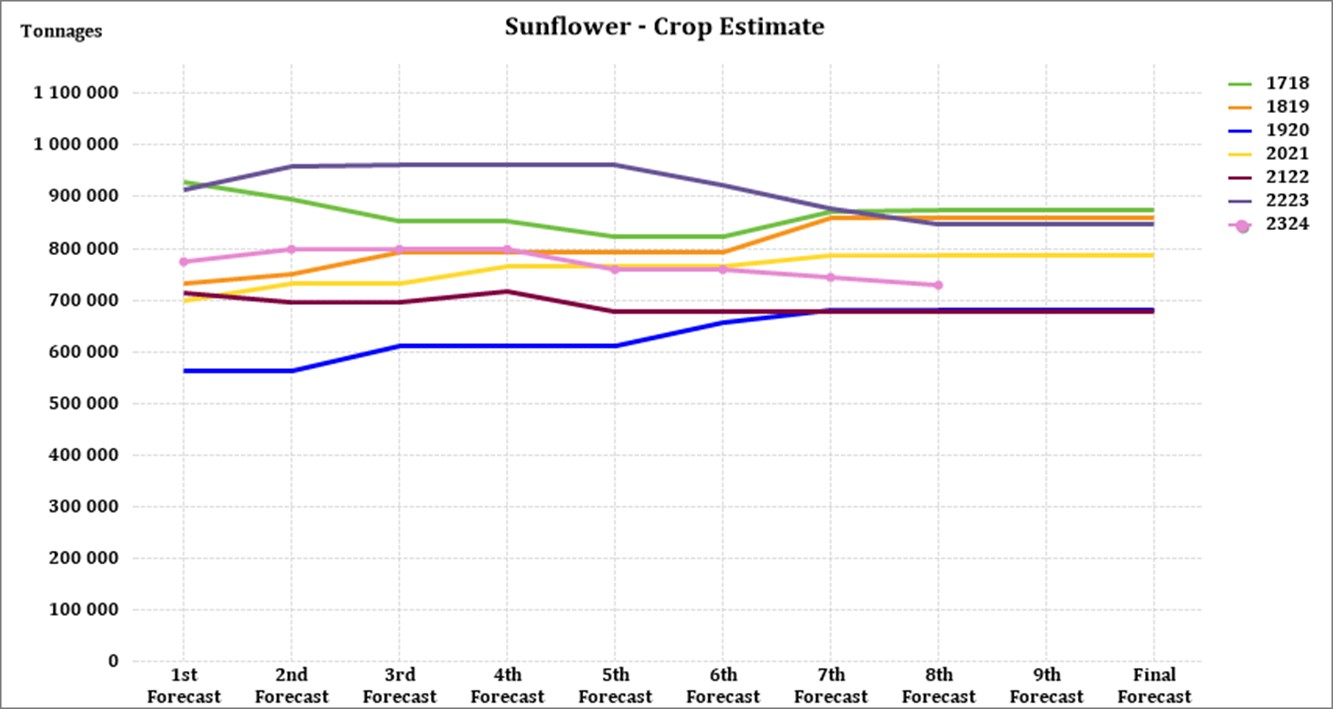
The forecasted sunflower ending stock is 10 835 t more than the previous season ending stock.
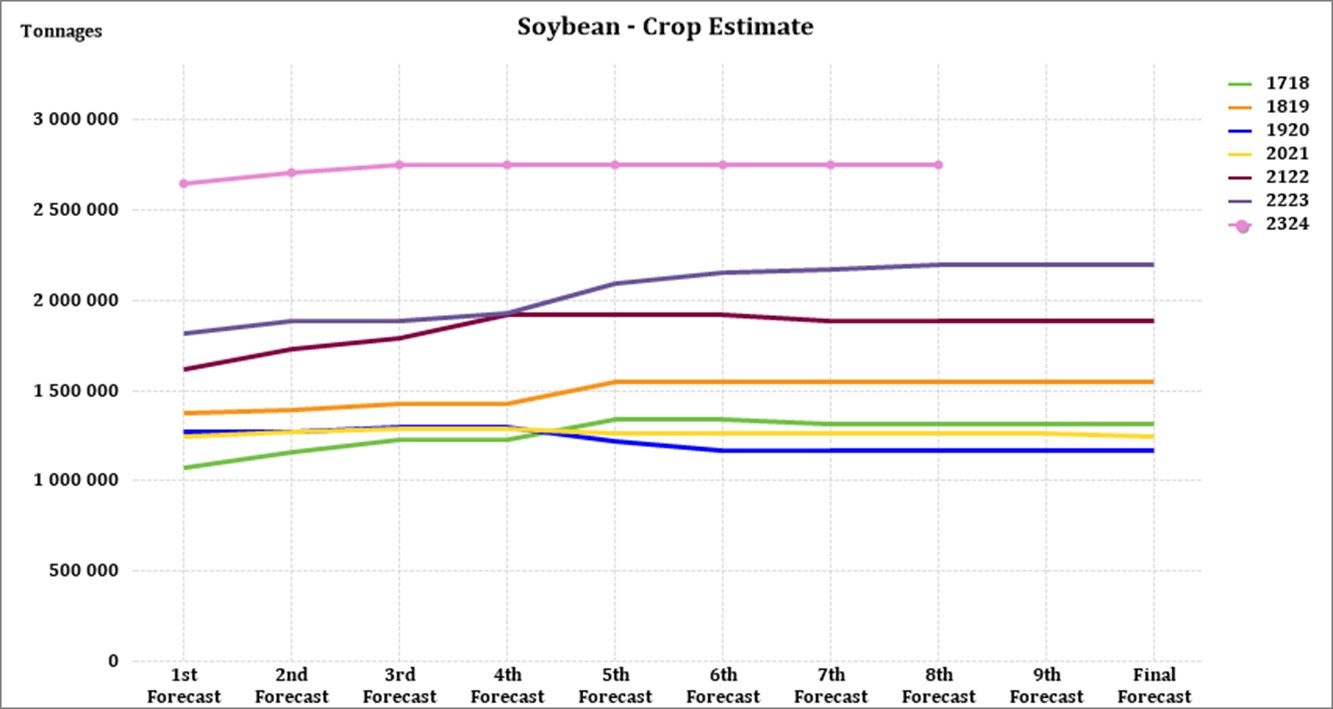
• Crop estimations
According to the Crop Estimate Committee (CEC) production forecast for 2023, the area estimate for maize is 2,586 million ha, which is 1,4% less than the actual 2,623 million ha planted for the previous season.
Although less hectares are planted to maize the harvest is estimated at 16,4 million tonnes, 6% higher than the previous season’s harvest and the second-largest harvest on record.
Source: CEC (Crop Estimates Committee)
Source: CEC (Crop Estimates Committee)
Source: CEC (Crop Estimates Committee)
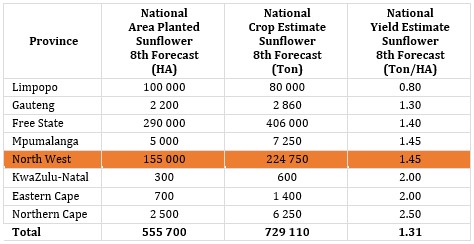
The area estimate for sunflower seed is 555 700 ha, which is 17% less than the 670 700 ha planted the previous season.
Source: CEC (Crop Estimates Committee)
It is estimated that 1 148 300 ha have been planted to soybeans, which represents an increase of 24,10% compared to the actual 925 300 ha planted last season. This is the largest soybean area planted in the history of South Africa. Soybean harvest could reach a record 2,8 million tonnes according to Wandile Sihlobo, Chief Economist at Agbiz.
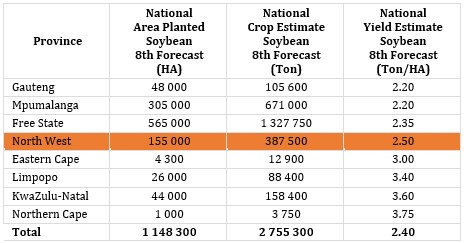
Source: CEC (Crop Estimates Committee)
Source: CEC (Crop Estimates Committee)
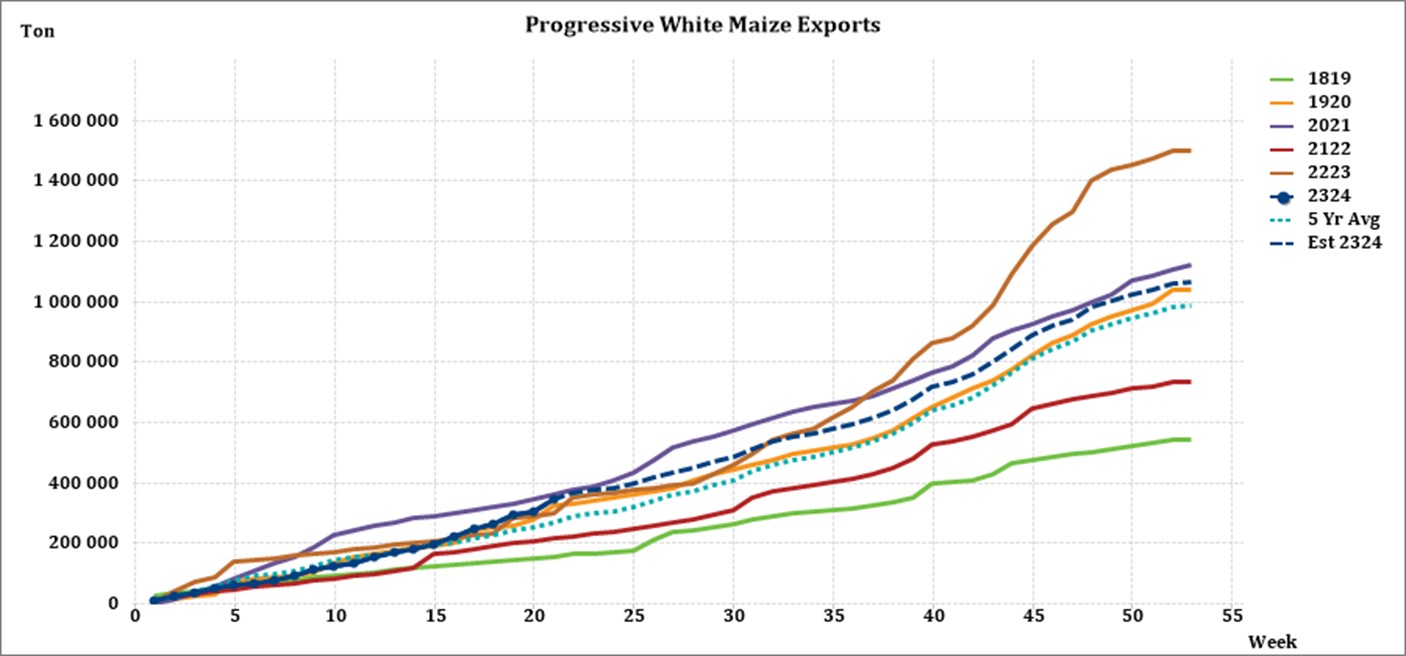
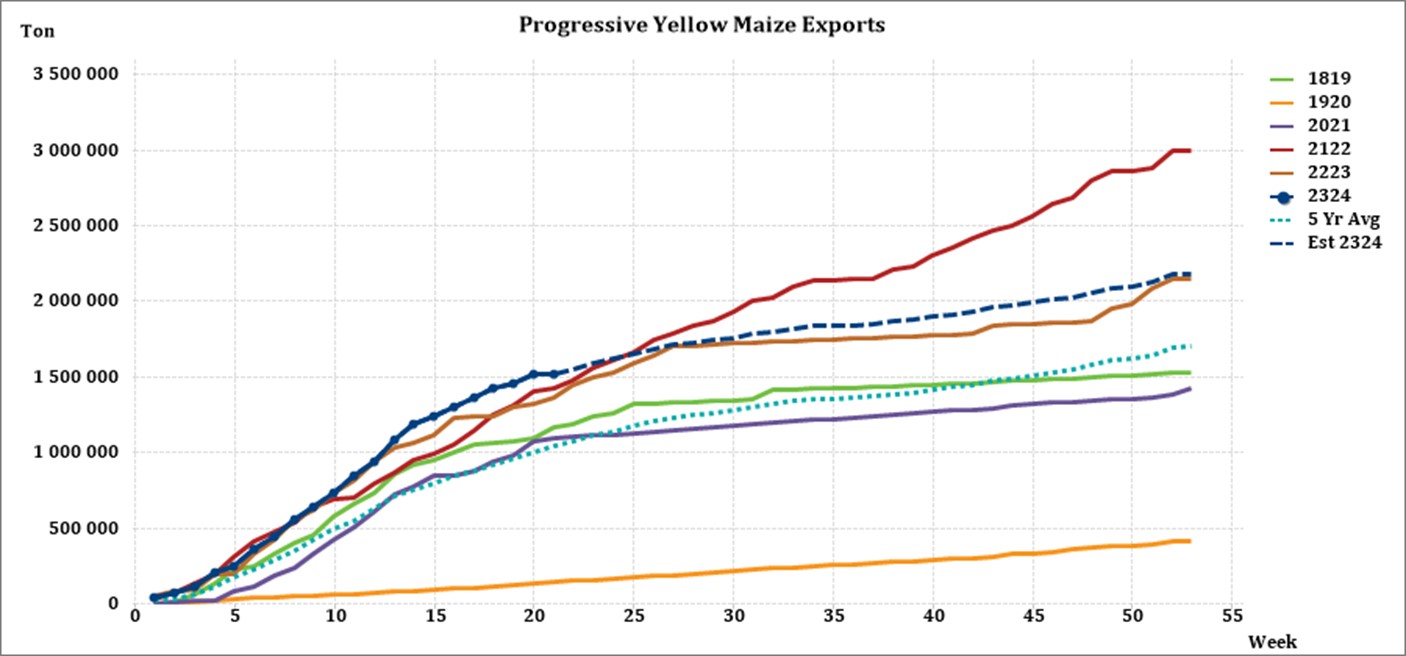
• Imports and exports – national
For the production season ending April 2024, 348 566 tons of white maize and 1 522 115 tons of yellow maize have been exported to date (week 21 of 52) as seen in the graphs below. In the 2021/2022 season, a record number of 2 991 129 tons yellow maize was exported. This was mainly due to South Africa’s competitive export parity prices compared to the rest of the world.
Source: Sagis
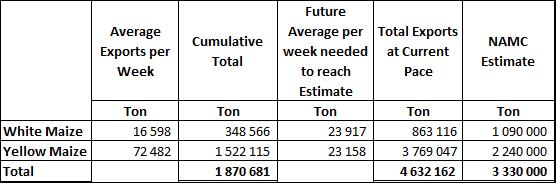
As seen in the table above, the average white maize exports per week are currently 16 598 tons. If theoretically, white maize exports remain at the current average per week then there would be 226 884 tons less white maize exports than anticipated.
The average yellow maize exports per week are currently 72 482 tons. If theoretically, yellow maize exports remain at the current average per week then there would be 1 529 047 tons more yellow maize exports than anticipated.
Source: Sagis
• Parity prices
South Africa is a small producer compared to other countries and is thus a price taker (meaning that we cannot influence world prices). Because of this, our local prices are normally between import and export parity, which is illustrated in the graph below. An import parity price is defined as the price which a buyer will pay to buy the product on the world market. This price will include all the costs incurred to get the product delivered to the buyer’s destination.
An export parity price is defined as the price that a local seller could receive by selling his product on the world market e.g., excluding the export costs. The price which the seller obtains is based on the condition that he delivers the product at the nearest export point (usually a harbour) at his own expense.
The graph below reflects the Safex price, import parity and export parity of yellow maize as well as the Safex price of white maize. The import and export parity prices for white maize are not released by Grain SA for this period.

Source: Grain SA
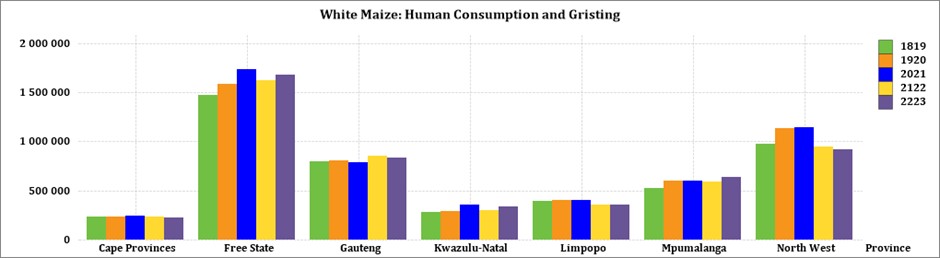
• Producer deliveries – provincial
For the marketing year which is May to April (2022/2023) the Free State dominates the white maize which is used for human consumption and gristing. North West showed a decrease in white maize human consumption for the year ending April 2023 compared to the previous year.
Source: Sagis
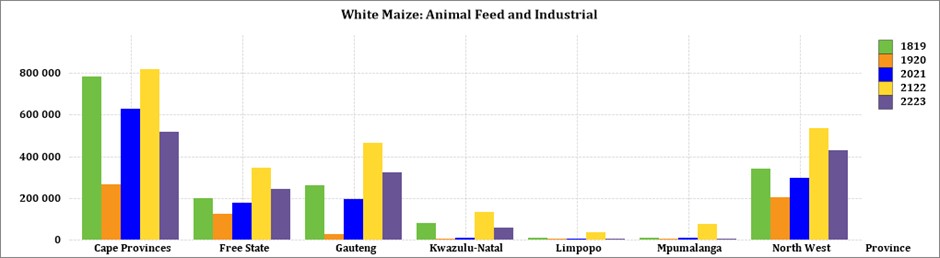
The Cape provinces used the most white maize for animal feed and industrial usage.
Source: Sagis
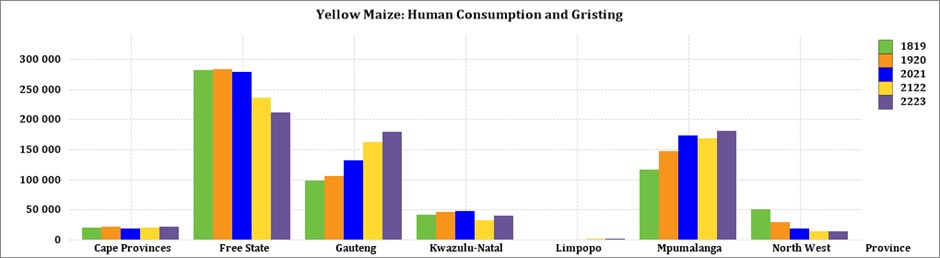
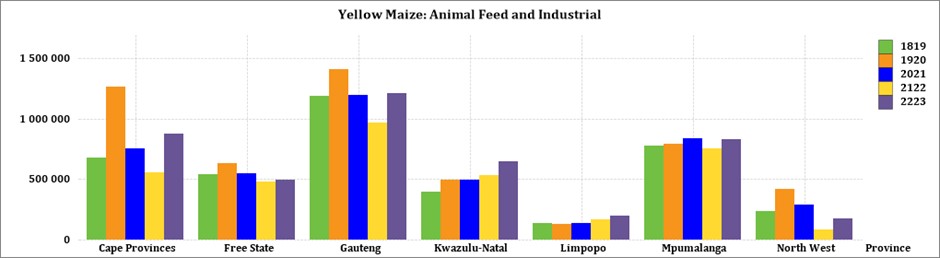
The Free State processed the most yellow maize for consumption and gristing during the thyear ending April 2023. For the same period Gauteng processed the most yellow maize for animal feed and industrial purposes.
Source: Sagis
Source: Sagis
• Exchange rate
NWK Group is exposed to foreign exchange rate risk on various business areas, such as commodity prices and trade imports.
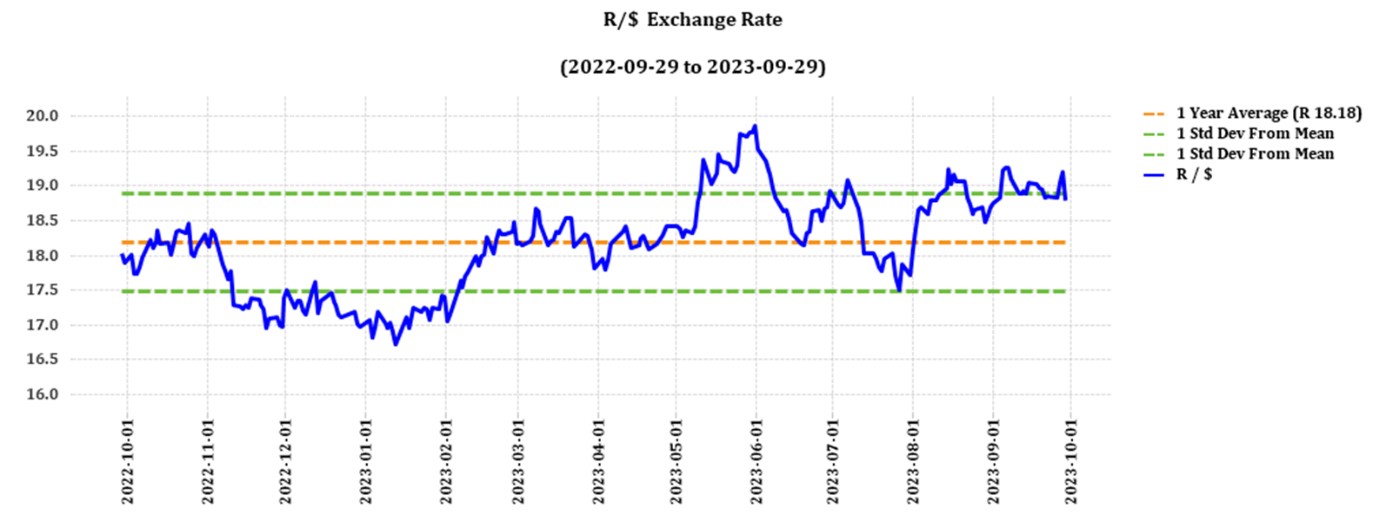
Source: Standard Bank, Corporate and Investment Banking & SARB
On a monthly average basis, the rand appreciated against the US dollar by 1,17% (0,22c) over the period August to September. The one-year average for rand/US dollar as on September 2023 is R18,36. Moreover, the average rand/US dollar exchange rate for September was R18,98 compared to R18,76 in August.
Exchange rate forecast:
The graph below shows the actual USD/ZAR for 2022 Quarter 4 (Q4) to 2023 Quarter 4 (Q4) against the forecasted figures.
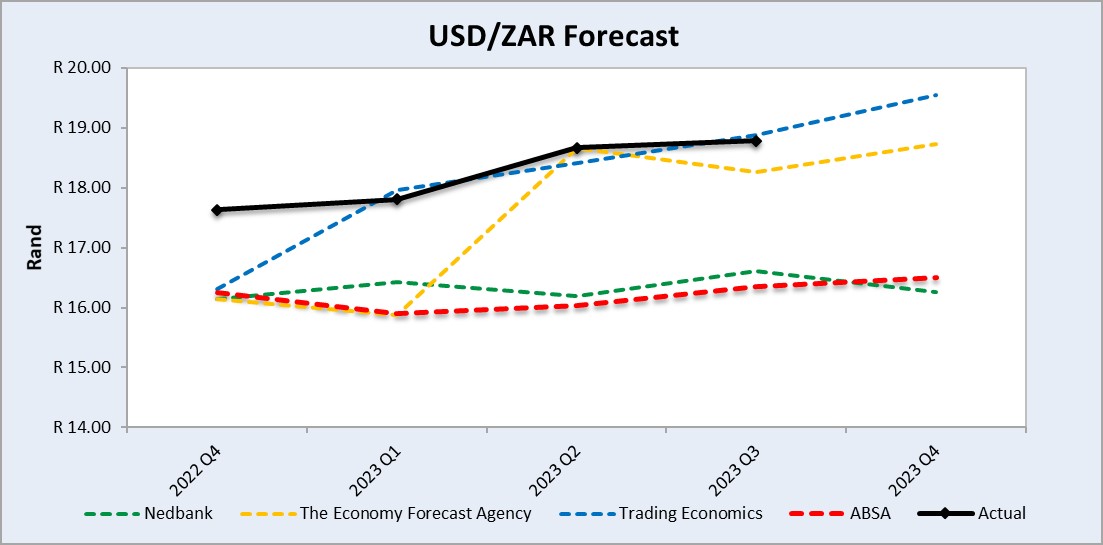
Source: Nedbank CIB; Absa; The Economic Forecast Agency; Trading Economics
• Interest rate risk
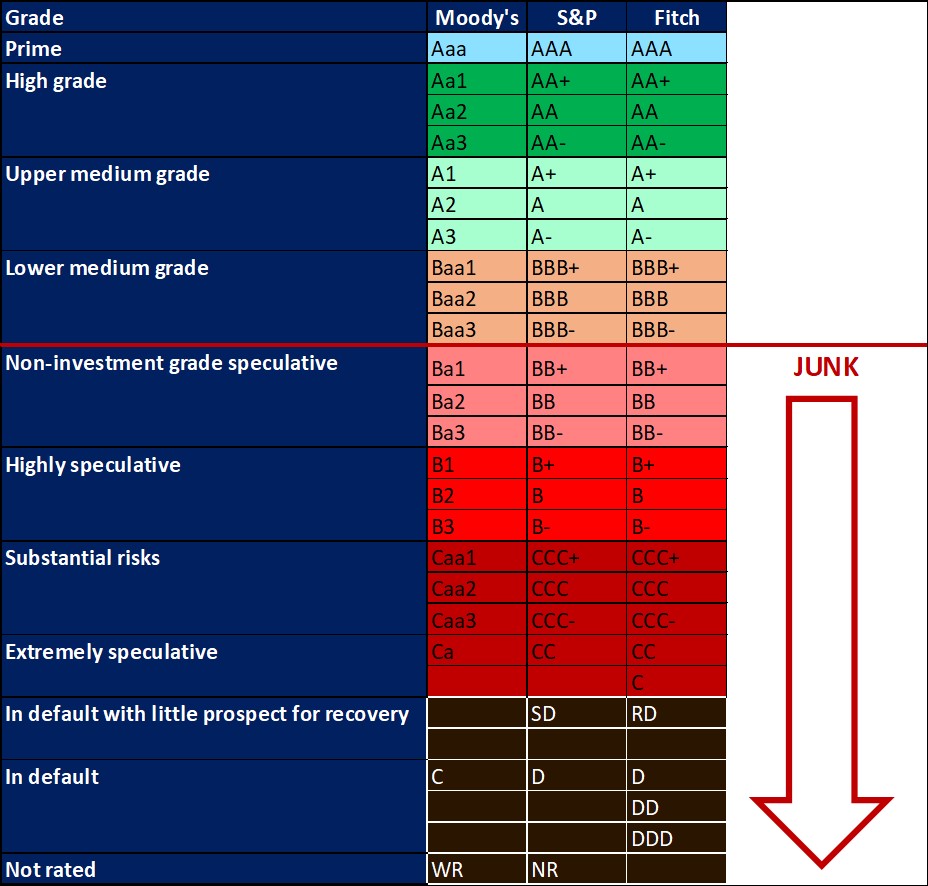
On 27 March 2020, Moody’s downgraded South Africa’s sovereign credit rating to sub-investment grade and placed a negative outlook on the rating. The key drivers for this downgrade include weak economic growth, continuous deterioration in fiscal strength, and slow progress on structural economic reforms. It is now the first time in post-apartheid South Africa where all major rating agencies, i.e.. Moody’s, Fitch and S&P, have South Africa’s credit ratings in sub-investment grade territory. More than a year later and Moody’s rating remains the same.
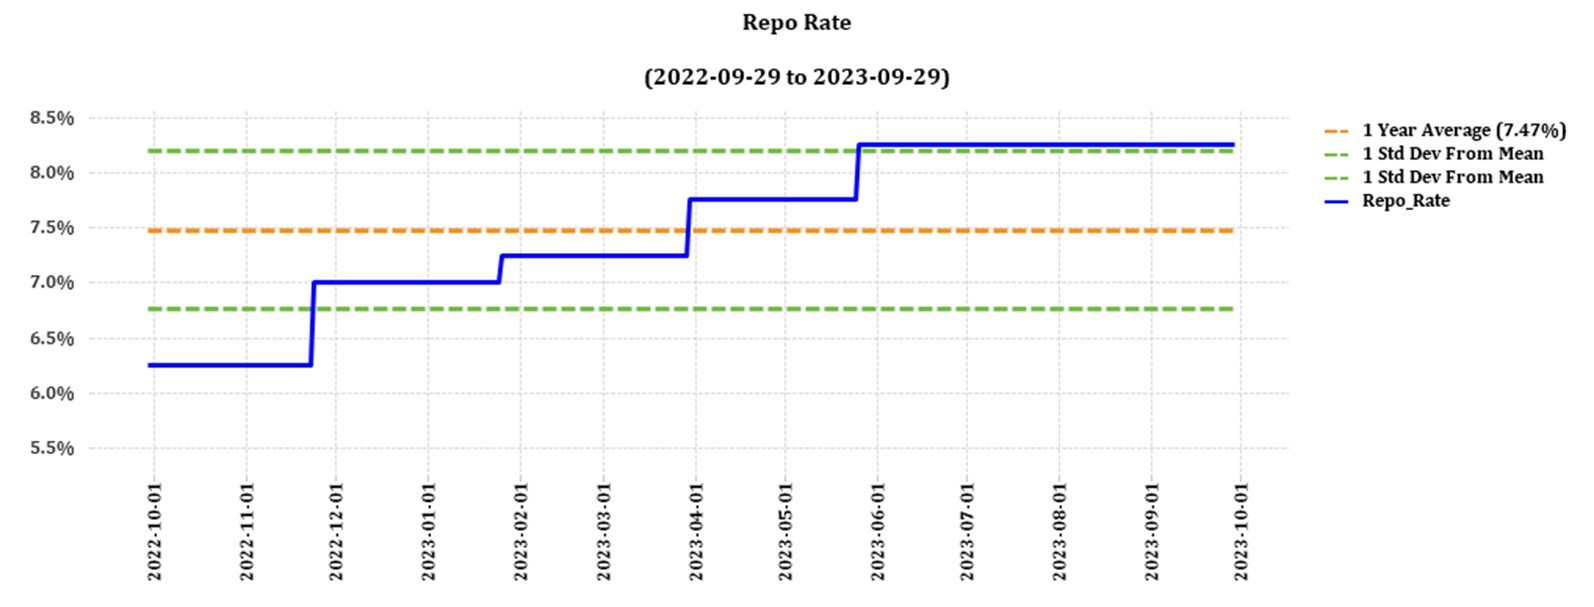
During the previous Monetary Policy Committee (MPC) meeting held on 21 September the committee decided that interest rates will remain unchanged. The repo rate is currently 8,25% and the prime rate is 11,75%. The South African Reserve Bank made several interest rate cuts to bring relief to the economy after Covid-19, but since November 2021 borrowing costs rose again by a cumulative 475 bps. The next MPC meeting date is 23 November 2023.
Interest rate movement:
- 19 May 2022: 8,25%
- 21 July 2022: 9,00%
- 22 September 2022: 9,75%
- 24 November 2022: 10,50%
- 26 January 2023: 10,75%
- 30 March 2023: 11,25%
- 25 May 2023: 11,75%
- 20 July 2023: 11,75%
- 21 September 2023: 11,75%
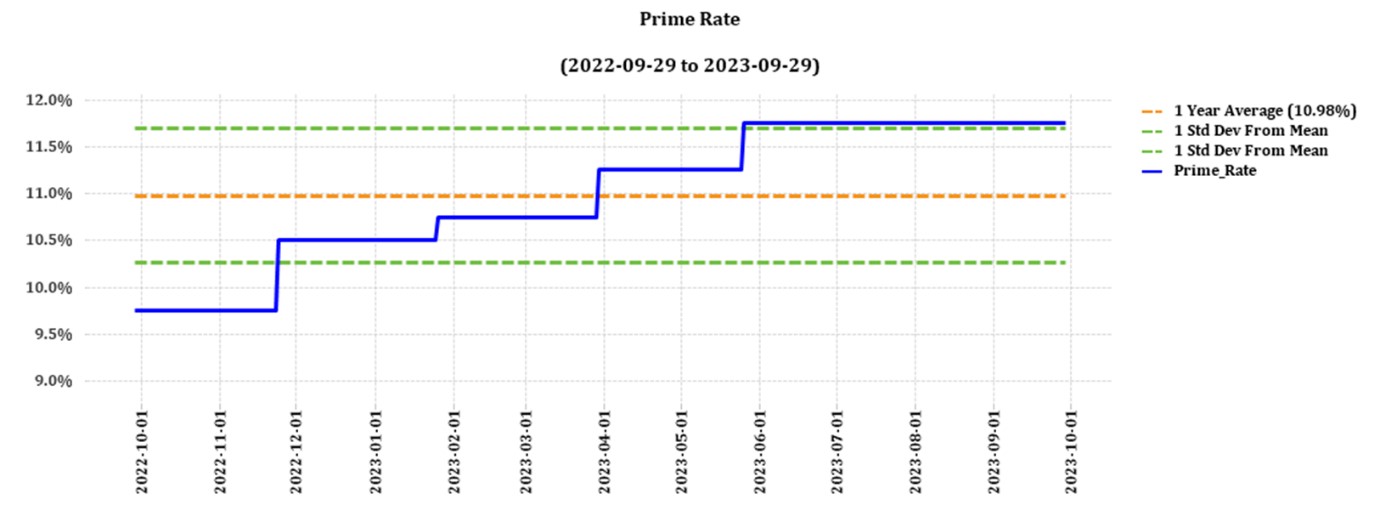
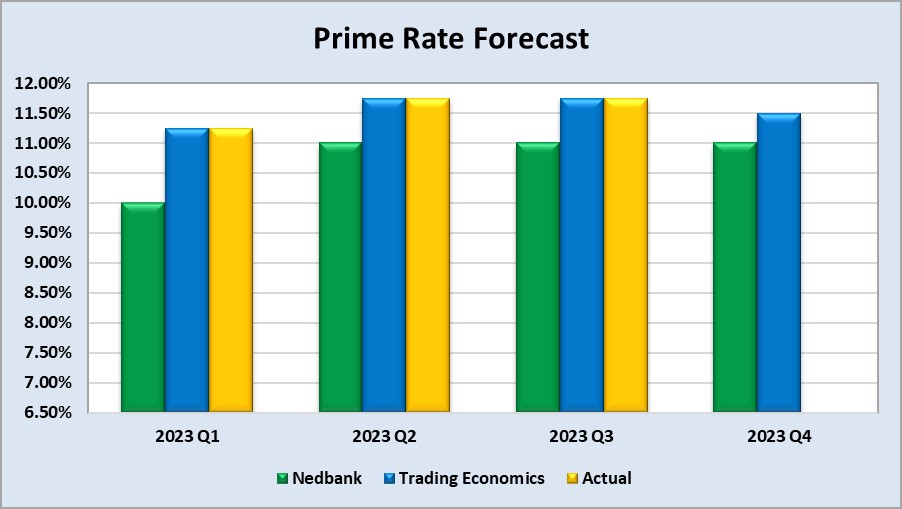
The following graph shows the prime rate forecast for 2023 Quarter 1 to 2023 Quarter 4. Both Q1 and Q2 experienced higher interest rates than anticipated by Nedbank.
Inflation rate
As the inflation rate is a driver for increases and decreases in interest rates the current rate and forecast have to be assessed to foresee further increases in the interest rate.
Current
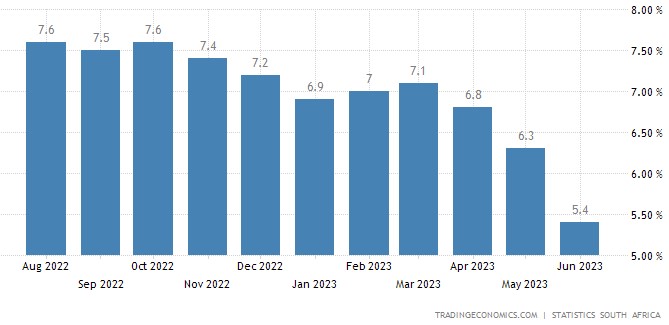
South Africa’s annual inflation rate was at 4,8% in August 2023, matching market estimates, after four consecutive months of decline. Still, it remains within the South African Reserve Bank’s target range of 3% to 6%. Prices accelerated mostly for housing & utilities (5,5% vs. 5,1% in July), on account of electricity and other fuels (15,1%) and water and other services (6.9%) following increases in municipal tariffs; and restaurants & hotels (6,4% vs 5,2%). At the same time, transportation prices fell much slower (-0,8% vs. -2,6%).
Meanwhile, food inflation softened for a fifth month (8% vs. 9,9%). The annual core inflation, which excludes prices of food, non-alcoholic beverages, fuel and energy, also edged higher to 4,8% in August, up from a ten-month low of 4,7% in the prior month and slightly above market forecasts of 4,7%.
On a monthly basis, consumer prices went up by 0,3% in August, after a 0,9% rise in July and slightly above market estimates of a 0,2% increase.
Source: Statistics South Africa
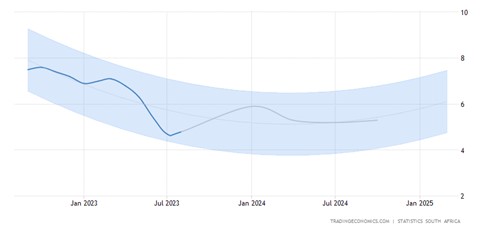
Inflation rate forecast
According to Trading Economics’ global macro models and analysts’ expectations, the inflation rate in South Africa is expected to be 5,20/c by the end of this quarter. In the long term, according to our econometric models, the South Africa Inflation Rate is projected to trend around 5,10/c in 2024 and 4,50/c in 2025.
Russian Federation’s Suspension of Participation in Black Sea Grain Initiative
Food and fertiliser prices might spike as Russia refused to renew the agreement that allowed Ukraine to export grain through the Black Sea without being attacked by Russia on Monday, 17 July. The risk of food prices rising and grain exports from Ukraine through the Black Sea being halted may place over 100 million people into poverty.
According to the World Food Programme, pre-war Ukraine produced enough food to feed 400 million per year. The UN says the deal allowed the WFP to transport more than 725 000 tonnes of wheat to help people in need in countries hit by wars and extreme weather events. The deal also helped reduce food prices by over 23% since March 2022, according to the United Nations.
Because of the situation more and more insurance companies do not want to insure ships travelling to and from Ukraine. World leaders are urging Russia to rejoin an agreement that safely delivered Ukraine’s grain worldwide and stabilized food prices.
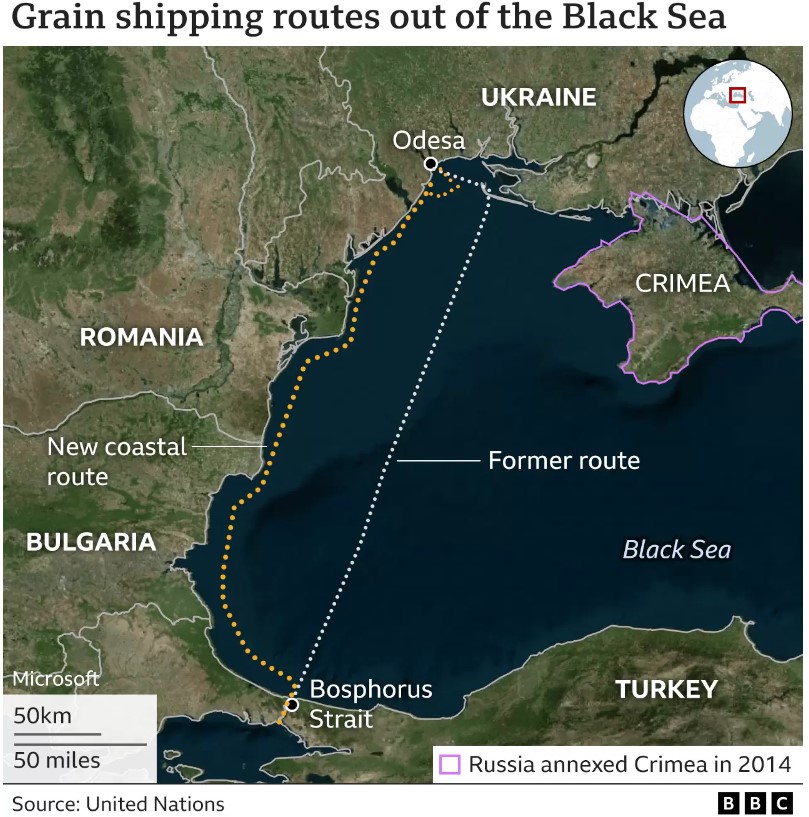
During September, two ships have left a Ukrainian port on the Black Sea, carrying grain:
- a small cargo vessel called Resilient Africa
- a full-size vessel called the Aroyat
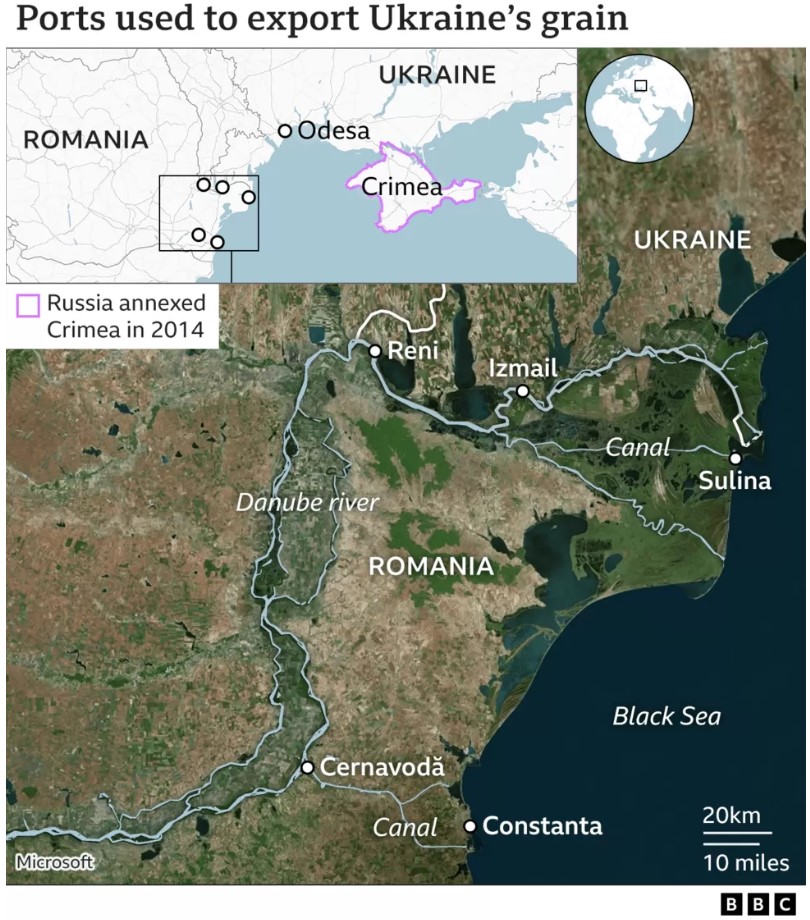
Both ships travelled around the western coast of the Black Sea – through Romanian and Bulgarian territorial waters – to be safe from Russian attack. This route was previously used as a humanitarian corridor, to allow passage for empty ships which had been trapped in Ukraine’s Black Sea ports since the start of the conflict. Ukraine has also been exporting an increasing amount of grain from Reni and Izmail, on the Danube river.
Sources
https://www.bbc.com/news/world-61759692
https://www.aljazeera.com/news/2023/7/17/as-russia-exits-grain-deal-which-countries-will-be-affected
https://www.politico.eu/article/russia-ukraine-war-black-sea-grain-ships-insurers/
https://lu.usembassy.gov/world-leaders-call-on-russia-to-rejoin-black-sea-grain-deal/
• Highlights in the agrochemical sector
Between 30% and 50% of a grain and oilseed farmer’s existing input costs are spent on fertiliser. International fertiliser prices continue to decrease, as weaker rand offsets some of the reduction in local costings.
On a month-to-month basis fertiliser prices started to rise once again as China, the biggest producer of urea, imposes export ban. China ordered some manufacturers to stop exports and this caused prices of Urea to surge globally. Urea prices have risen by 10% in September and 30% since July after China banned the export of the fertilizer to keep domestic prices under control.
China is currently the largest glyphosate supplier in the world. The dynamics of China’s glyphosate greatly impacts the global supply structure, over 80% of glyphosate produced in China is exported, to more than 20 destinations in the world. In China, on a month-to-month basis, prices (Doller terms) of most herbicides, insecticides and fungicides were mostly on a upward trend from July 2023 to August 2023. According to the tables in this report, glyphosate (95%) (dollar terms) increased by 36,3% from July 2023 to August 2023. The depreciation of the rand over a period of a year definitely plays a role and might have higher local prices as effect.
Source: Cnchemicals
With the weak rand, South Africans are going to feel the impact of global rising fertiliser prices. The Northern Hemisphere is approaching their winter and the demand for natural gas will increase. Natural gas on the other hand is a raw material used to produce ammonia. Higher demand for natgas will cause prices to rise increasing the price of fertiliser (ammonia).
Sources
https://www.dtnpf.com/agriculture/web/ag/crops/article/2023/07/17/wholesale-fertilizer-prices-fall
https://sagrainmag.co.za/2023/04/13/kunsmispryse-se-neus-wys-effens-afwaarts/
https://www.agricultureportal.co.za/index.php/agri-index/68-crops/9643-sharp-rebound-in-rand-helps-lower-local-fertilizer-costs
https://www.agricultureportal.co.za/index.php/agri-index/68-crops/9730-weakening-rand-magnifies-rising-local-fertilizer-prices
https://e.vnexpress.net/news/business/industries/fertilizer-prices-surge-after-china-imposes-export-ban-4657524.html
https://www.icis.com/chemicals-and-the-economy/2023/09/food-prices/
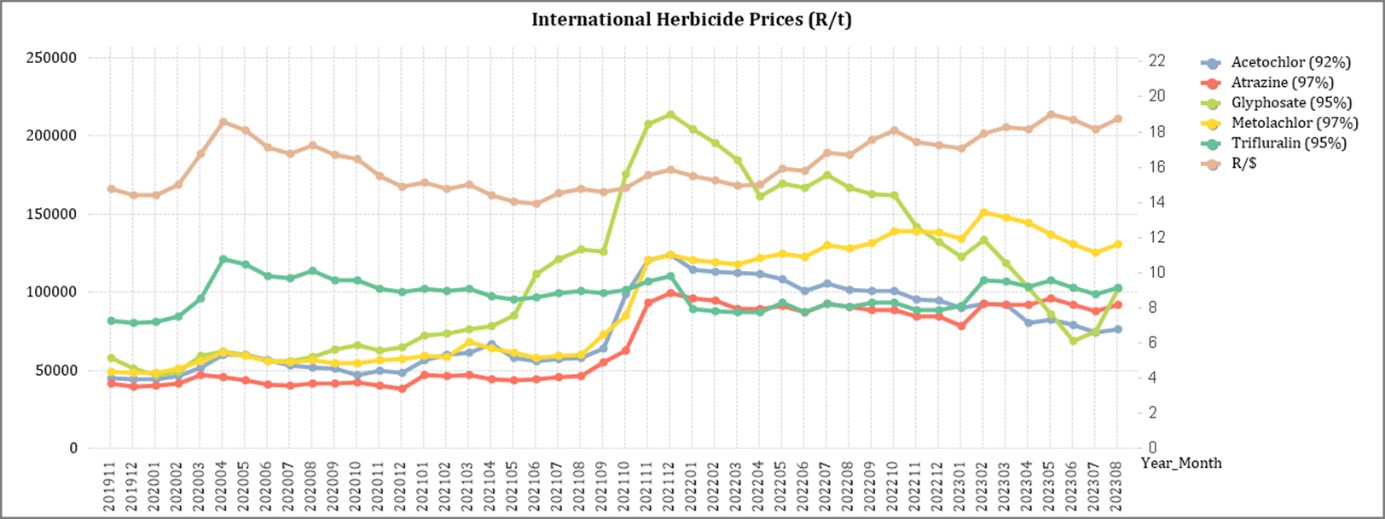
Herbicides
The following products are the main products regarding herbicides that may have an impact on input costs for producers:
- Glyphosate (95%)
- Acetochlor (92%)
- Atrazine (97%)
- Metolachlor (97%)
- Trifluralin (95%)
The following comparison is from the September 2023 Grain SA report which reports the previous month’s prices.
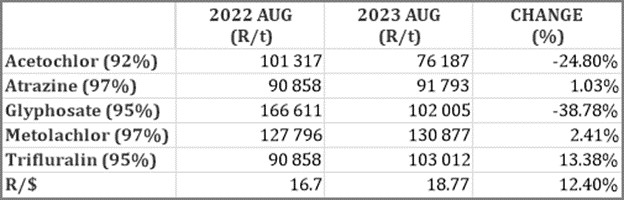
In comparison with the previous year’s prices, four of the five main products experienced a decrease in prices. Glyphosate had the biggest decrease with 38,78%.
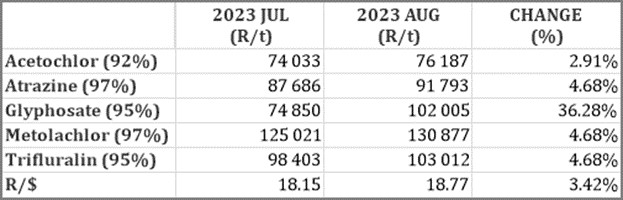
Unfortunately for the two months compared all of the products experienced a price increase with Glyphosate experiencing the highest increase of 36,28%.
The graph below shows the international herbicides prices (R/t) per product from November 2019 to August 2023.
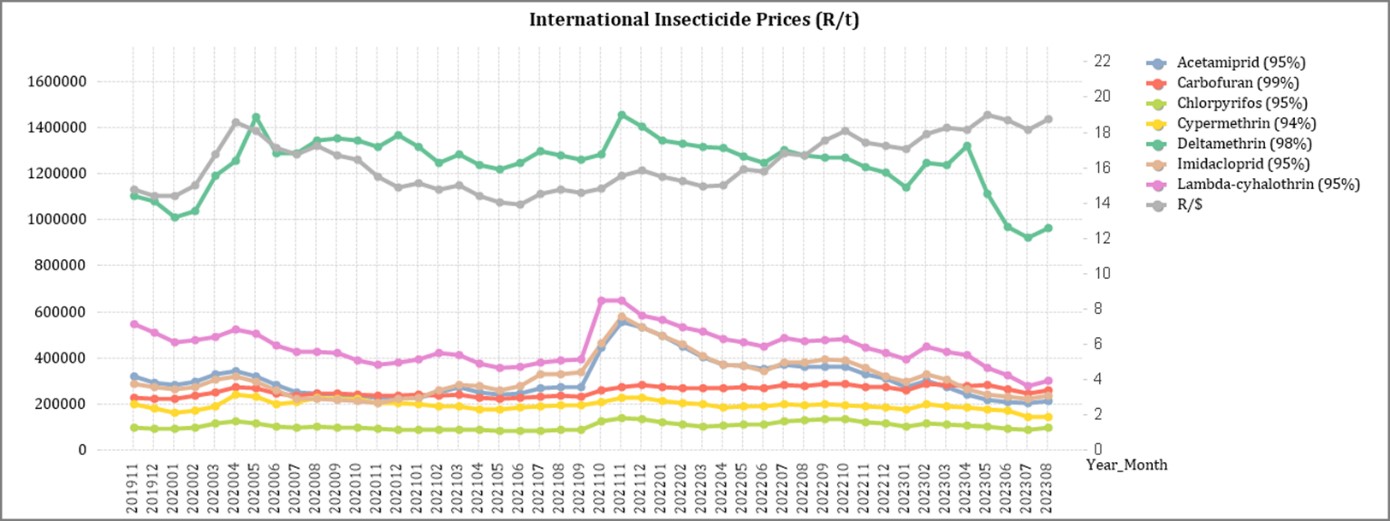
Insecticides
The following products are the main products regarding insecticides that may have an impact on input costs for producers.
Imidacloprid (95%)
Lambda-cyhalothrin (95%)
Carbofuran (99%)
Deltamethrin (98%)
Acetamiprid (95%)
Chlorpyrifos (95%)
Cypermethrin (94%)
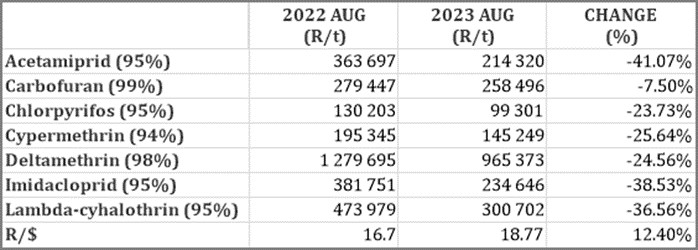
In comparison with the previous year’s prices, all of the products experienced a price decrease. The largest decrease was Acetamiprid with a decrease of 41,07% and Imidacloprid with 38,53%.
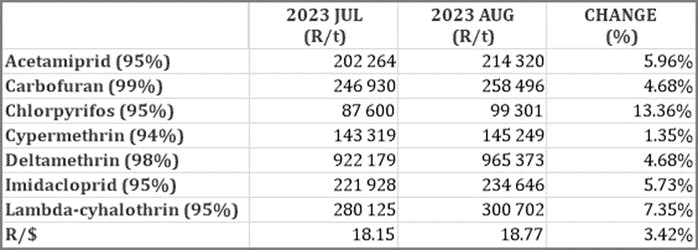
Unfortunately all of the products experienced a price increase on a month to month basis.
The graph below shows the international insecticide prices (R/t) per product from November 2019 to August 2023.
Fertiliser
The following fertiliser products are being analysed:
- Ammonia (Middle East)
- Urea (46%) (Eastern Europe)
- DAP (USA Gulf)
- KCL (CIS)
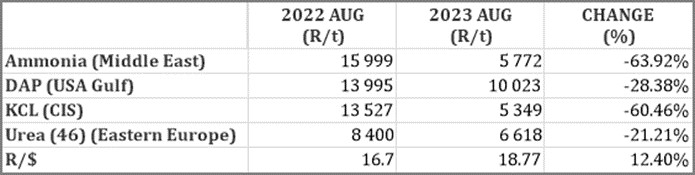
As seen in the table above all of the main fertiliser products decreased on a year-on-year basis. The biggest decrease, based on average international prices (R/t), was Ammonia (63,92%) followed by KCL (CIS) (60,46%).
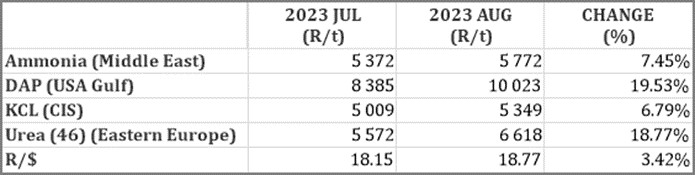
Unfortunately for the two months compared all of the products experienced a price increase. DAP experienced the biggest increase with 19,53%.
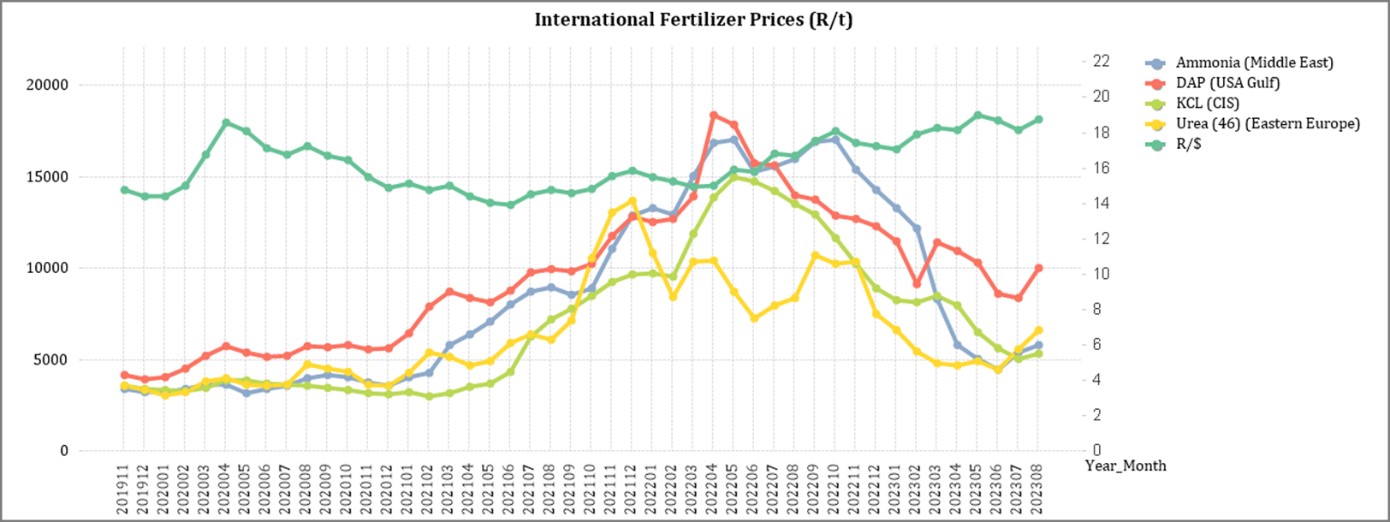
The graph below shows the International Fertiliser prices (R/t) per product from November 2019 to August 2023.
Sources: Grain SA – https://www.ft.com/content/4d746aa5-29e3-4796-b9e6-0b64c6865389
Urea: The Indians managed to surprise the Urea market once more by issuing a tender for 800,000 – 1 million tons that closes on 15 September. The urea market had assumed that the Indians wouldn’t look for more product for a month or so after their recent tender because of their healthy domestic stock urea situation. It seems that the recent price dip encouraged the Indians to try and lock in product at what is likely to be the best/lowest price for the remainder of 2023.
Ammonia: The Ammonia market is struggling to get prices to move upwards, despite fundamentals all pointing towards higher pricing. Availability is tight in the Eastern Hemisphere, with the massive Ma’aden ammonia plant down for a few weeks, and demand for ammonia emerging from India.
Phosphates: Indian buyers were prepared to up their bids by $5/t to $15/t for DAP as they seemed to be spooked by events in the urea market and picked up their buying. With Indian DAP producers struggling to source ammonia, there has been increased focus on DAP imports to cover their domestic requirements. MAP prices were stable for the third week in a row, with the Saudi and Brazilian prices sitting on either side of the $500/t level. With soya being the one crop showing strength, demand for MAP for soya in Brazil may support MAP prices in Brazil despite the expected reduction in international phosphates prices in the coming months.
Potash: The potash market is characterized by a few producers, Canpotex (Canada) and K+S (Germany) trying to push prices up following some supply disruptions that they have suffered. On the buy side, buyers see weak consumption and feel no pressure to consider any price increases at all. The outcome of these activities is that the price is unchanged in most locations this week. Potash traders are pinning their hopes on maize prices and therefore plantings in Brazil but so far there is little sign of their hopes coming true. In fact Brazilian potash stocks remain high and prices look more likely to soften in the coming weeks than to increase.
Sources
FCurve
https://www.grainsa.co.za/upload/report_files/Chemical-and-Fertilizer-Report-Sept-2023.pdf
The impact of South Africa being grey-listed
In February, South Africa was put on the greylist by the FATF for failing to implement effective measures to counteract money laundering and the financing of terrorism.
The Financial Action Task Force (FATF) grey list refers to the FATF’s practice of publicly identifying countries with strategic Anti- Money Laundering and Countering the Financing of Terrorism (AML/CFT) deficiencies.
In summary, the grey listing of a country means that its government has adopted an action plan to address to deficiencies identified during its mutual evaluation after an observation period, and to implement such action plan within a defined time period, and with FATF monitoring such implementation.
There are a number of impacts on a country’s economy that has been grey listed. A few of them are:
- Reputation damage: According to Treasury the most significant implication to a country that is grey-listed is the reputational damage to the country, as its effectiveness in combatting financial crimes like corruption and money-laundering as well as terror financing are deemed to be below international standards.
- Challenges for SA business wishing to access international financial services: One of the biggest risks is related to the withdrawal of banking and payments services necessary for trade, remittance, and other transfers and economic growth. Cross-border transactions will endure more red tape.
It should be noted that FATF does not require enhanced due diligence measures to be applied, but rather that all jurisdictions take account of it in their risk analysis.
- Enhanced reporting requirements when transacting: This will make South Africa less competitive in a global market as it will take a lot more time to do business due to extra paperwork and due diligence.
- Higher direct costs: If greater due diligence has to be performed it will come at a cost or investors might demand a higher rate of return when investing in South African institutions.
- Reduction in foreign direct investment: Being seen as a high-risk investment destination, some investors may not be allowed to invest in the country anymore and withdraw investments in the country.
However, with this being said, South Africa is a large exporter of raw materials and the world depends on us to continue providing those raw materials. South Africa also has a highly regarded financial sector and many offshore platforms will continue to operate as usual.
Before South Africa was grey-listed the world knew we were a high-risk jurisdiction to do business with and they treated us as such. Thus, being grey-listed is not such a shock to the world and our economy as one might think. On the bright side, Finance Minister Enoch Godongwana is confident that South Africa will implement the action plan timeous and be removed from the grey-list by mid-2024. Mauritius was removed from the list after 18 months.
Despite varying opinions on the severity of the greylisting, the South African Reserve Bank said that it could severely impact the country’s financial system by causing capital and currency outflows and increasing costs for banks.
South Africa has thus introduced several pieces of legislation to get off the greylist, with the National Treasury now opening the Money Laundering and Terrorist Financing Control Regulations for public comment as per the Financial Intelligence Centre Act.
These regulations lay out the requirements for the sharing of information between accountable institutions.
“Those involved in money laundering and other financial crimes usually do not just target one business. Frequently they deliberately open and maintain many accounts at different institutions,” the regulations state.
“Without information sharing, it is difficult for accountable institutions to recognise whether transactions are part of an economic crime because institutions cannot connect their customers’ transactions within the overall pattern of transactions at other institutions to know if any suspicious activity is occurring.” “Therefore, the ability to share information is critical to identifying, reporting, and preventing financial crime.”
Sources
https://www.treasury.gov.za/comm_media/press/2023/2023022501%20FATF%20Grey%20Listing%20Fact%20Sheet.pdf
https://www.sableinternational.com/blog/south-africa-s-greylisting-what-does-it-mean
https://businesstech.co.za/news/business-opinion/669803/its-time-to-be-realistic-about-south-africas-greylisting/
https://businesstech.co.za/news/finance/722578/treasury-beefs-up-plan-to-get-south-africa-off-the-grey-list/
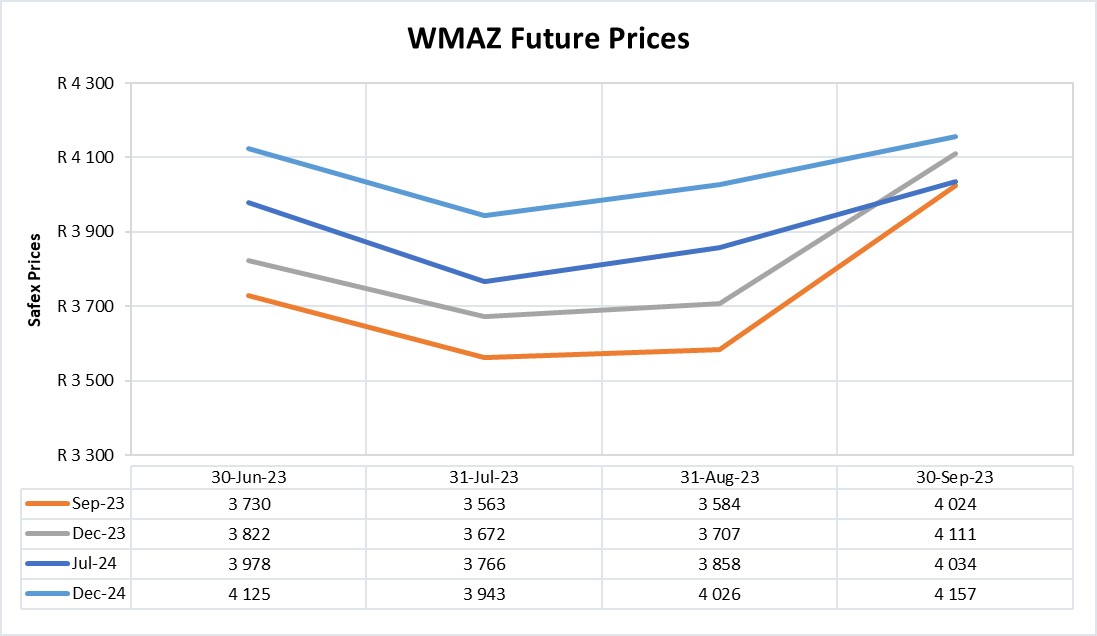
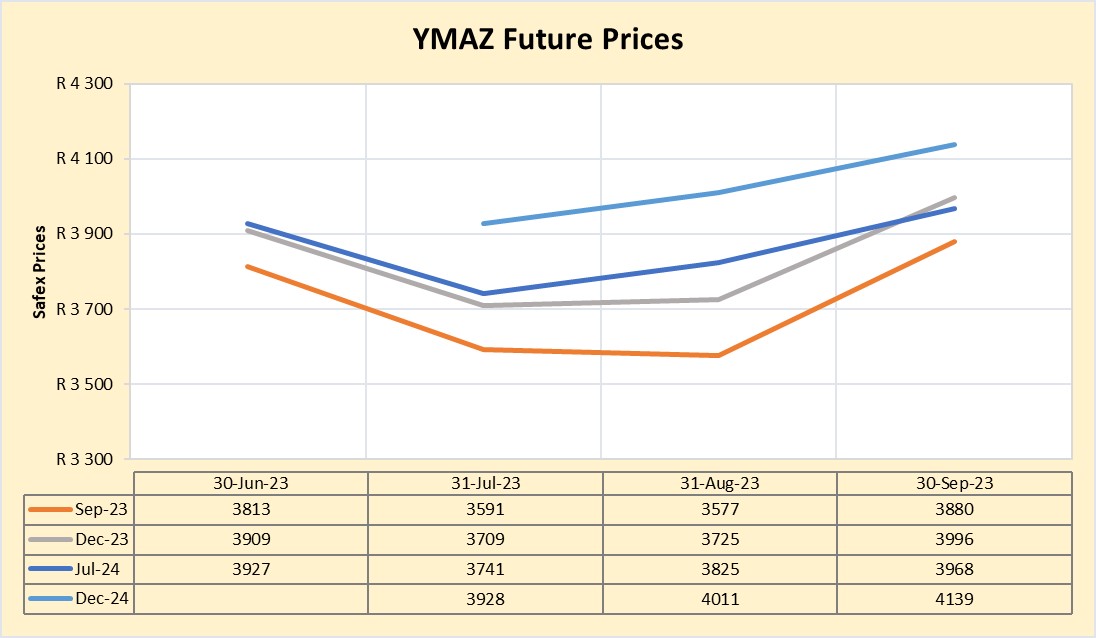
FUTURE PRICES
The graphs below illustrate the market sentiment for maize, in the form of future contracts, for the upcoming contract months. The market sentiment is the expectation of supply and demand fundamentals relating to white and yellow maize in South Africa.
Source: Sagis/JSE
Source: Sagis/JSE
CBOT corn experienced a 1,1% decrease for the week ending July 28th, compared to a 6% decrease year-on-year. This was due to improved weather prospects in the Midwest, slow US corn exports to China, and Russian President Putin’s pledge to donate free grain to African countries. However, ongoing war and attacks in Ukraine may exacerbate supply concerns and drive global prices upward.
Due to the current ENSO phenomenon, prices are expected to move away from export parity in 2024. Predict that maize prices will bottom out in the second half of 2024 and global prices will recover into 2025. A relatively strong 2024 production season in the US is expected to limit drastic global price growth.
Source
https://agrink.co.za/downloads/ABSA%20Agri%20Trends%20Grains%20and%20Veggies.pdf
https://absaagritrends.co.za/grains-and-oilseeds/
https://absaagritrends.co.za/wp-content/uploads/2023/09/Absa-AgriTrends-2023-Spring.pdf?utm_source=website&utm_medium=banner&utm_campaign=Agritrends
Fraud risk
FRAUD AWARENESS
In a survey conducted by Aura, respondents said they knew they should change their behaviours to reduce their risk of cybercrime, but most have not. Thus, the bottom line is that fraud prevention starts with you.
Here are three fraud prevention tips:
- Never sign in to an account using a link in an email or text: Once they steal your surname, password, or other sensitive information, hackers can lock you out of your accounts, commit identity fraud, steal from you, and more.
- Use different emails and passwords for each financial account: If a hacker gets into one account, they won’t have access to everything. A password manager is a powerful tool to help you keep track of your secure log-in details.
- Always perform recommended updates on your devices: Don’t skip out on upgrades for your browsers, operating system (OS), devices, and antivirus software. These updates usually contain security patches that plug up known and emerging cyber threats. Skipping these makes you vulnerable for hackers to exploit. Consider enabling automatic updates.


