
The NWK Limited external factors report provides an overview of the main external factors that NWK and its clients are exposed to at a specific point in time. This report opts to aid in a timely basis to foresee external market and other factors that may have an impact on any business and clients. The main focus of this document is to have a closer look at external factors that can affect any business and our customers.
Executive summary
External factors that can affect any business and its customers include various economic factors. This report will focus on monthly or quarterly changes of these economic factors.
The inflation rate increased to 2,7% in March 2025, from 3.6% in February, falling below the estimated 2,9% of analysts. Retail trade rose by 3,9% in February 2025. The unemployment rate fell to 31,9% in the fourth quarter of 2024.
The GDP growth for the fourth quarter expanded with 0,6%, following a revised 0,1% contraction in Q3 of 2024. The Policy Uncertainty Index went much further into negative territory to 78,6 in Q1 2025 compared to 65,7 in Q4 2024.
An external factor that is of great concern to any agricultural business is the weather and climate outlook. These factors include long term climate risks, such as drought and heat stress, as well as the current status of the El Niño and La Niña climate phenomenon. The El Niño Southern Oscillation (ENSO) is currently ENSO neutral, neutral conditions are expected to persists until early spring.
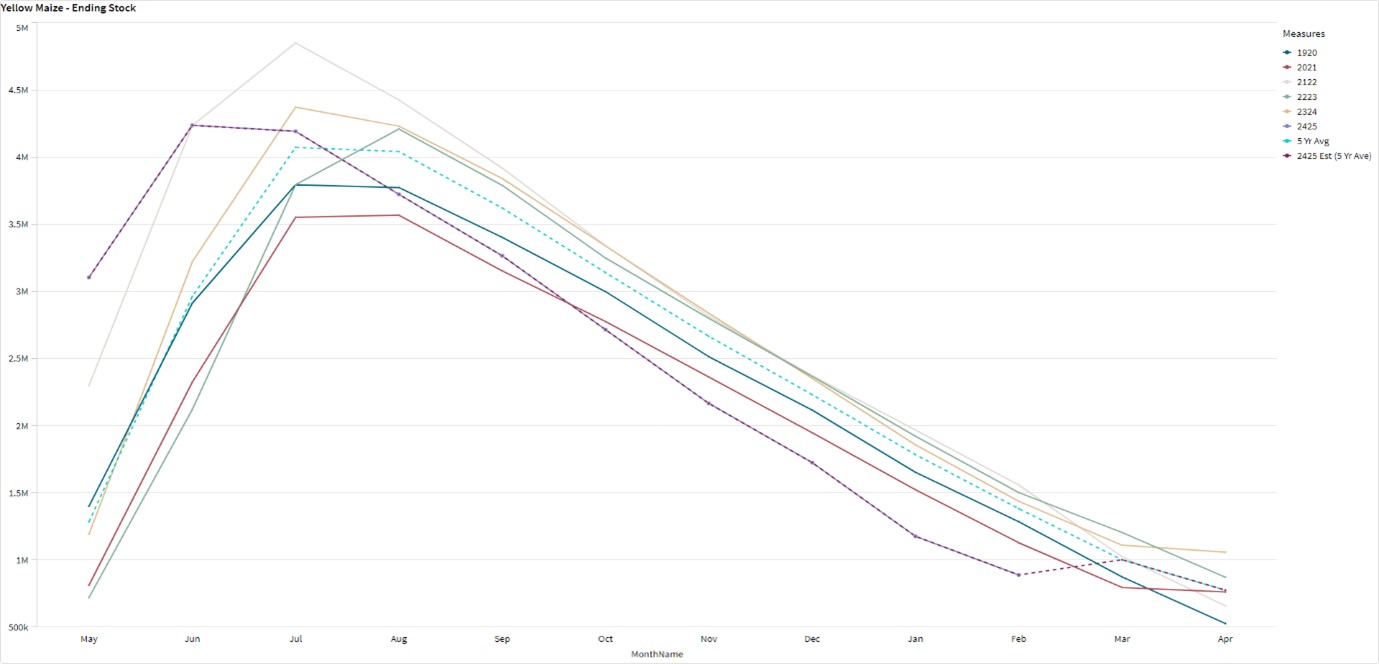
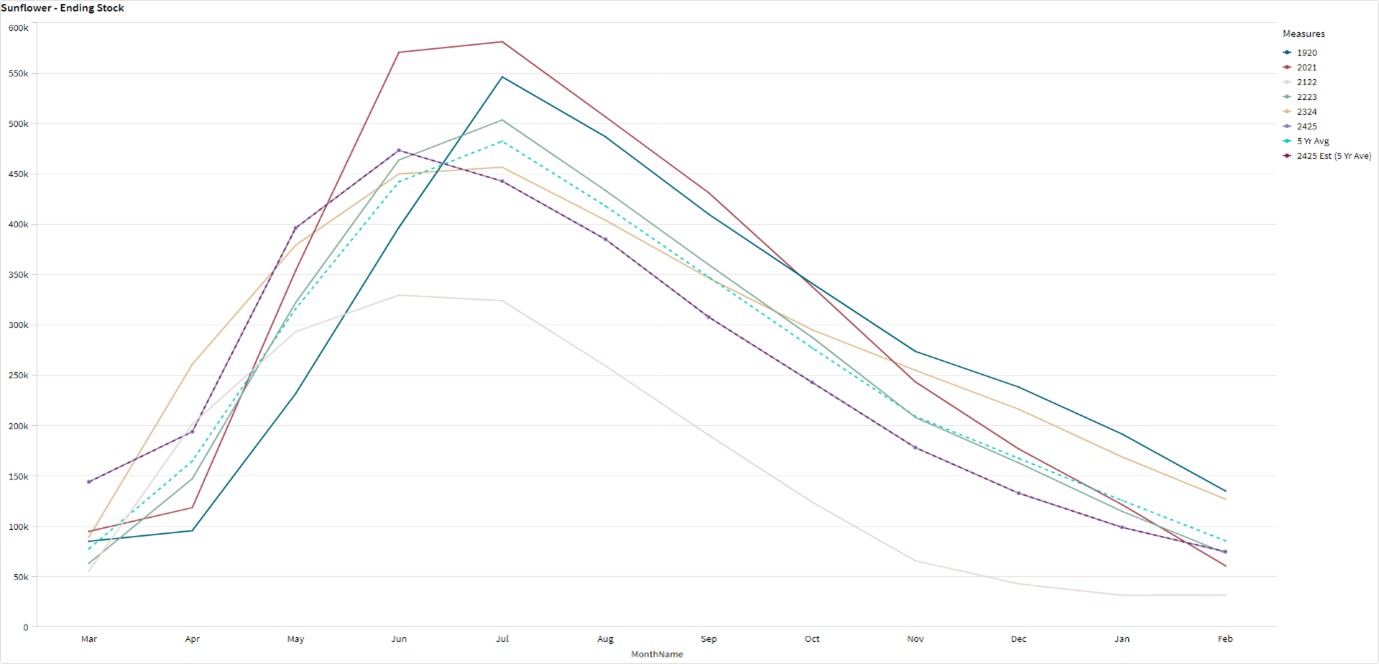
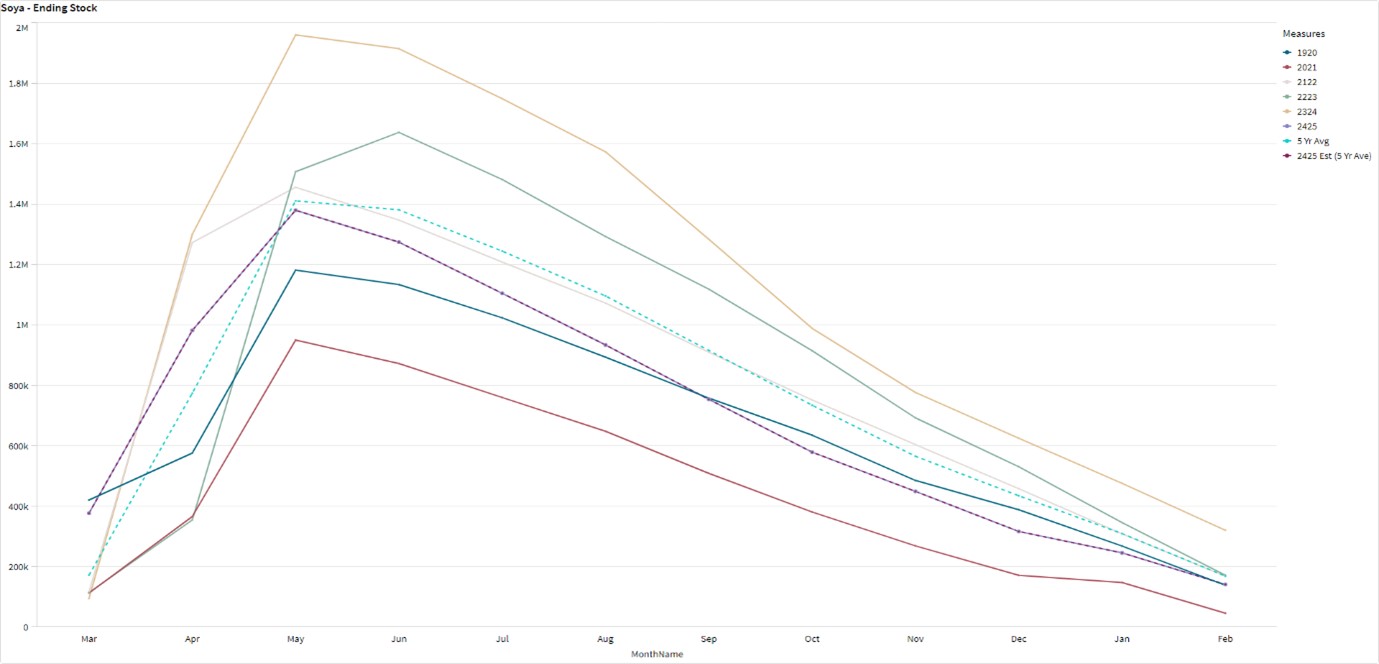
The National Agricultural Marketing Council (NAMC) projected the ending stock for 30 April 2025 of total maize to be less than the 2023/2024 season. The projected soybean ending stock for February 2025 is 141 297 t – that is less than the final for the 2023/2024 season of 320 637 t. The projected sunflower ending stock for February 2025 is 74 954 t – that is less than the final for the 2023/2024 season of 127 144 t.
During the previous Monetary Policy Committee (MPC) meeting held on 20 March the committee decided that interest rates will remain the same. The repo rate is currently 7,5% and the prime rate 11%.
Business climate: Key risk drivers
A few highlights regarding certain risk drivers are mentioned below.
According to Trading Economics, South Africa’s annual inflation rate declined to 2,7% in March 2025, from 3,6% in February. The inflation rate is expected to be 4% by the end of this quarter. In the long-term, the South Africa Inflation Rate is projected to trend around 4,6% in 2026 and 4,5% in 2027, according to Trading Economics.
Brent crude oil monthly average prices decreased by $2,71 per barrel from February to March. The Iron ore prices decreased by $4,72 per metric ton on a monthly average from February to March.
South Africa’s retail trade climbed with 3,9% compared to over a year ago in February 2024, following a 7% jump the month prior. According to Statistics SA, South Africa’s unemployment rate fell slightly to 31,9% in Q4.
The GDP growth rate decreased by 0,6% in the fourth quarter in 2024. Three of the ten industries experienced an increase. The agricultural sector was the largest positive contributor, increasing by 17,2%.
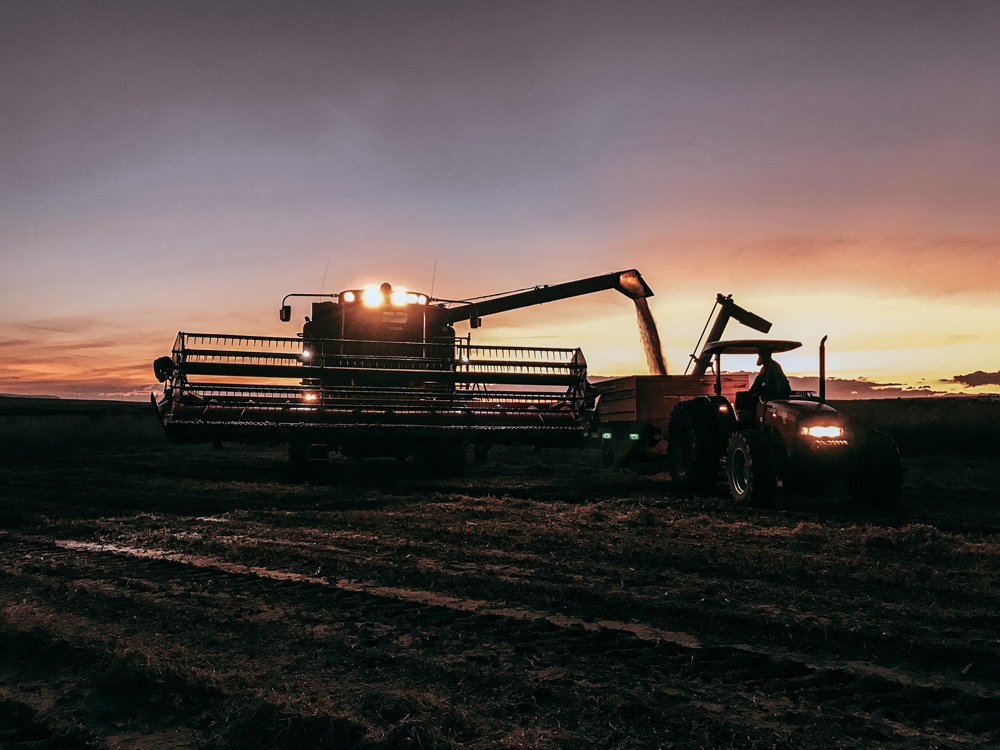
The Safex maize prices have dropped in response to improved weather prospects. The recent favourable weather forecasts are promising for the season’s production outlook, with weather remaining a key variable to monitor.
The El Niño–Southern Oscillation (ENSO) is currently ENSO Neutral. As of mid-April 2025, the equatorial Pacific is in an ENSO-neutral state. Neutral conditions are predicted to persist until at least September 2025. The solar cycle is in an upward trend for the current eleven-year cycle which means possible more rain for the following season to come. The turning point is predicted to be in 2025.
The Policy Uncertainty Index went much further into negative territory to 78,6 in Q1 2025 compared to 65,7 in Q1 2024. The PUI is the net outcome of positive and negative factors influencing the calibration of policy uncertainty over the relevant period. This is a record high for the PUI. Persistent negative factors again outweighed positive ones. This was the net outcome of the PUI’s calibration of both positive and negative factors influencing the level of policy uncertainty in SA in the first quarter of 2025. Elevated levels of policy uncertainty nonetheless in time are reversible if the right actions are taken.
Sources:
https://tradingeconomics.com/south-africa/inflation-cpi
https://tradingeconomics.com/commodity/brent-crude-oil
https://tradingeconomics.com/south-africa/unemployment-rate
https://www.statssa.gov.za/?page_id=737&id=1
https://tradingeconomics.com/south-africa/gdp-growth
https://agrink.co.za/downloads/ABSA%20Agri%20Trends%20Grains%20and%20Veggies.pdf
https://tradingeconomics.com/commodity/iron-ore
PUI_2024Q3.pdf
Agribusiness Confidence Index (ACI), Q3 2024
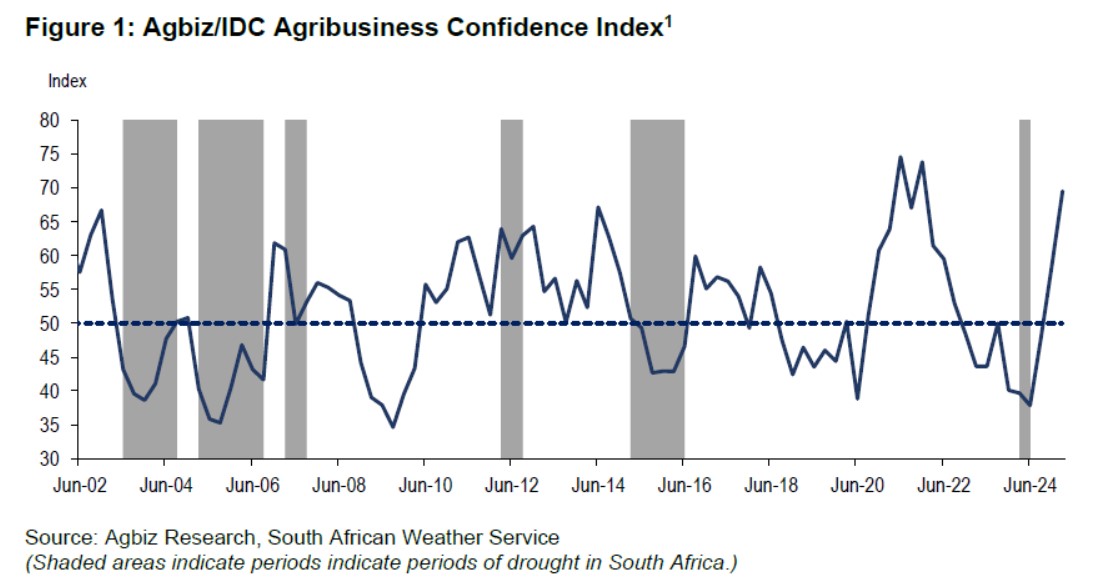
The Agricultural Business Chamber (Agbiz) conducts a quarterly survey to compile the Agribusiness Confidence Index (ACI), reflecting the views of at least 25 decision-makers in the agricultural sector. Released on 17 March 2025, the latest index evaluates ten critical factors impacting agribusiness: turnover, net operating income, market share, employment, capital investment, export volumes, economic growth, general agricultural conditions, debtor provisions for bad debt, and financing costs.
The Agbiz/IDC Agribusiness Confidence Index (ACI) increased 11 points from Q4 2024 to 70 in Q1 2025. This is the third consecutive improvement, placing the ACI at its highest level since Q4 2021, a year of La Niña rainfall that boosted agricultural output.
The current level of the ACI implies that South African agribusinesses remain optimistic about business conditions in the country. This optimism is a result of a combination of factors, including La Niña rains that support the 2024/2025 agricultural season, improvements in port efficiency that supported exports in 2024, and the progress in controlling animal diseases. This survey was conducted in the third week of February, covering various agribusinesses operating in all agricultural subsectors across South Africa.
DISCUSSION OF THE SUBINDICES
The ACI is made up of ten subindices, six of which improved in Q3 2024, while the others saw slight declines. Here is the detailed view of the subindices:
The turnover subindex confidence is up 14 points from Q4 2024 to 60 in Q1 2025. We observed most optimism in agribusinesses operating in fruits and winter crops, while others maintained a generally unchanged view from the previous quarter. Similarly, the net operating income subindex lifted by 28 points to 70 points in Q1 2025, its highest level since the end of 2022. The drivers were the same as the turnover.
The market share of the agribusiness subindex is up by 3 points to 70 in Q1 2025. Most respondents maintained an essentially unchanged view, with stakeholders in the winter grains regions signalling an uptick in confidence.
The employment subindex rebounded 13 points from Q4 2024 to 55 in Q1 2025. Provided the sector is recovering from drought and animal diseases, a positive change in sentiment about employment possibilities is unsurprising. Moreover, this year’s minimum wage increase was also mild and aligned with industry expectations.
The capital investments subindex was up 13 points in Q1 to 75. The high-frequency data, such as tractors and combine harvester sales, are already strong and show improvement in the first two months of this year.
The subindex measuring the volume of export sentiment increased significantly by 17 points to 100 in Q1 2025. This reflects the activity as South Africa’s agricultural exports reached a record US$13,7 billion in 2024.
The general economic conditions subindex lifted 3 points to 65 in Q1 2025. This recovery in the mood about the economic conditions could be due to the expected effects of the overall implementation of Operation Vulindlela.
The general agricultural conditions subindex lifted 13 points to 80 in Q1 2025. This optimism mirrors the positive effects of La Niña rains in the 2024/25 summer season. The production estimates for field crops, horticulture, and livestock are generally optimistic.
Changes in interpretation
The subindices of the debtor provision for bad debt and financing costs are interpreted differently from the abovementioned indices. A decline is viewed as a favourable development, while an increase signals growing financial strain.
In Q1 2025, the financing costs indices declined by 4 points in Q1 2025 to 75, which supports the sentiments. In an environment of easing interest rates, this subindex’s decline is aligned with expectations.
However, the debtor provision for bad debt increased by 8 points to 50, which is unfavourable and shows that some farmers may still have financial pressures from the last season.
Concluding remarks
The ACI results for Q1 2025 show that the mood in the sector is upbeat, reflective of the recovery in the agricultural industry following a challenging season of drought and animal diseases.
‘It is heartening to see that the geopolitical tensions haven’t weighed on the sector heavily. We should build on this optimism for the sector’s long-term growth. An effort to keep the sector on the positive path requires collaborative efforts between business and government on pushing for the effectiveness of the network industries, better management of the municipalities, further efforts to open new export markets, and the implementation of the Agriculture and Agro-processing Master Plan,’ concludes Wandile Sihlobo, chief economist of the Agricultural Business Chamber of SA (Agbiz).
ISSUED BY:
Wandile Sihlobo
Chief Economist, Agricultural Business Chamber of South Africa (Agbiz)
E-mail: wandile@agbiz.co.za
Source: https://agbiz.co.za/content/economic-research?page=agribusiness-confidence
Fact of the month
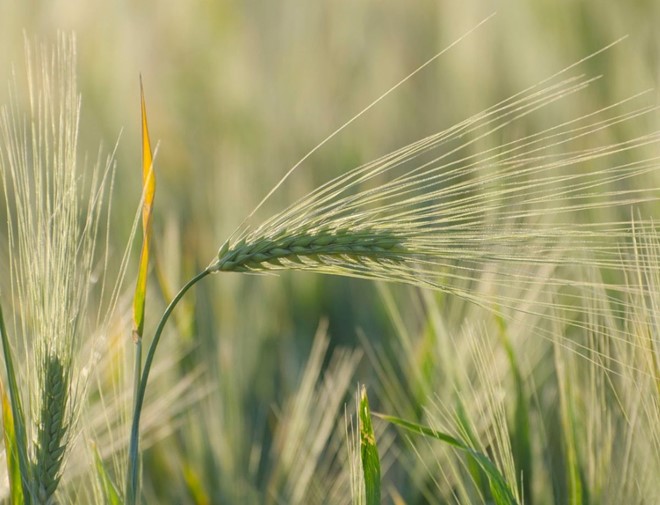
Barley is among the very first crops to be cultivated. Historians believe that barley and its ancient cousins einkorn and emmer were probably the first domesticated crops, and the catalyst for the birth of civilisation. In ancient civilisations including Egypt, Greece and Rome, barley was a staple crop and up until roughly the 16th century, barley was the most important grain of Western Europe.
Source: https://foodprint.org/real-food/barley/
Weather and climate
NATIONAL ASSESSMENT
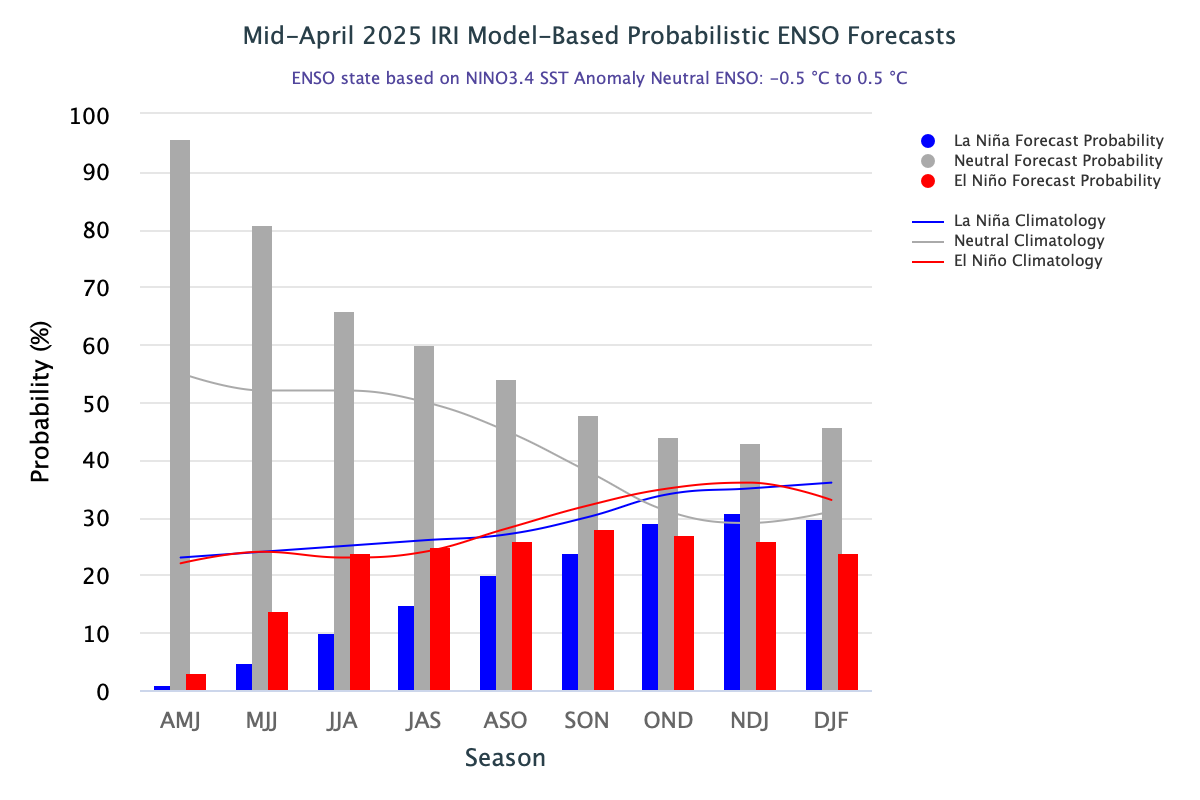
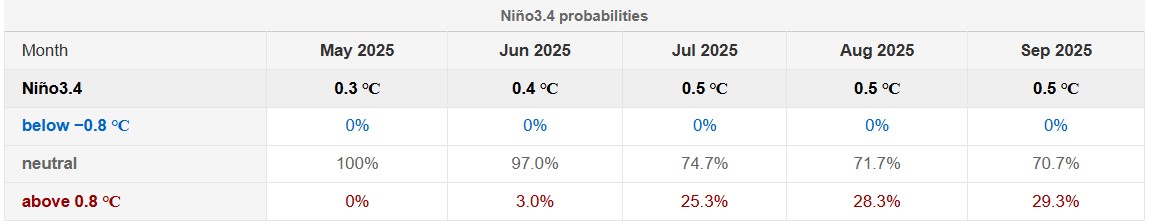
As of mid-April 2025, the equatorial Pacific is in an ENSO-neutral state. This shift is marked by sea surface temperatures in the Niño 3.4 region that are now closer to average, with anomalies at 0,10°C for Mar, 2025. The IRI ENSO plume forecast indicates a high probability (96%) of ENSO-neutral conditions for April to June 2025.
These neutral conditions are expected to continue through August to October 2025, with probabilities staying above 50%. For later forecast seasons, ENSO-neutral conditions remain the most likely outcome, though probabilities decrease to the 40% range. During the forecast period, neither El Niño nor La Niña shows a strong preference, with the probabilities for both phases gradually increasing and then stabilising in the upper 20% range.
https://iri.columbia.edu/our-expertise/climate/forecasts/enso/current/?enso_tab=enso-iri_plume
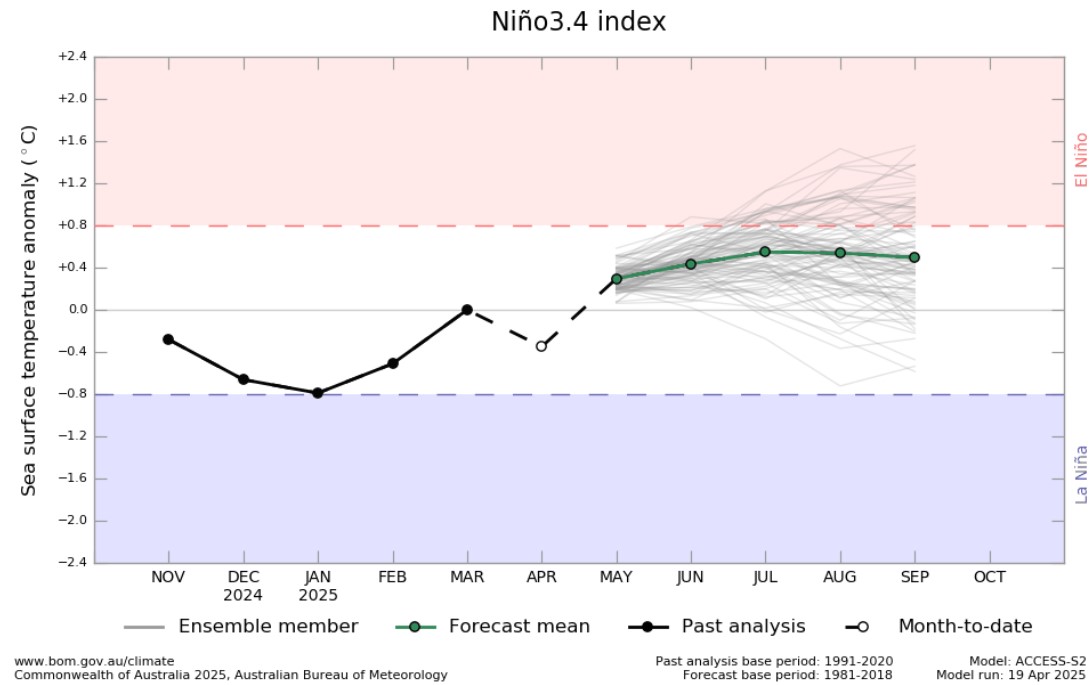
The Bureau of Meteorology’s model suggest SSTs are likely to remain within the ENSO-neutral range (−0.8 °C to +0.8 °C) throughout the forecast period to September 2025.
The graph below reflects the current neutral conditions and the ocean temperatures that are substantially above average, but still within the ENSO neutral range. The graph supports the prediction of an ENSO-neutral state throughout the forecast period to September 2025.
http://www.bom.gov.au/climate/ocean/outlooks/?index=nino34
The latest Climate Watch issued by the SA Weather Service (31 March 2025) states that above-normal rainfall is forecasted for the southern and eastern coastal regions of the country during the late autumn and early winter seasons. This could lead to water logging in areas receiving excessive rainfall, potentially causing damage to crops. However, the southwestern part of the country, which normally receives significant rainfall during the early winter season, is expected to receive below-normal rainfall during this period. Therefore, the relevant decision-makers are encouraged to advise farmers in these regions to practice soil and water conservation, proper water harvesting and storage, and other appropriate farming practices.
Minimum temperatures are largely expected to be above-normal for the most part of the forecaster period. Maximum temperatures are expected to be above-normal as well with the notable exception of the southern and south-eastern coastal areas that is expected to have below-normal maximum temperatures.
Source: https://www.weathersa.co.za/Documents/SeasonalForecast/SCOLF202503_31032025122337.pdf
SUNSPOTS
Sunspots are darker, cooler areas on the surface of the sun that arise due to disturbances in the sun’s magnetic field. Sunspots vary in numbers throughout the 11-year solar cycle.
According to a study published on Science Direct the rainfall rate can be directly related to the sunspot number, but shows different characteristics during solar maximum (the peak of the sun’s 11-year solar cycle) years. Though a lag correlation exists between sunspot number and rainfall, sunspots have an increasing effect on rainfall. Studies show that the more sunspots are present the higher the rainfall and the less sunspots the lower the rainfall.
ENSO occurs at irregular intervals between 3 and 7 years causing global climate system variation. Considering this event occurs periodically, it might be triggered by the 11-year solar cycle as an energy source.
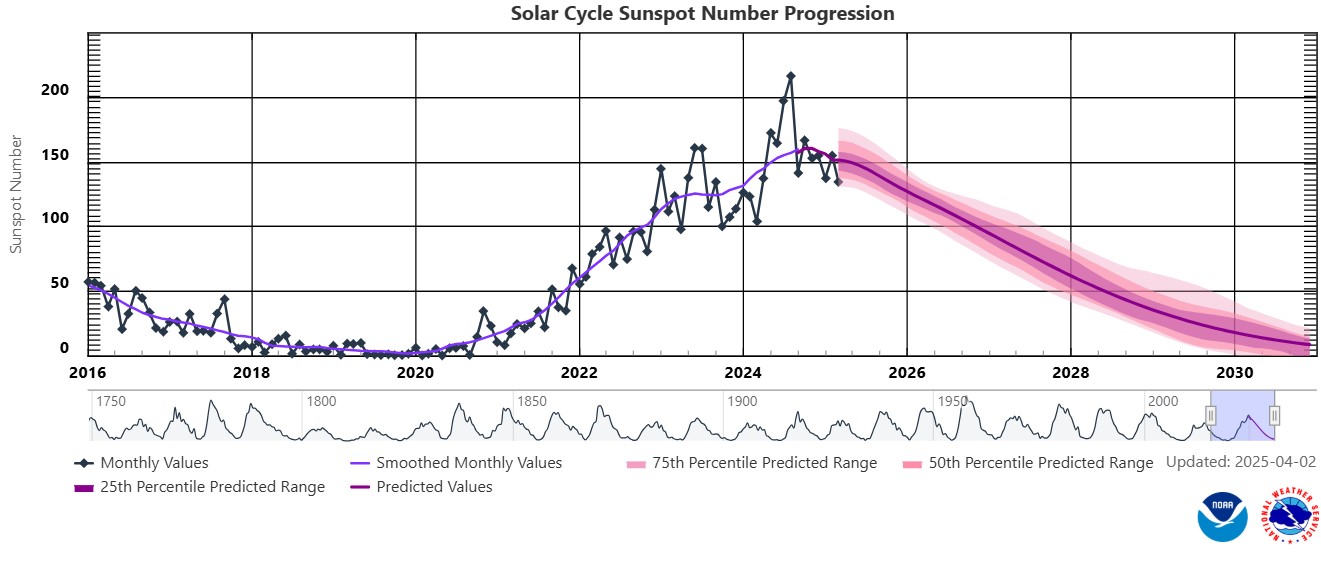
The graph below shows the latest 11-year solar cycle. An upward trajectory suggests that higher rainfall can be expected, characteristic of a La Niña. A downward trajectory suggests that lower rainfall can be expected, characteristic of an El Niña.
Since October 2020 to February 2025 the actual sunspot numbers were higher than the predicted values. March 2025 falls within the predicted range, with a monthly mean sunspot value for March 2025 were 134,2.
Sources
https://www.spaceweatherlive.com/en/solar-activity/solar-cycle.html https://www.sciencedirect.com/science/article/abs/pii/S136468262200116X#:~:text=It%20was%20observed%20that%20rainfall,an%20increasing%20effect%20on%20rainfall
https://www.space.com/solar-cycle-frequency-prediction-facts
https://eos.org/articles/why-did-sunspots-disappear-for-70-years-nearby-star-holds-clues https://aip.scitation.org/doi/abs/10.1063/1.4930679?journalCode=apc#:~:text=ENSO%20occurs%20at%20irregular%20interval,cycle%20as%20an%20energy%20source
Market risk
GRAIN MARKET ANALYSIS
- Ending stock – National
Ending stock data is gathered from the NAMC. The estimates are reassessed and reported by the Grain and Oilseeds supply and demand estimates committee. The following is the projected ending stock for April 2025 in tonnages for the 2024/2025 season:
- White maize => 460 084 t
- Yellow maize => 390 798 t
The following is a summary of September 2025 ending stock projections for the 2024/2025 season:
- Wheat => 698 128 t
The following is a summary of February 2025 projected ending stock for the 2024/2025 season:
- Sunflower => 74 954 t
- Soybeans => 141 297 t
- Sorghum => 89 193 t
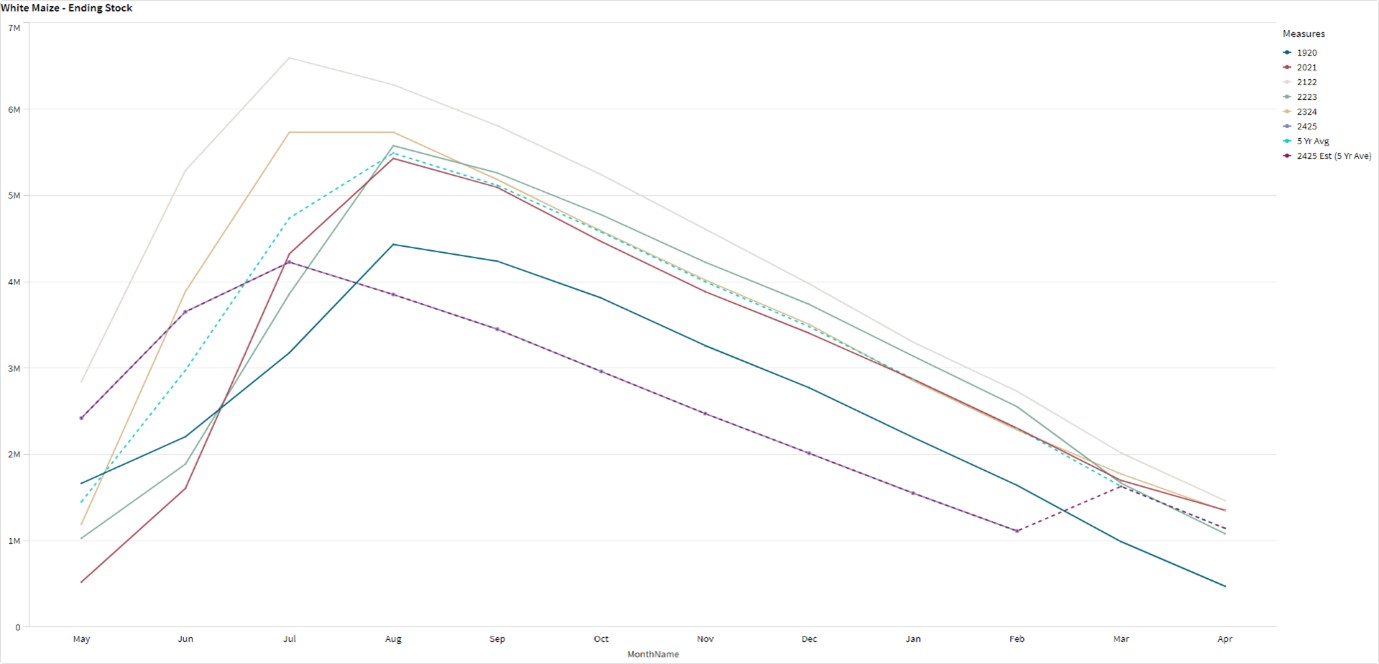
The graphs below show the predicted ending stock for the different commodities according to SAGIS data. A five-year average has been calculated to determine the estimated ending stock for the current season.
The predicted five-year average white maize in April 2025, is 202 082 t less than the final for the 2023/2024 season. Yellow maize shows a 282 419 t decrease in ending stock compared to the previous season.
The predicted five-year average sunflower ending stock for the 2024/2025 season is 41 396 t less than the previous season ending stock.
The predicted five-year average soybean ending stock for 2024/2025 is 151 551 t less than the previous season ending stock.
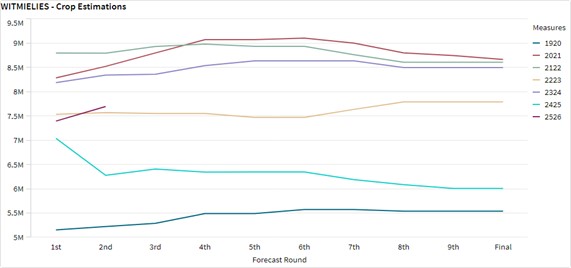
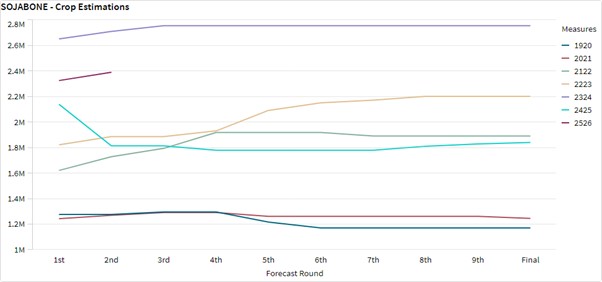
- Crop estimations
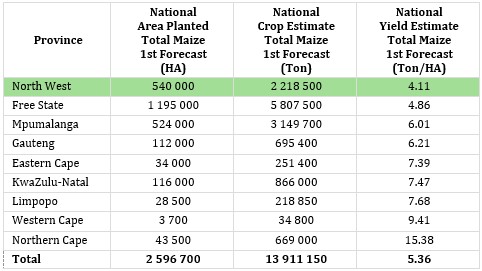
According to the Crop Estimate Committee (CEC) first production forecast for 2025, the total area estimate for maize in South Africa is 2,596 million ha, which is 1,5% less than the actual 2,636 million ha planted for the previous season. The total forecasted tons for white and yellow maize are 14,55 million tons from the second forecast.
Source: CEC (Crop Estimates Committee)
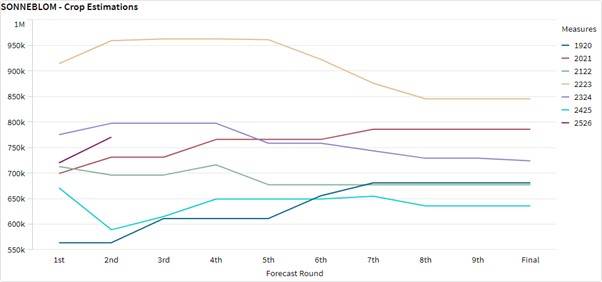
The production forecast for sunflower seed remained unchanged at 770 500 tons. The area estimate for sunflower seed is 555 700 ha while the expected yield is 1,39 t/ha.
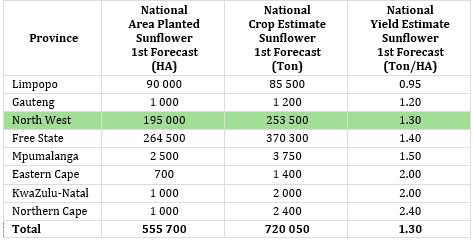
Source: CEC (Crop Estimates Committee)
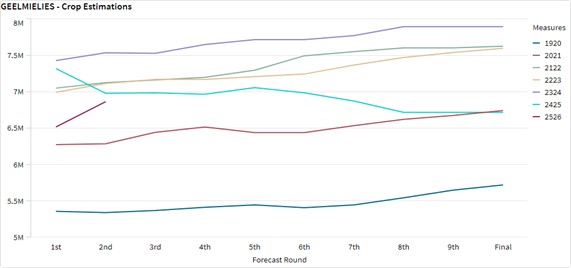
The production forecast for soybeans increased with 2,78% to 2,39 million tons. The estimated area for soybeans is is 1,151 million ha with an expected yield of 2,08 t/ha.
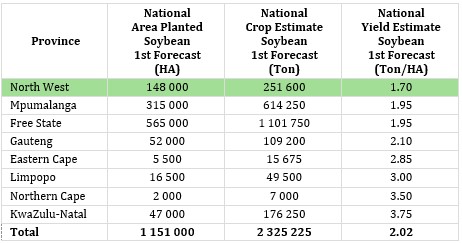
Source: CEC (Crop Estimates Committee)
- Imports and exports – National
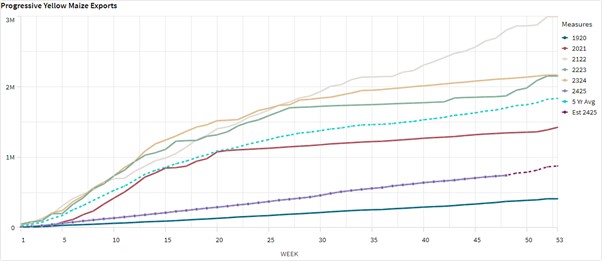
For the production season ending April 2025, 1 393 223 t of white maize and 757 303 t of yellow maize have been exported to date (week 48 of 52) as seen in the graphs below.
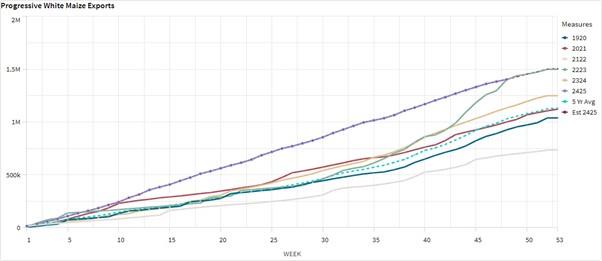
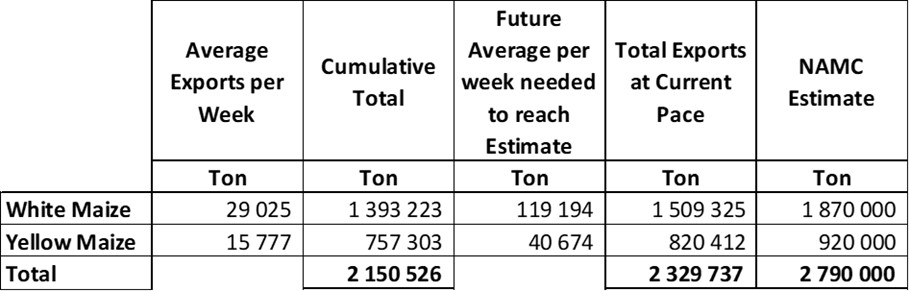
As seen in the table above, the average white maize exports per week is currently 29 025 t. If theoretically, white maize exports remain at the current average per week then there would be 360 675 t less white maize exports than anticipated.
The average yellow maize exports per week are currently 15 777 t. If theoretically, yellow maize exports remain at the current average per week then there would be 99 588 t less yellow maize exports than anticipated.
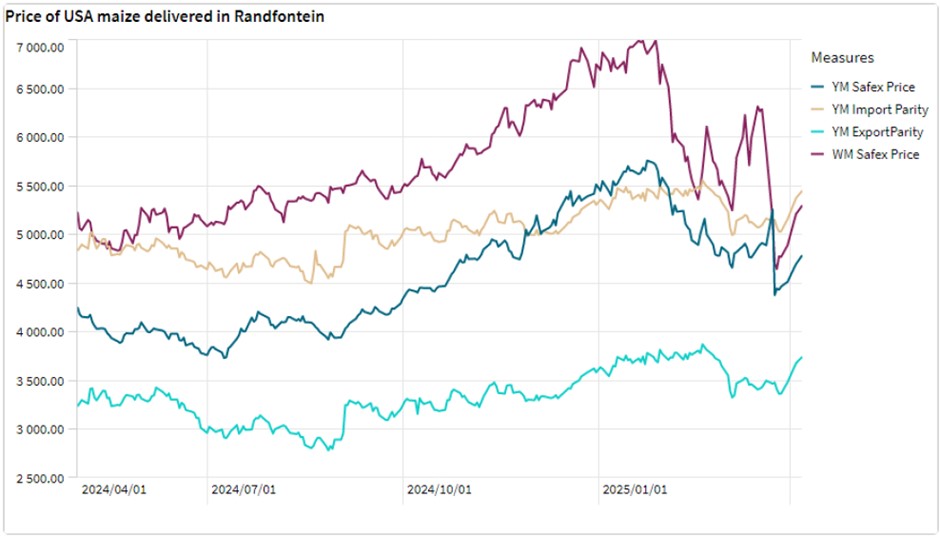
- Parity prices
South Africa is a small producer compared to other countries and is thus a price taker (meaning that we cannot influence world prices). Because of this, our local prices are normally between import and export parity, which is illustrated in the figure below. An import parity price is defined as the price which a buyer will pay to buy the product on the world market. This price will include all the costs incurred to get the product delivered to the buyer’s destination.
An export parity price is defined as the price that a local seller could receive by selling his product on the world market e.g., excluding the export costs. The price which the seller obtains is based on the condition that he delivers the product at the nearest export point (usually a harbour) at his own expense.
The graph below reflects the Safex price, import parity and export parity of yellow maize as well as the Safex price of white maize. The import and export parity prices for white maize is not released by Grain SA for this period.
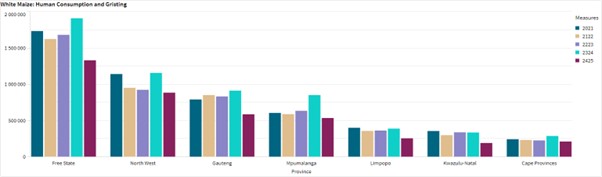
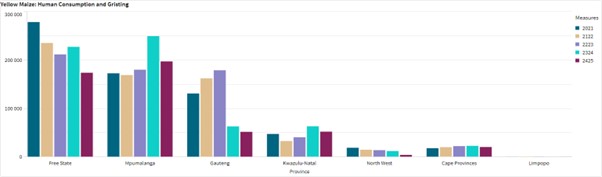
- Grain processing per province
For the marketing year which is May to April (2024/2025), the Free State province dominates the white maize that is used for human consumption and gristing. North West consumed the second most white maize produced for human consumption for the marketing year, 2024/2025.
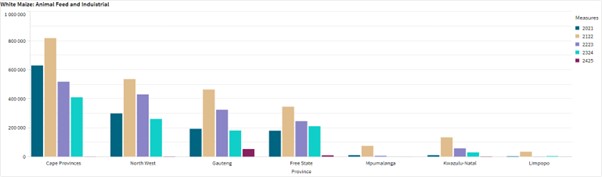
Gauteng used the most, white maize for animal feed and industrial usage with the Free Sate using the second most.
Mpumalanga processed the most yellow maize for consumption and gristing and Gauteng processed the most yellow maize for animal feed and industrial purposes.

- Exchange rate
NWK Group is exposed to foreign exchange rate risk in various business areas, such as commodity prices and trade imports, etc.
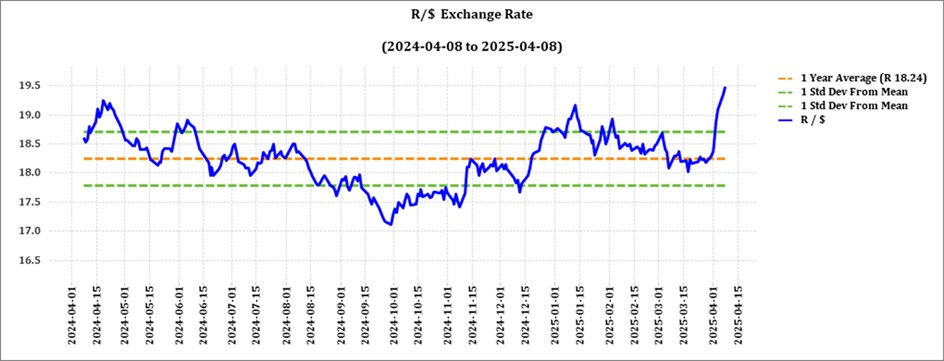
The rand traded at a monthly average of R18,29 against the dollar for the month of March, but as from early April the Rand plummeted against the Dollar with record year highs of R19,48 (8 April) against the dollar due to uncertainties in the markets after Trumps’ tariffs became effective.
The crumbling of the coalition government (GNU) over the Budget VAT debacle is further undermining the currency, adding to the uncertainty at a time when South Africa urgently needs political stability to tackle global challenges.
Source: Trading Economics
- Interest rate
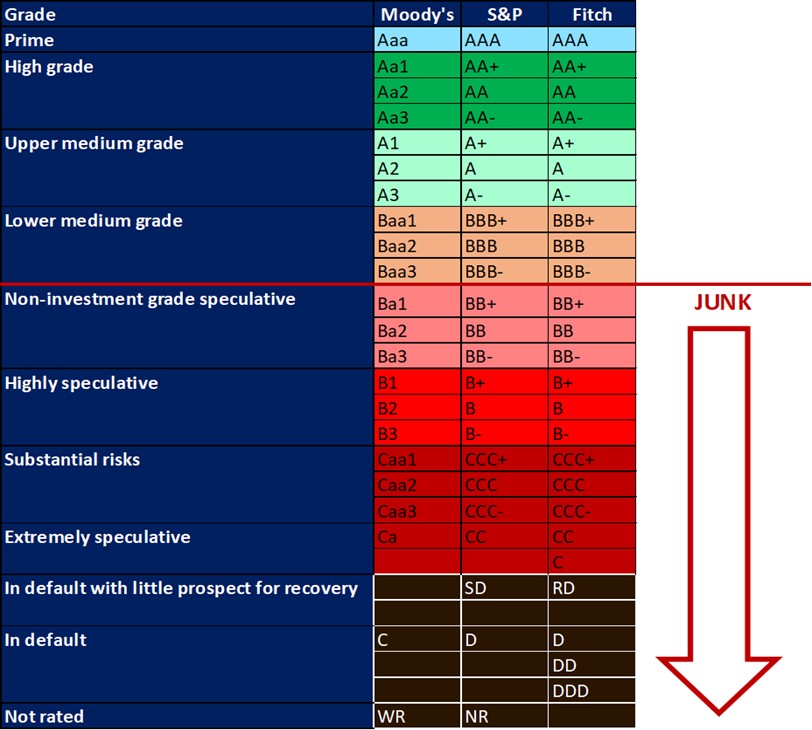
On 27 March 2020, Moody’s downgraded South Africa’s sovereign credit rating to sub-investment grade and placed a negative outlook on the rating. The key drivers for this downgrade include weak economic growth, continuous deterioration in fiscal strength, and slow progress on structural economic reforms. It is now the first time in post-apartheid South Africa that all major rating agencies, i.e., Moody’s, Fitch, and S&P, have South Africa’s credit ratings in sub-investment grade territory. More than a year later and our Moody’s rating remains the same.
During the previous Monetary Policy Committee (MPC) meeting held on 30 January the committee decided that interest rates will decrease with 25-basis points. The repo rate is currently 7,5% and the prime rate is 11%.
Interest rate movement:
26 January 2023 – 10,75%
30 March 2023 – 11,25%
25 May 2023 – 11,75%
20 July 2023 – 11,75%
21 September 2023 – 11,75%
23 November 2023 – 11,75%
27 March 2024 – 11,75%
30 May 2024 – 11,75%
18 July 2024 – 11,75%
19 September 2024 – 11,50%
21 November 2024 – 11,25%
30 January 2025 – 11,00%
20 March 2025 – 11,00%
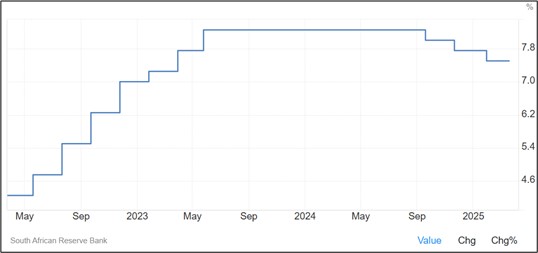
Source: South African Reserve Bank
The South African Reserve Bank kept the repo rate unchanged at 7,5% during its 2025 March meeting, with risks to economic stability calling for caution. Inflation, while contained, has edged higher, with goods inflation remaining low but services inflation rising. VAT hikes and CPI reweighting affected the outlook, but lower fuel prices and electricity tariffs improved projections.
Interest rate forecast
The benchmark interest rate in South Africa was last recorded at 7,5%. Interest rate in South Africa is expected to be 7,5% by the end of this quarter, according to Trading Economics global macro models and analysts’ expectations. In the long-term, the South African interest rate is projected to trend around 6% in 2026 and 5,5% in 2027, according to our econometric models.

- Inflation rate
As the inflation rate is a driver for increases and decreases in interest rates the current rate and forecast have to be assessed to foresee further increases in the interest rate.
Current: South Africa’s inflation rate fell sharply to 2,7% in March 2025 from 3,2% in February and below analysts’ estimates of 2,.9%. This marked the lowest reading since June 2020, falling below the lower bound of the SARB’s 3% to 6% target range.
Inflation declined mainly due to a steep fall in the fuel index (-8,8% vs -3,6% in February). Additionally, price growth slowed for food and non-alcoholic beverages (2,7% vs 2,8% in February) and restaurants and hotels (4,2% vs 4,6%).
Meanwhile, core inflation – which excludes food, non-alcoholic beverages, fuel and energy – fell to 3,1%, its lowest since September 2021. On a monthly basis, CPI jumped 0,4%, slowing down from a 0,9% advance in February.
Source: Statistics South Africa.
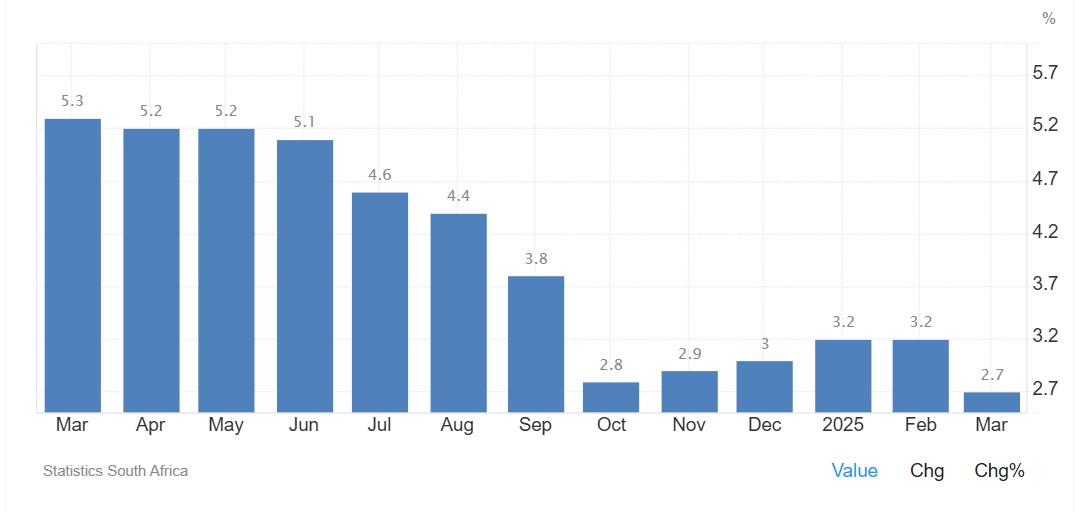
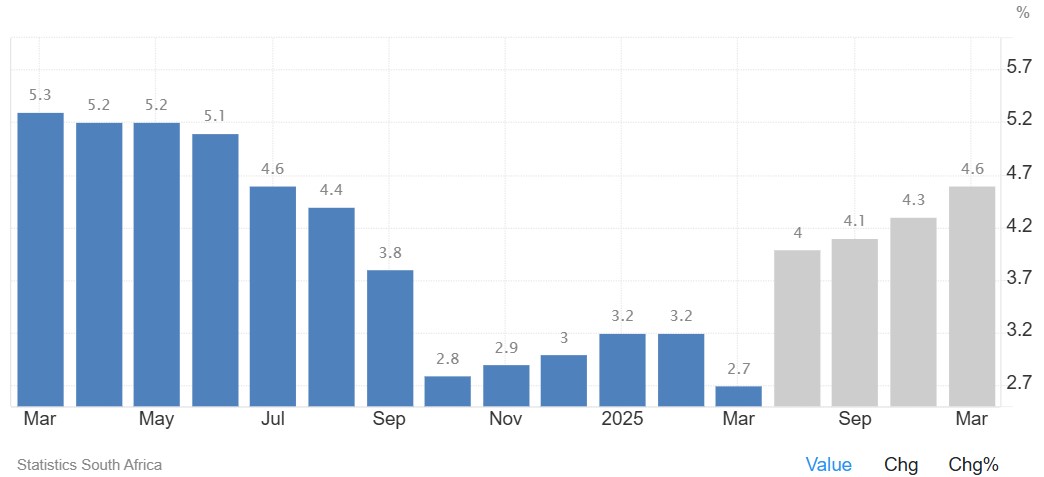
Inflation rate in South Africa decreased to 2,7% in March 2025 from 3,2% in February 2025. Inflation Rate in South Africa is expected to be 4% by the end of this quarter, according to Trading Economics global macro models and analysts’ expectations. In the long-term, the South Africa Inflation Rate is projected to trend around 4,6% in 2026 and 4,5% in 2027, according to their econometric models.
Source: https://tradingeconomics.com/south-africa/inflation-cpi
- Highlights in the agrochemical sector
Global fertiliser prices are being influenced by a combination of energy costs, supply chain dynamics, geopolitical issues and seasonal demand. Lower costs of natural gas have caused monthly ammonia prices to drop significantly. The potential supply constraints due to US tariff’s and increasing demand resulted in an increase in urea prices.
Supply disruptions from Russia and Belarus, have driven up MOP prices, while China’s export restrictions on fertilisers continue to impact global availability. Additionally, the start of the planting season in the Northern Hemisphere, particularly in the US, Europe, and China, has fuelled demand for nitrogen-based fertilisers such as urea and DAP, further affecting price movements.
Source: GrainSA, Input price monitoring report, March 2025
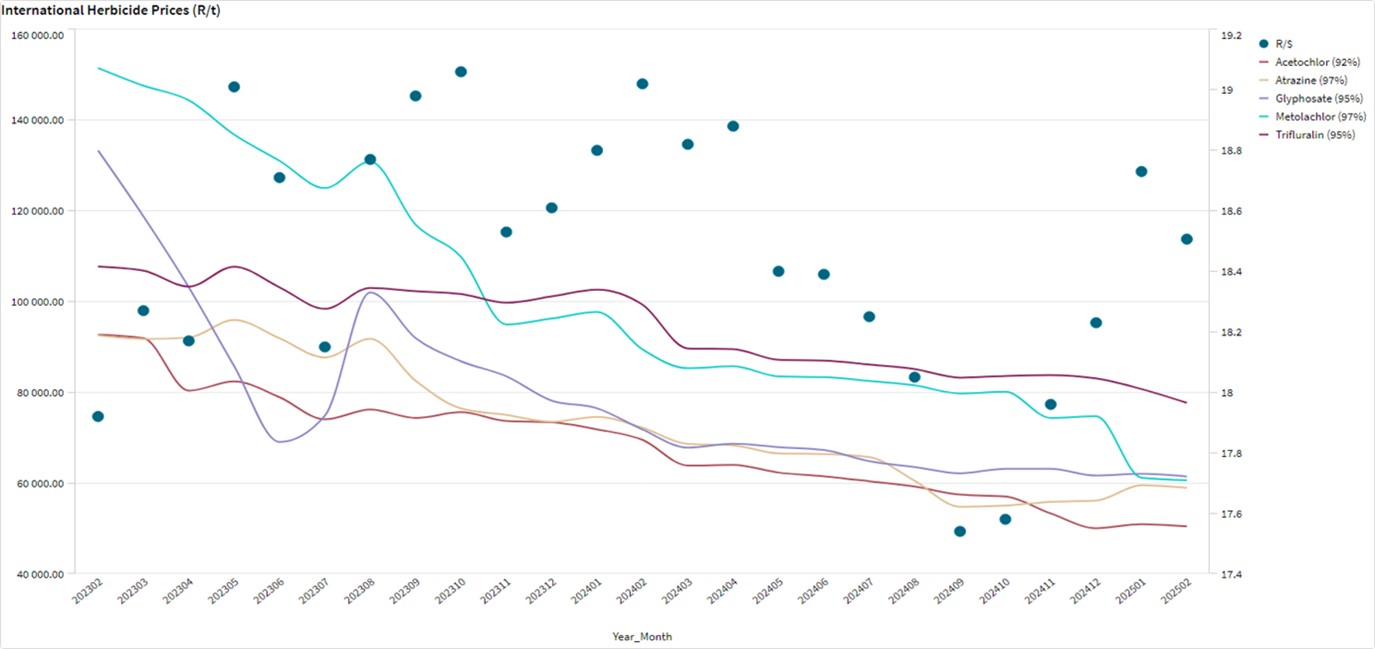
1. HERBICIDES
The following products are the main products regarding herbicides that may have an impact on input costs for producers.
Glyphosate (95%)
Acetochlor (92%)
Atrazine (97%)
Metolachlor (97%)
Trifluralin (95%)
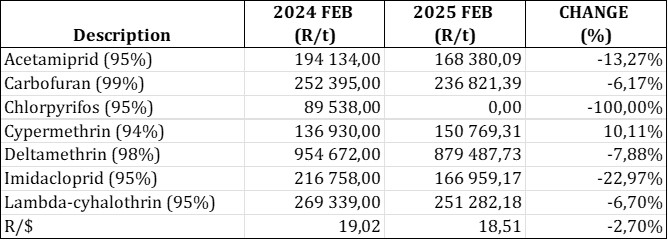
The following comparison is from the February 2025 Grain SA report which reports the previous month’s prices.
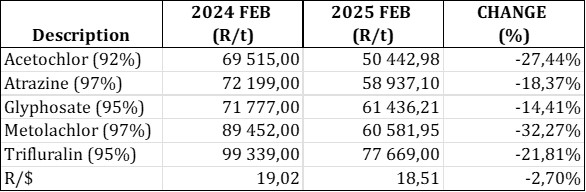
In comparison with the previous year’s prices, all of the products experienced a price decrease. Metolaochlor had the biggest decrease with 32,27%.
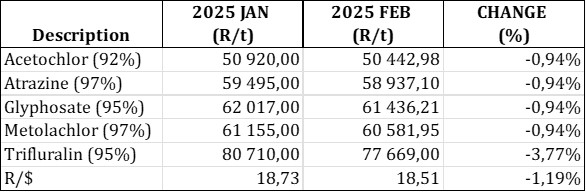
For the two months compared all of the products experienced a slight price decrease. Trifluralin experienced the biggest decrease with 3,77%.
The graph below shows the international herbicides prices (R/t) per product from February 2023 to date.
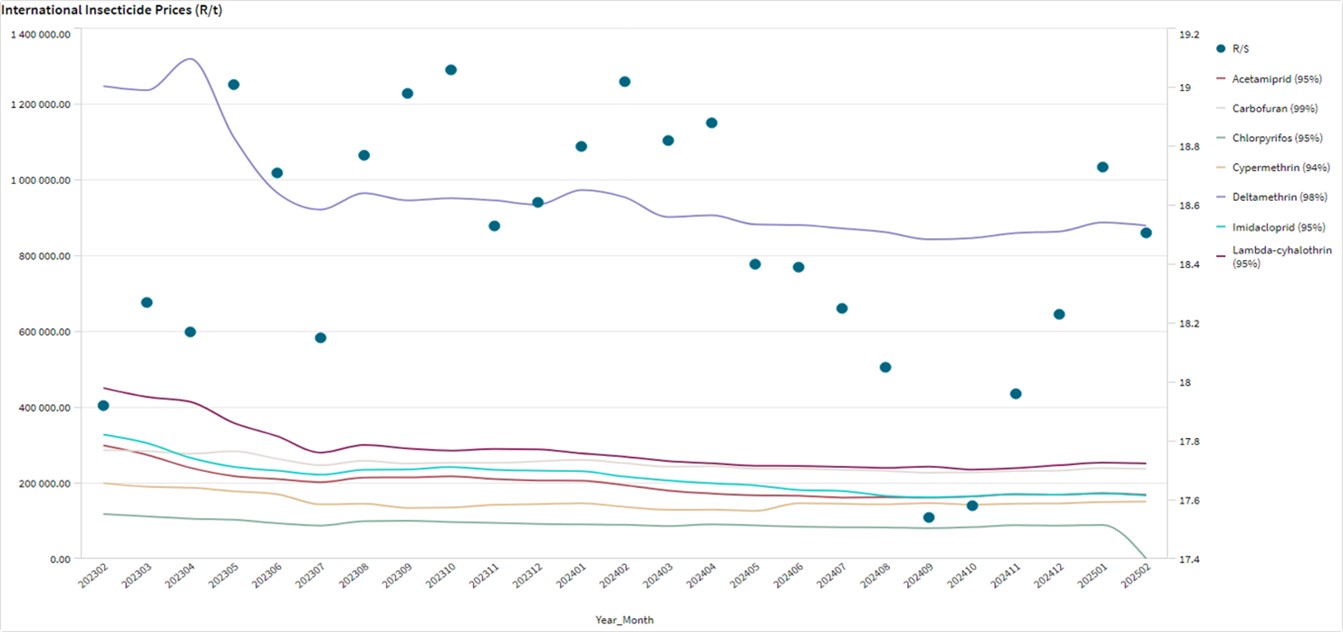
2. INSECTICIDES
The following products are the main products regarding insecticides that may have an impact on input costs for producers.
Imidacloprid (95%)
Lambda-cyhalothrin (95%)
Carbofuran (99%)
Deltamethrin (98%)
Acetamiprid (95%)
Chlorpyrifos (95%)
Cypermethrin (94%)
* Please note: The price of Chlorpyrifos was not included in the data used to generate the tables and the graph, thus it shows a value of R0,00 for the month of February.
In comparison with the previous year’s prices, all of the products experienced a price decrease. Imidacloprid experienced the biggest price decrease with 22,97%.
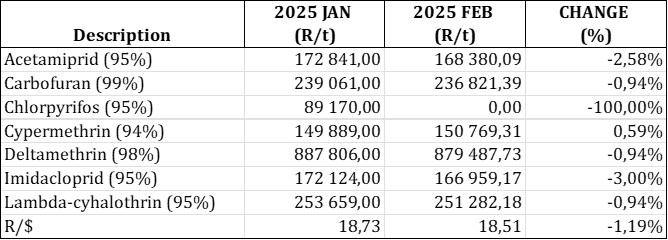
For the two months compared one of the products experienced a price increase. Cypermethrin increased with 0.59%.
The graph below shows the international insecticide prices (R/t) per product from February 2023 to date.
3. FERTILISER
The following fertiliser products are being analysed:
Ammonia (Middle East)
Urea (46%) (Eastern Europe)
DAP (USA Gulf)
KCL (CIS)
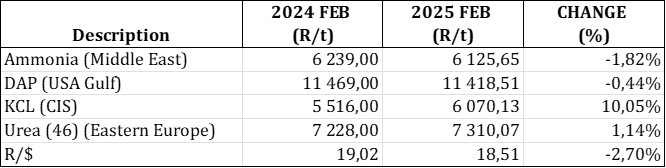
In comparison with the previous year’s prices, two of the products experienced price increases with KCL increased with 10,05%.
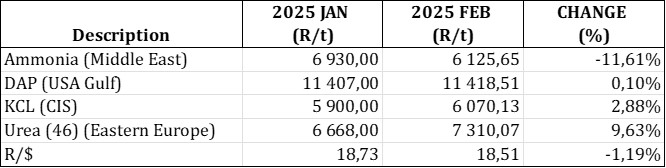
In comparison with the previous month’s prices most of the products experienced a price increase with Urea increasing the most with 9,63%.
The graph below shows the International Fertiliser prices (R/t) per product from February 2023 to date.
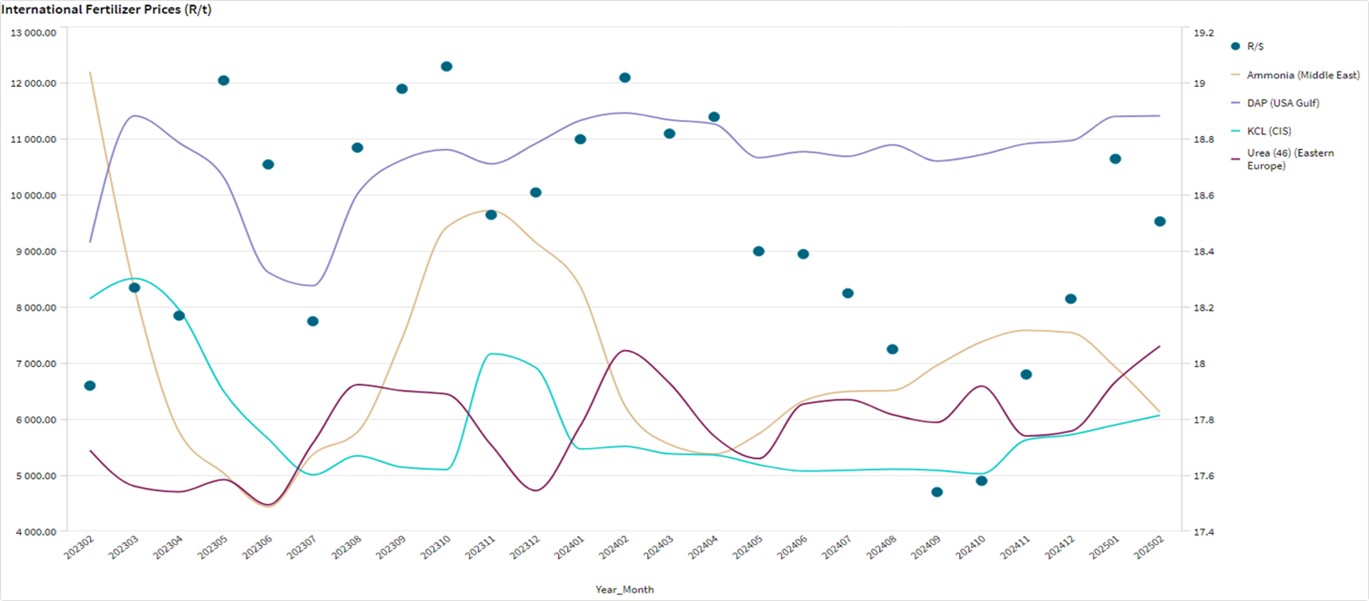
Nitrogen:
Urea: Prices in the Middle East are below $400/t. Aggressive trading has reduced the USA and Brazil prices to $390/t. The second quarter of the year can expect further declines in prices.
Ammonia: Due to recent tenders Ammonium Sulphate prices in China have decreased. The seasonal application has stabilised Ammonium Nitrate prices in Brazil, and the decreasing prices caused a decrease in demand for the product in Europe. A continuous decrease in Ammonia prices can be seen in all regions.
Phosphate and potash:
Phosphate: Limited supply is keeping phosphate prices firm. Brazil MAP prices are rising slightly, expecting to continue increasing. Ethiopia’s tender might provide additional price support. Brazil’s planting season is starting soon and as a result Brazil purchased a lot of potash and this caused prices to increase. South Africa has enough potash reserves for now.
Potash: Potash prices are increasing, with Brazil leading the trend, nearing $340/t CFR and expected to hit $350/t in May to June. Despite a delayed 25% tariff on Canadian potash, US prices are still increasing.
Source: https://www.grainsa.co.za/upload/report_files/Chemical-and-Fertilizer-Report-Mar-2025_.pdf
Future prices
The graphs below illustrate the market sentiment for maize, in the form of future contracts, for the upcoming contract months. The market sentiment is the expectation of supply and demand fundamentals relating to white and yellow maize in South Africa.
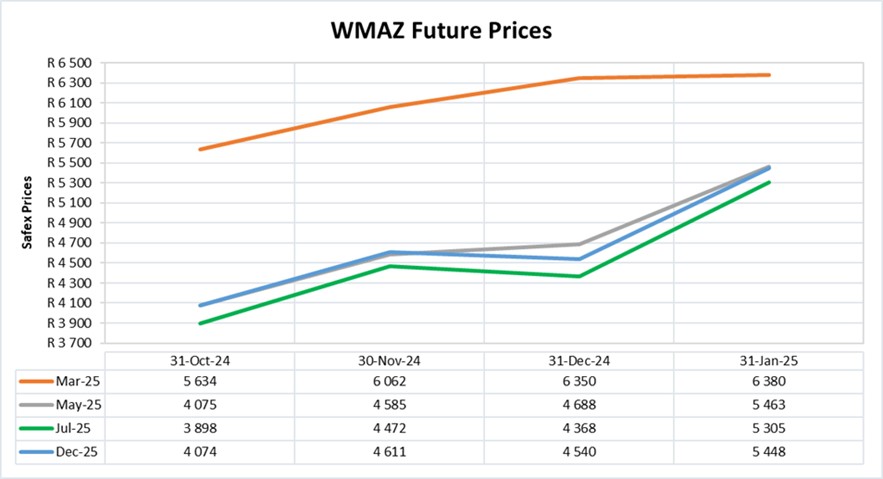
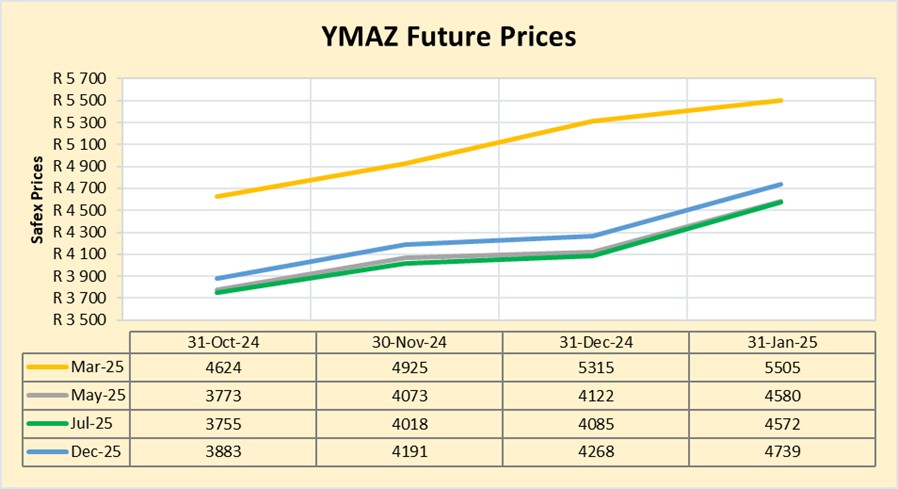
DOMESTIC MARKET OVERVIEW
White maize faced price increases and reached up to R6 871 per tonne in January. The forecast for relief in the second quarter of 2025, as production picks up, offers a glimmer of hope. As seen in the graphs above prices are predicted to ease later this year compared to higher spot prices in March 2025.
Early deliveries for the 2025/2026 marketing year could also help alleviate some of the pressure on the market, assuming the new crop is sufficient to meet the demand. It will be interesting to see how the market responds as we move into the second quarter and whether the anticipated relief materializes in time. The imported white maize will also bring some relief.
Sources: https://agbiz.co.za/article/south-african-white-maize-prices-may-remain-high-for-some-time-143
https://www.moneyweb.co.za/news/south-africa/sa-receives-first-shipment-of-imported-white-maize-since-2017/
Fraud risk
FRAUD AWARENESS
2024 provided us with a few rare glimpses of deepfakes, voice clones and AI-generated phishing scams, some experts claim that these were merely ‘training wheels’ for fraudsters as they tested the waters. Many believe that 2025 will become the year AI scams become a dominant force with regards to draining fintech and bank accounts.
Over the next few months, we will delve into some of the AI scams believed to surge in 2025.
The first will be the impact of AI and deepfakes on the evolution of Business Email Compromise (BEC) attacks: In two separate schemes in Hong Kong in 2024, fraudsters used AI-generated video and audio to impersonate company executives on Zoom calla, convincing employees to transfer nearly $30 million in funds.
AI use in BEC attacks is everywhere, and here are a few possible reasons as to why AI-generated and deepfakes BEC are so popular:
- They work: Fraudsters don’t waste time, and deepfake BEC have proven to be a method that works.
- The Return of Investment (ROI) is there: With an average payoff of several million dollars, scammers are likely to invest their money because the ROI is there.
- Convincing: Deepfakes take BEC scams to another level because they can push a victim to send the wire when they might not have believed, just an email or messages before.
An American firm, VIPRE Security Group, reported that 49% of detected spam emails are categorised as BEC emails, and 40% of BEC emails are generated by AI.
Source:
https://www.forbes.com/sites/frankmckenna/2024/12/16/5-ai-scams-set-to-surge-in-2025-what-you-need-to-know/
https://www.securitymagazine.com/articles/100927-ai-is-responsible-for-40-of-business-email-compromise-bec-emails
https://frankonfraud.com/familiar-faces-deepfake-bec-zoom-calls-are-emerging/


