


The NWK Limited Agricultural Economic Report provides an overview of the main external factors that NWK and his clients are exposed to at a specific point in time. This report opts to aid in a timely basis to foresee external market and other factors that may have an impact on any business and clients. The main focus of this document is to have a closer look at external factors that can affect any business and our customers.
Executive summary
External factors that can affect any business and its customers include various economic factors. This report will focus on monthly or quarterly changes of these economic factors.
The inflation rate rose to 4,5% in May 2026. Retail trade growth rose by 1,3% in April 2026. The unemployment rate rose further to 32,7% in Q1 of 2026.
The GDP growth for the first quarter of 2026 grew with 0,5%, following a 0,4% growth in the previous period. The Policy Uncertainty Index rose to 77,8 in Q1 2026 (baseline 50) compared to 64,9 in Q4 2025.
An external factor that is of great concern to any agricultural business is the weather and climate outlooks. These factors include long term climate risks, such as drought and heat stress, as well as the current status of the El Niño and La Niña climate phenomenon. The El Niño Southern Oscillation (ENSO) is currently on El Niño advisory. El Niño conditions will strengthen during 2026 and persist into early 2027.
The March 2026 National Agricultural Marketing Council (NAMC) report estimates the projected closing stock level on 30 April 2027 for white and yellow maize to be more than that of the 2025/2026 marketing season.
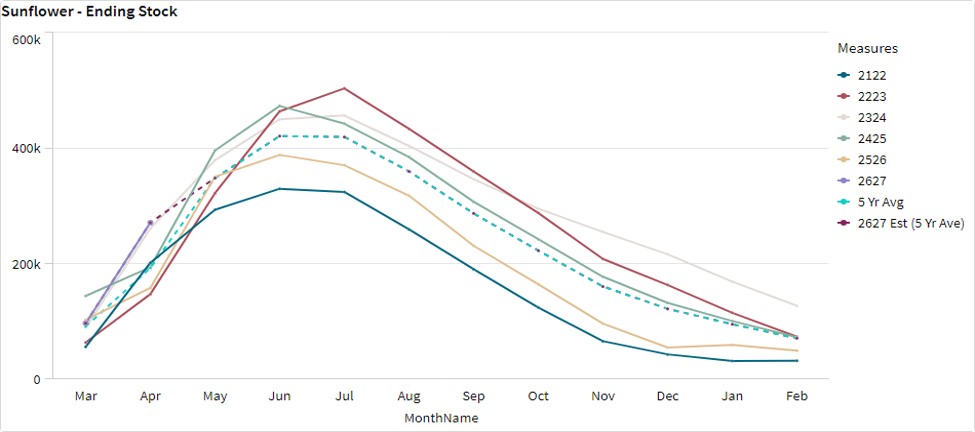
The projected soya ending stock for February 2027 is 468 510 t, which is more than the final for the 2025/2026 season of 286 529 t. The projected sunflower ending stock for February 2027 is 119 446 t, that is more than the final for the 2025/2026 season of 49 266 t.
During the previous Monetary Policy Committee (MPC) meeting held on 28 May, the committee decided that interest rates will remain the same. The repo rate is currently 7% and the prime rate 10,25%.
Business climate – key risk drivers
A few highlights regarding certain risk drivers are mentioned below.
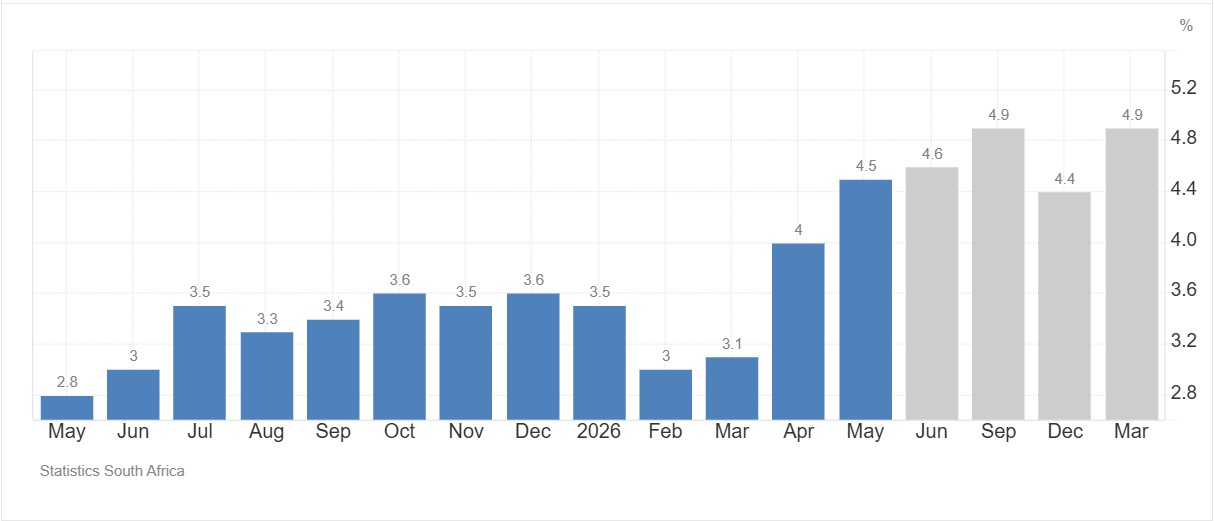
According to Trading Economics, South Africa’s annual inflation rate rose for the third month to 4,5% in May 2026. The inflation rate is expected to be 4,6% by the end of this quarter. In the long-term, the South Africa Inflation Rate is projected to trend around 3,7% in 2027 and 3% in 2028.
Brent crude oil monthly average prices decreased by $7,90 per barrel. Iron ore decreased slightly by $2,83 per metric ton on a monthly average.
South Africa’s retail trade rose by 1,3 % year-on-year in April 2026, following a downwardly revised 2,5% surge in the prior month. According to Statistics SA, South Africa’s unemployment rate rose to 32,7% in Q1 2026.
The GDP growth rate expanded by 0,5% in the first quarter of 2026. Nine of the ten industries experienced an increase.
The Safex maize prices followed the global trend, increasing modestly by 1,2% month-on-month for white maize and 1% for yellow maize. Locally analysts expect maize prices to recover only in the second half of the year, driven by the anticipated El Niño weather phenomenon, which is likely to raise regional demand and provide support to prices towards year-end.
The El Niño–Southern Oscillation (ENSO) is on El Niño advisory. El Niño conditions are strengthening across the tropical Pacific, with SST anomalies in the Niño 3.4 region showing a steady upward trend. A strong El Niño event is likely to develop and remain in place through late 2026, with potentially severe climate impacts extending into 2027.
The Policy Uncertainty Index (PUI) rose to 77,8 (baseline 50) compared to 64m9 in 4Q 2025. The elevated PUI in the first quarter of 2026 reflected a sharp increase in economic uncertainty, mainly driven by the current Middle East global energy crisis.
Sources: https://tradingeconomics.com/south-africa/inflation-cpi
https://tradingeconomics.com/commodity/brent-crude-oil
https://tradingeconomics.com/south-africa/unemployment-rate
https://www.statssa.gov.za/?page_id=737&id=1
https://tradingeconomics.com/south-africa/gdp-growth
https://agrink.co.za/downloads/ABSA%20Agri%20Trends%20Grains%20and%20Veggies.pdf
https://tradingeconomics.com/commodity/iron-ore
PUI_2026Q1.pdf
Agribusiness Confidence Index (ACI) Q2, 2026
The Agricultural Business Chamber conducts a quarterly survey to compile the Agribusiness Confidence Index (ACI), reflecting the views of at least 25 decision-makers in the agricultural sector.
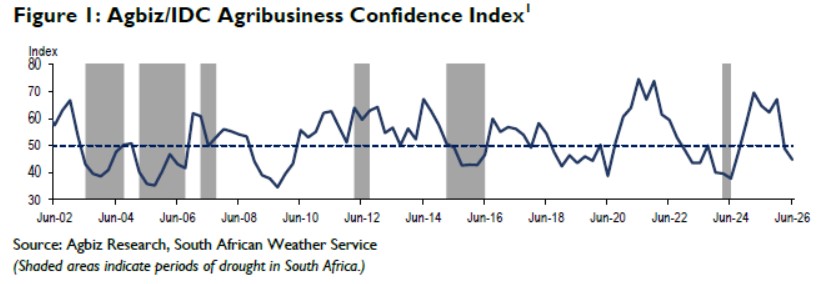
Following an 18-point decline in Q1 2026, the Agbiz/IDC Agribusiness Confidence Index (ACI) fell further by 4 points to 45 in Q2, its lowest level since Q2 2024. The factors underpinning the subdued sentiment were broad.
Survey respondents cited the impact of the Middle East conflict on energy and fertiliser prices as a major concern (the Q2 survey was conducted before the announcement of the US-Iran agreement). The lingering impact of foot-and-mouth disease, which continues to impose immense financial pressure on the cattle industry, remains a major challenge despite accelerated vaccine imports.
Moreover, lower global prices in the sugar and wheat industries are among the key constraints that some respondents highlighted as major risks weighing on sentiment, as is the slow domestic import tariff response, which should ordinarily have provided some level of cushion. Meanwhile, reports that El Niño weather conditions may characterise the 2026/2027 production season have added to concerns about the outlook.
The current ACI level of 45 is below the 50-neutral mark, indicating that South African agribusinesses remain pessimistic about business conditions. This survey was conducted in the second week of June and covered businesses across agricultural subsectors nationwide.
Discussion of the subindices
The ACI comprises ten subindices, and some declined further in Q2 2026. Here is the detailed view of the subindices.
- The capital investments subindex dropped by 20 points from Q1 2026 to 33, which is the lowest level since 2006. This sharp decline mirrors the sector’s general mood, driven by the factors we highlighted above, rather than overall activity. For example, producers have continued to invest in tractors and combine harvesters, amongst other infrastructure and expansion.
- The sub-index measuring export volumes deteriorated by 13 points from Q1 2026 to 38 in Q2. Concerns about the impact of the Middle East conflict on logistics, along with rising shipping costs, are the primary challenges here. Still, the actual activity points in a different direction, as exports have remained fairly strong. For example, in Q1 2026, South Africa’s agricultural exports totalled US$3,7 billion, up 11% from the same period a year ago.
- The general economic conditions subindex fell by 33 points to 28 in Q2 2026, the lowest level since Q3 2023. This is unsurprising, as the war in the Middle East has added uncertainty to macroeconomic conditions.
- On the positive side, the turnover subindex confidence increased by 17 points from Q1 2026 to 67. This was primarily driven by the maple harvest in grains, oilseeds and the various fruits and vegetables. Similarly, the net operating income subindex increased by 7 points to 50 in Q2 2026.
- The market share subindex lifted by 8 points to 61 in Q2 2026. This improvement in mood mirrors the ample harvest in horticulture and field crops, and the excellent export performance so far this year.
- The employment subindex increased by 16 points to 56 in Q2 2026. This is also unsurprising as the South African agricultural sector continues to create more jobs. In Q1 2026, farm jobs increased by 3% from the same period a year earlier to 960 000 jobs (up by 1% from the last quarter of 2025). This uptick in agricultural employment is unsurprising as the sector has generally enjoyed favourable production conditions in 2025 through to the start of this year.
- The general agricultural conditions subindex increased 22 points to 61 in Q2 2026. This improvement is primarily driven by the field crops and horticulture subsectors, which benefited from the La Niña rains. Meanwhile, the cattle industry and the pork producers remain constrained by animal diseases. The sector’s broadly improved operating conditions were also reflected in the recent GDP figures, with agricultural gross value-added expanding by 3,9% quarter-on-quarter (seasonally adjusted) in the first quarter of 2026, up from 0,4% in the last quarter of 2025.
Changes in interpretation
- The subindices of the debtor provision for bad debt and financing costs are interpreted differently from the abovementioned indices. A decline is viewed as a favourable development, while an increase signals growing financial strain.
- In Q2 2026, the debtor provision for bad debts indices fell by 6 points to 33, reflecting gains from the favourable harvest in field crops and horticulture. The financing costs index declined by 45 points to 17. This came as a surprise, as the recent uptick in interest rates has slightly increased borrowing costs.
Concluding remarks
Similar to the start of the year, the ACI results for Q2 2026 show that all is not well in South Africa’s agriculture. “While the pace of importing vaccines has been encouraging, the challenge of the foot and mouth disease continues to linger. The livestock and pig industries are under immense financial pressure due to the disease, and these results reflect the challenge at hand. What remains key is a speedy vaccination process that will get us off the current worrying path. The cost pressures of the Middle East conflict and the increased likelihood of unfavourable weather conditions over the coming production season are top-of-mind concerns for agribusinesses,” said Wandile Sihlobo, chief economist of the Agricultural Business Chamber of South Africa (Agbiz).
ISSUED BY:
Wandile Sihlobo
Chief Economist, Agricultural Business Chamber of South Africa (Agbiz)
E-mail: wandile@agbiz.co.za
https://agbiz.co.za/content/economic-research?page=agribusiness-confidenc
Fact of the month
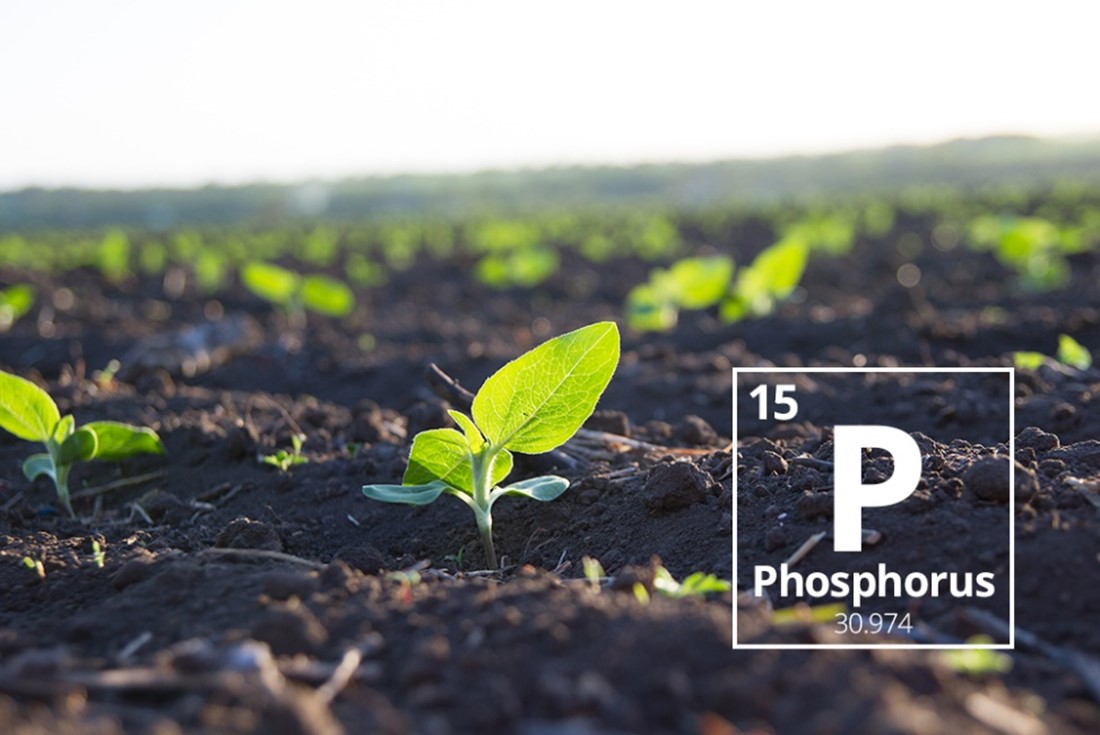
Phosphorus is like a plant’s power engine. It helps turn sunlight into energy, forms part of DNA and ATP (the plant’s “energy unit”). Some specific growth factors associated with phosphorus are:
– Stimulated root development
– Increased stalk and stem strength
– Improved flower formation and seed production
– More uniform and earlier crop maturity
– Increased nitrogen N-fixing capacity of legumes
– Improvements in crop quality
– Increased resistance to plant diseases
– Supports development throughout entire lifecycle.
https://www.cropnutrition.com/nutrient-management/phosphorus/
Weather and climate
NATIONAL ASSESSMENT
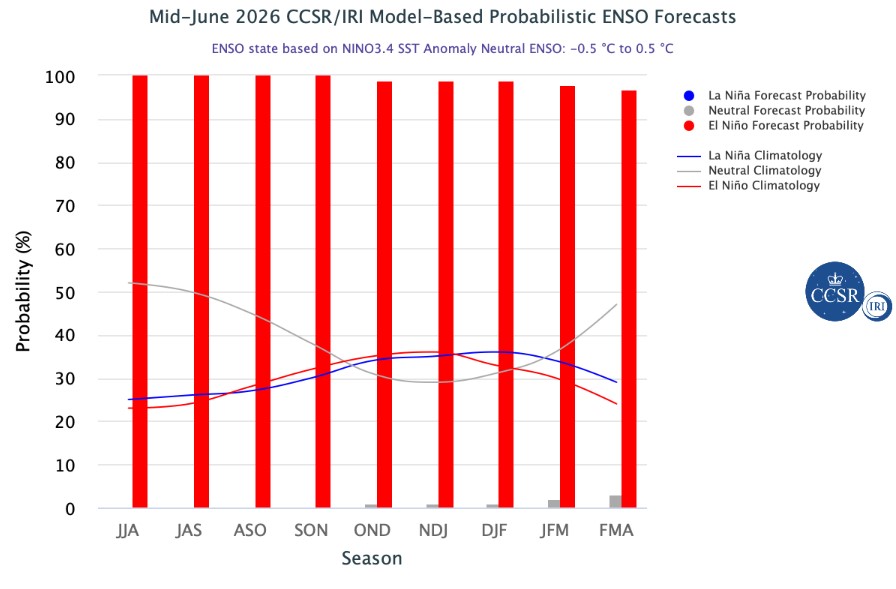
El Niño conditions are strengthening across the tropical Pacific, with SST anomalies in the Niño 3.4 region showing a steady upward trend. The observed SST anomaly reached +0,48°C during March to May 2026 and increased to +0,94°C in May 2026. The latest weekly Niño 3.4 index, centred on June 17, 2026, climbed further to +1,7°C. Together, these observations indicate that Pacific Ocean conditions have transitioned into El Niño conditions and are continuing to intensify toward a moderate-strength El Niño event.
https://iri.columbia.edu/our-expertise/climate/forecasts/enso/current/?enso_tab=enso-iri_plume
The Bureau of Meteorology’s model indicates that El Niño is underway in the tropical Pacific. All models, including the Bureau’s, forecast the tropical Pacific to continue warming in the coming months. Forecasts are pointing towards a strong to very strong El Niño event, based on the extent of warming in the central tropical Pacific. Around half of the models indicate this event could peak at levels among the highest observed since 1950..
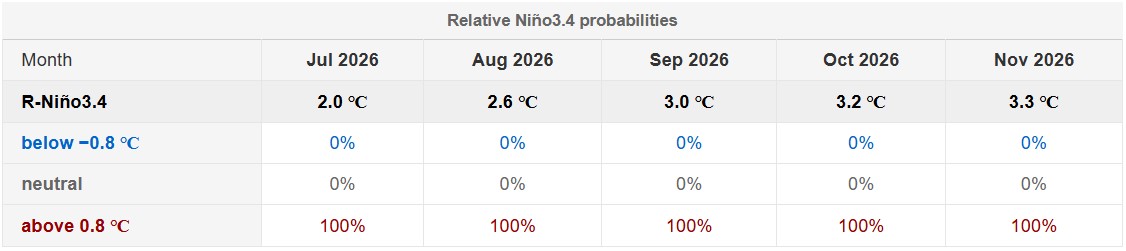
The graph below reflects current El Niño in the tropical Pacific and supports the strong El Niño forecast.
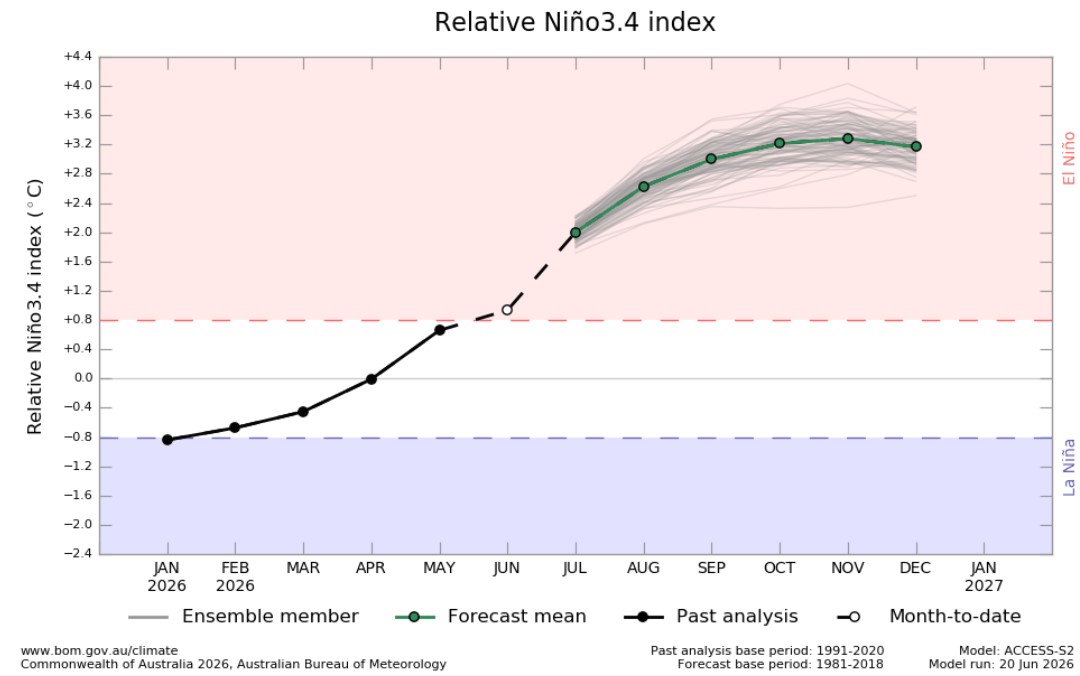
http://www.bom.gov.au/climate/ocean/outlooks/?index=nino34
The latest Climate Watch issued by the SA Weather Service (02 June2026) states that during winter and early spring seasons, only the southern, south-western, and eastern coastal regions of the country receive significant rainfall. The forecast indicates that above-normal rainfall is anticipated in the eastern coastal areas, which is likely to bring positive impacts for crop and livestock production.
However, the south-western and southern coastal areas of the country, which normally receive significant rainfall during winter and early spring, are expected to receive below-normal rainfall during this period.
Below-normal rainfall conditions in these areas are expected to have a significant impact on crop and livestock production. Therefore, the relevant decision-makers are encouraged to advise farmers in these regions to practice soil and water conservation, proper water harvesting and storage, and other appropriate farming practices.
Source: https://www.weathersa.co.za/Documents/SeasonalForecast/SCOLF202605_02062026234634.pdf
SUNSPOTS
Sunspots are darker, cooler areas on the sun’s surface that arise due to disturbances in the sun’s magnetic field. Sunspots vary in numbers throughout the 11-year solar cycle.
According to a study published on Science Direct the rainfall rate can be directly related to the sunspot number, but shows different characteristics during solar maximum (the peak of the sun’s 11-year solar cycle) years. Though a lag correlation exists between sunspot number and rainfall, sunspots have an increasing effect on rainfall. Studies show that the more sunspots are present the higher the rainfall and the less sunspots the lower the rainfall.
ENSO (El Niño Southern Oscillation) occurs at irregular intervals between three and seven years causing global climate system variation. Considering this event occurs periodically, it might be triggered by the 11-year solar cycle as an energy source.
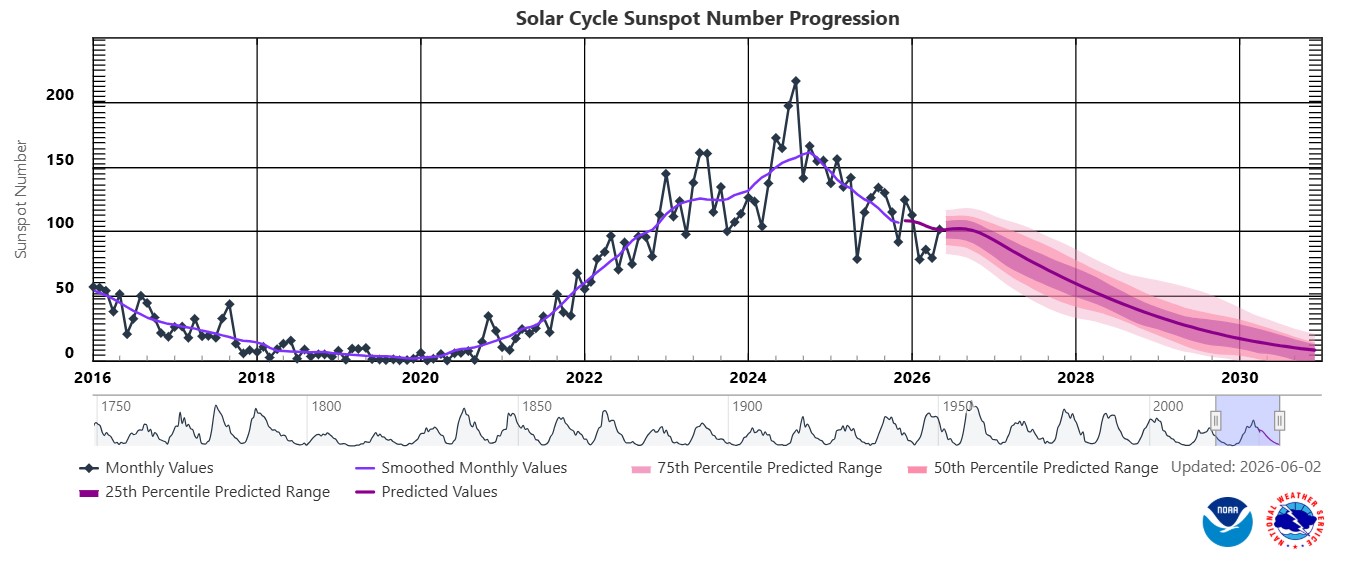
The graph below shows the latest 11-year solar cycle. An upward trajectory suggests that higher rainfall can be expected, characteristic of a La Niña. A downward trajectory suggests that lower rainfall can be expected, characteristic of an El Niña.
Between October 2020 to February 2025 the actual sunspot numbers were higher than the predicted values. Nay 2026 falls within the predicted range, with a monthly mean sunspot value of 101.4.
Sources:https://www.spaceweatherlive.com/en/solar-activity/solar-cycle.html https://www.sciencedirect.com/science/article/abs/pii/S136468262200116X#:~:text=It%20was%20observed%20that%20rainfall,an%20increasing%20effect%20on%20rainfall
https://www.space.com/solar-cycle-frequency-prediction-facts
https://eos.org/articles/why-did-sunspots-disappear-for-70-years-nearby-star-holds-clues https://aip.scitation.org/doi/abs/10.1063/1.4930679?journalCode=apc#:~:text=ENSO%20occurs%20at%20irregular%20interval,cycle%20as%20an%20energy%20source
Market risk
GRAIN MARKET ANALYSIS
- Ending stock – national
Ending stock data is gathered from the NAMC. The estimates are reassessed and reported by the Grain & Oilseeds supply & demand estimates committee. The following is the projected ending stock for April 2027 in tonnages for the 2026/2027 season:
- White maize => 2 755 765 t
- Yellow maize => 1 340 630 t
The following is a summary of September 2026 ending stock projections for the 2025/2026 season:
- Wheat => 547 494 t
The following is a summary of the February 2027 projected ending stock for the 2026/2027 season:
- Sunflower => 119 446 t
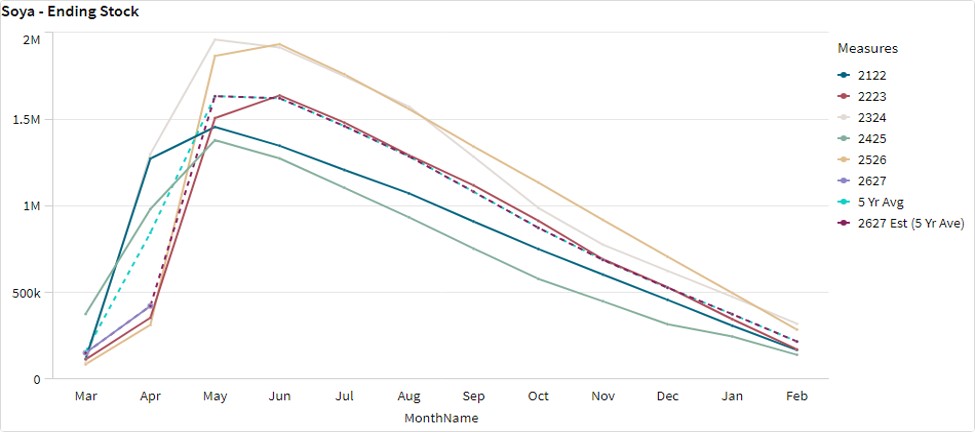
- Soybeans => 468 510 t
- Sorghum => 86 199 t
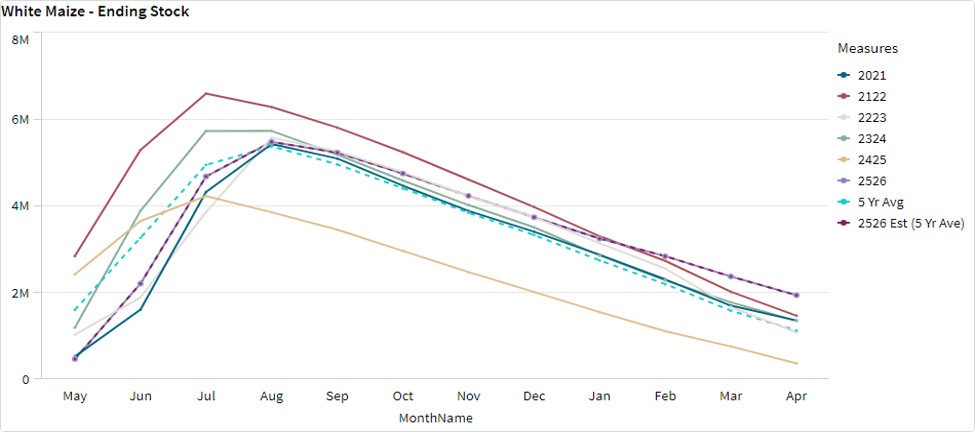
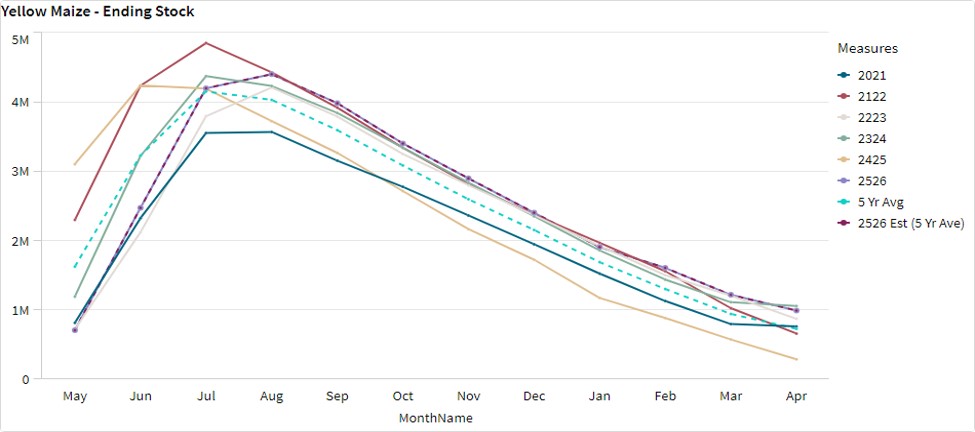
The graphs below show the predicted ending stock for the different commodities according to SAGIS data. A five-year average has been calculated to determine the estimated ending stock for the current season.
The estimated white maize ending stock for April 2027 is 2 755 765 t. That is 816 910 t more than the ending stock for the 2025/2026 season. The estimated yellow maize ending stock for April 2027 is 1 340 630 t. That is 350 497 t more than the ending stock for the 2025/2026 season.
The estimated soybean ending stock for the season 2026/2027 is 217 549 t based on the five-year average. This is 68 571 t less than the previous season.
- Crop estimations
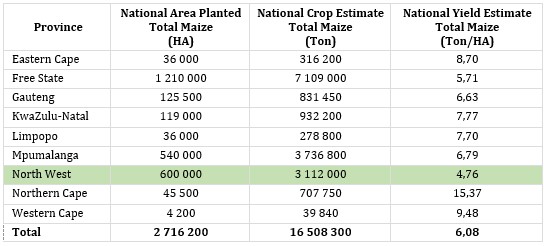
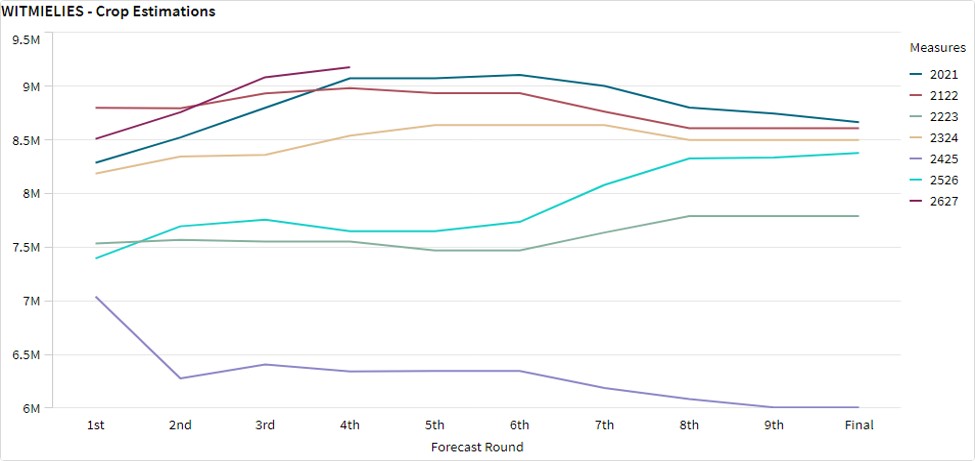
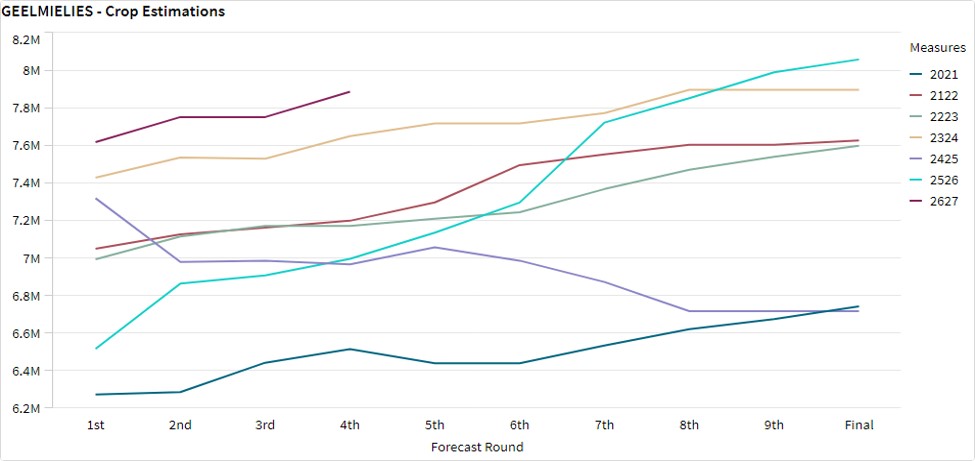
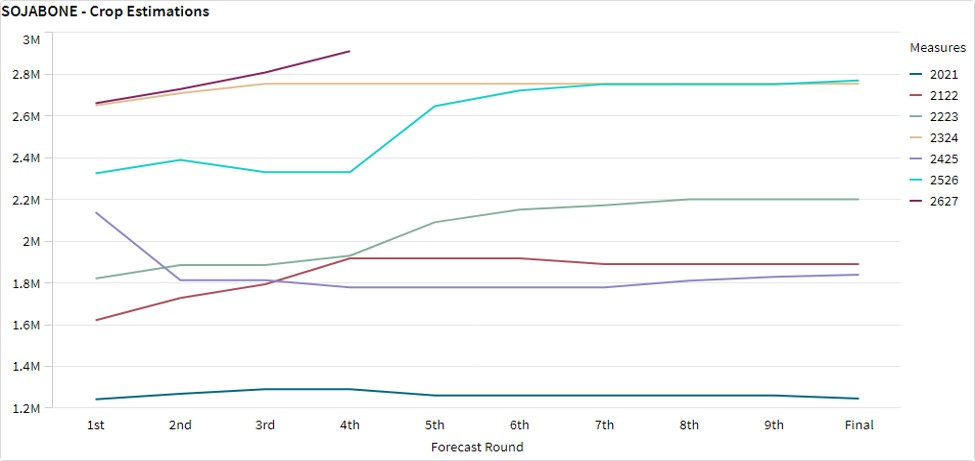
According to the Crop Estimate Committee (CEC) fourth production forecast for 2026, the total area estimate for maize in South Africa is 2,716 million ha, which is more than the 2,597 million ha planted for the previous season. The total forecasted tons for white and yellow maize are 17 million tons from the fourth forecast.
Source: CEC (Crop Estimates Committee)
- Production forecast sunflower
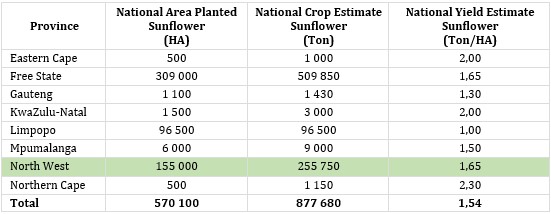
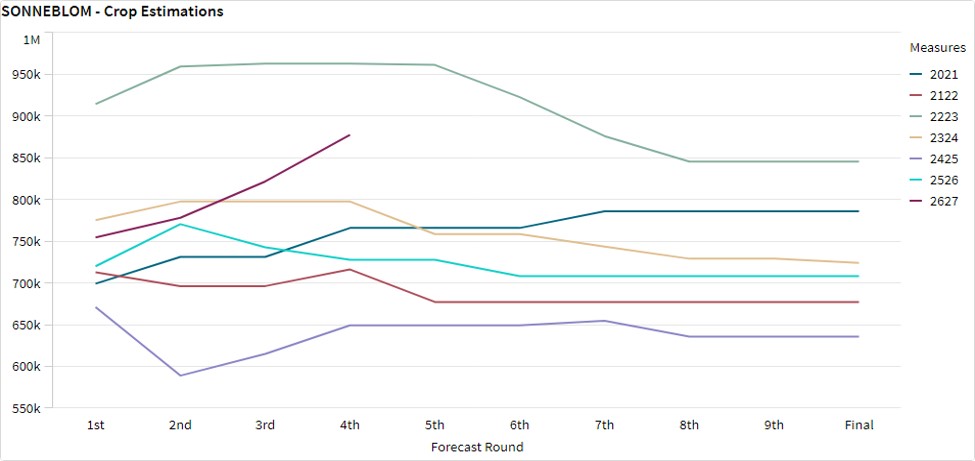
The production forecast for sunflower seed is 877 680 t. The area estimate for sunflower seed is 570 100 ha while the expected yield is 1,54 t/ha.
Source: CEC (Crop Estimates Committee)
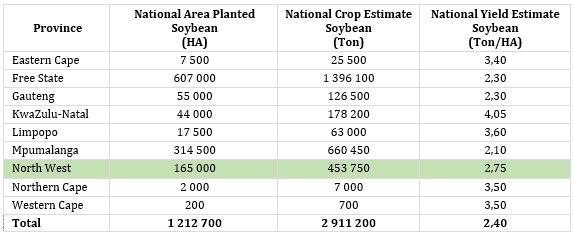
- Production forecast soybeans
The production forecast for soybeans is 2,911 million t. The estimated area for soybeans is 1,212 million ha with an expected yield of 2,40 t/ha.
Source: CEC (Crop Estimates Committee)
- Imports and exports – national
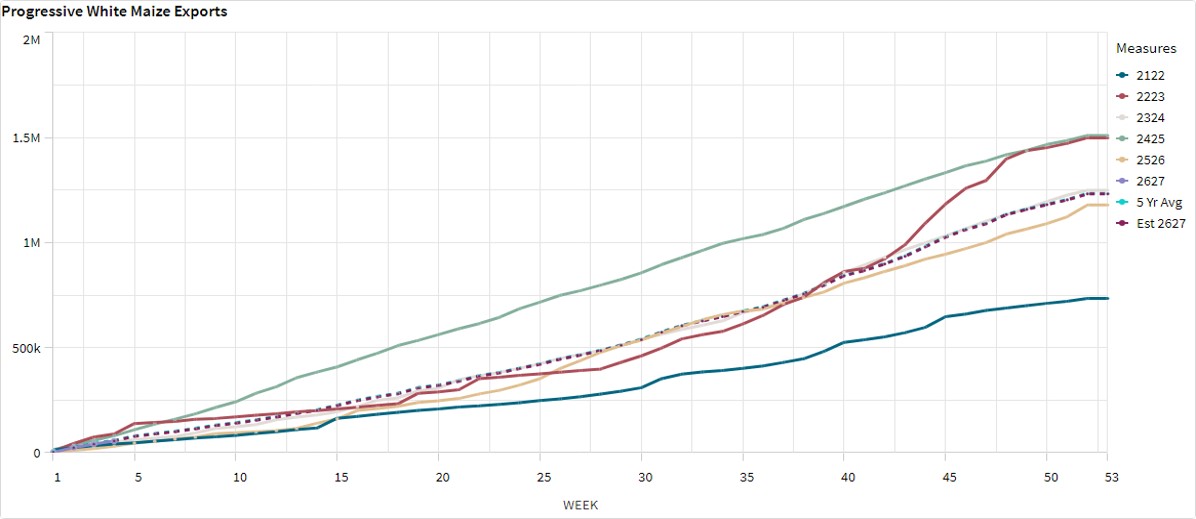
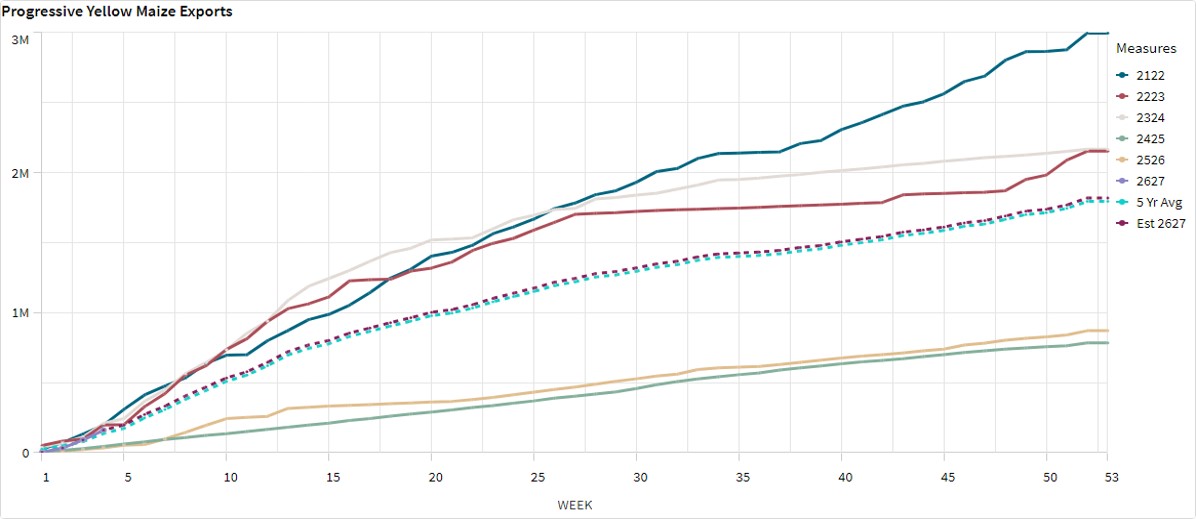
For the production season ending April 2026, 55 625 t of white maize and 160 723 t of yellow maize have been exported so far as seen in the graphs below (week 4).
- Parity prices
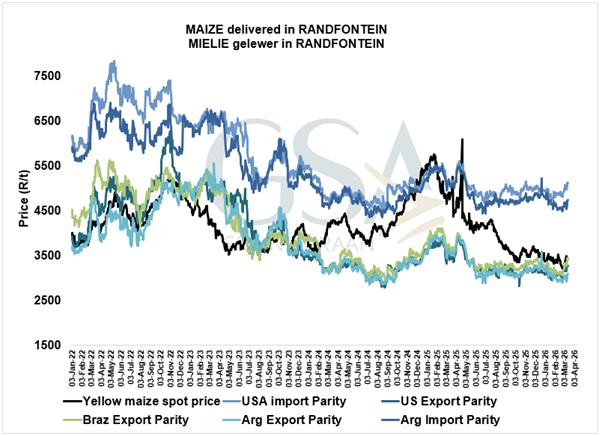
South Africa is a small producer compared to other countries and is thus a price taker (meaning that we cannot influence world prices). Because of this, our local prices are normally between import and export parity, which is illustrated in the figure below. An import parity price is defined as the price which a buyer will pay to buy the product on the world market. This price will include all the costs incurred to get the product delivered to the buyer’s destination.
An export parity price is defined as the price that a local seller could receive by selling his product on the world market e.g., excluding the export costs. The price which the seller obtains is based on the condition that he delivers the product at the nearest export point (usually a harbour) at his own expense.
The graph below reflects the Safex price, import parity and export parity of yellow maize as well as the Safex price of white maize. The import and export parity prices for white maize is not released by Grain SA for this period.
- Grain processing per province
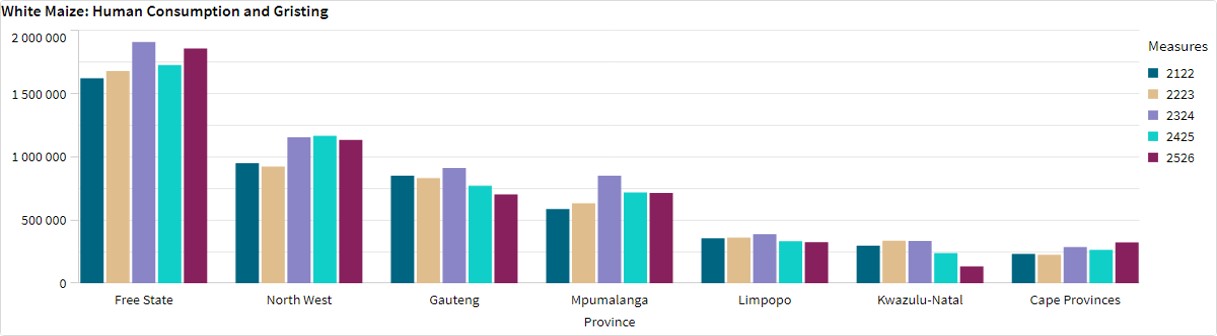
For the marketing year 2025/2026 – May 2025 to April 2026 – the Free State dominates the white maize that is used for human consumption and gristing. North West consumed the second most white maize produced for human consumption for the marketing year.
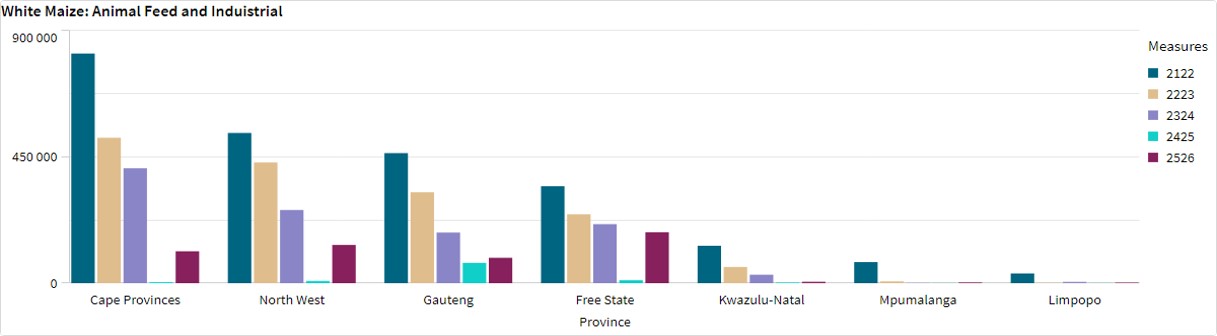
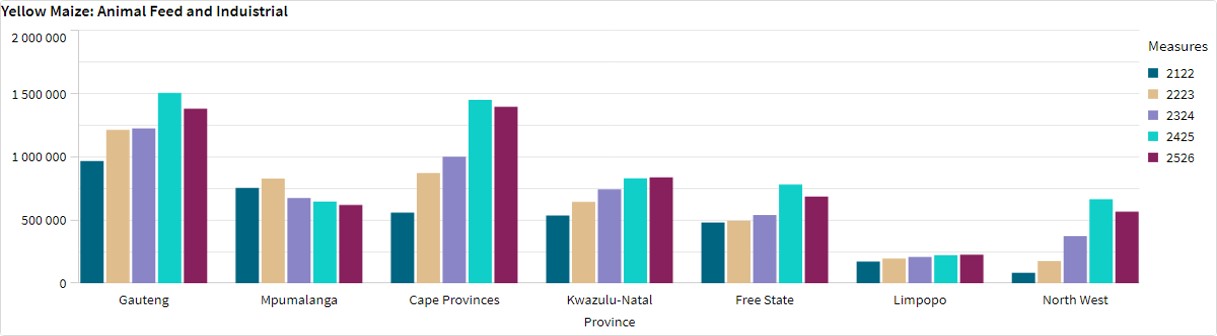
The Free State used the most, white maize for animal feed and industrial usage with North West using the second most.
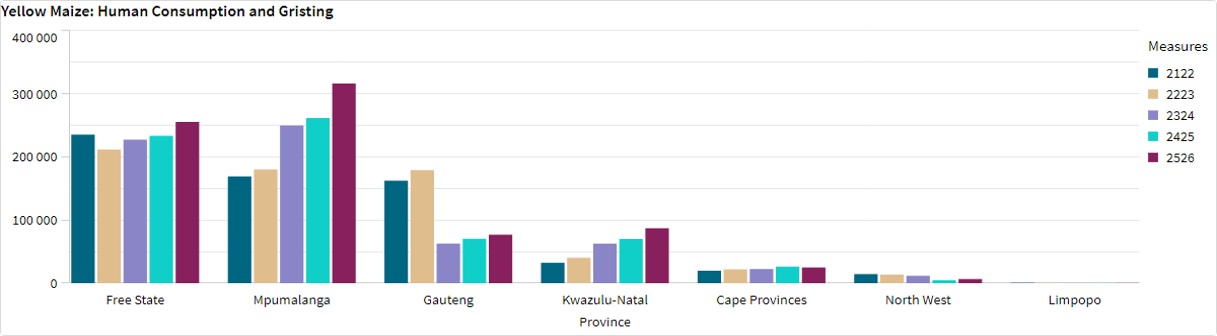
Mpumalanga processed the most yellow maize for consumption and gristing and the Cape Provinces processed the most yellow maize for animal feed and industrial purposes.
- Exchange rate
NWK Group is exposed to foreign exchange rate risk in various business areas, such as commodity prices and trade imports, etc.
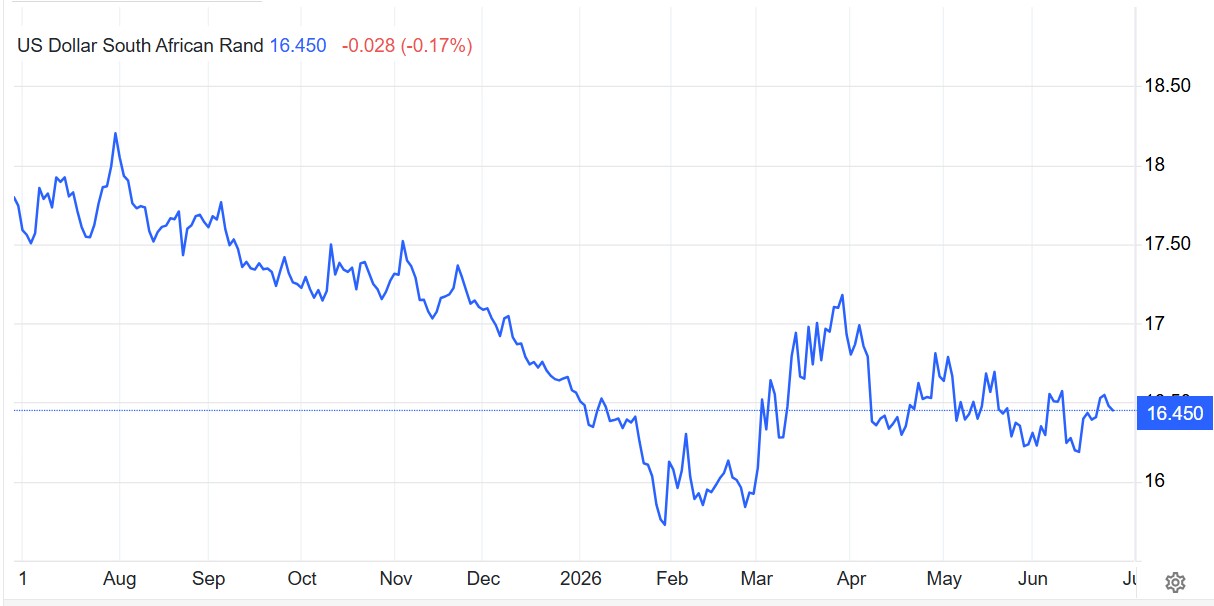
The South African rand has traded around 16,5 per USD since April, amid a resilient US dollar and heightened volatility in key precious metals, particularly gold and PGMs. This has been largely attributed to the Middle East conflict, which has contributed to increased global uncertainty and reinforced safe-haven demand for the greenback.
Source: Trading Economics.
Interest rate
All major rating agencies, i.e., Moody’s, S&P and Fitch, have South Africa’s credit ratings in sub-investment-grade territory. S&P, however, raised the country’s investment status for the first time in nearly two decades from BB- to BB.
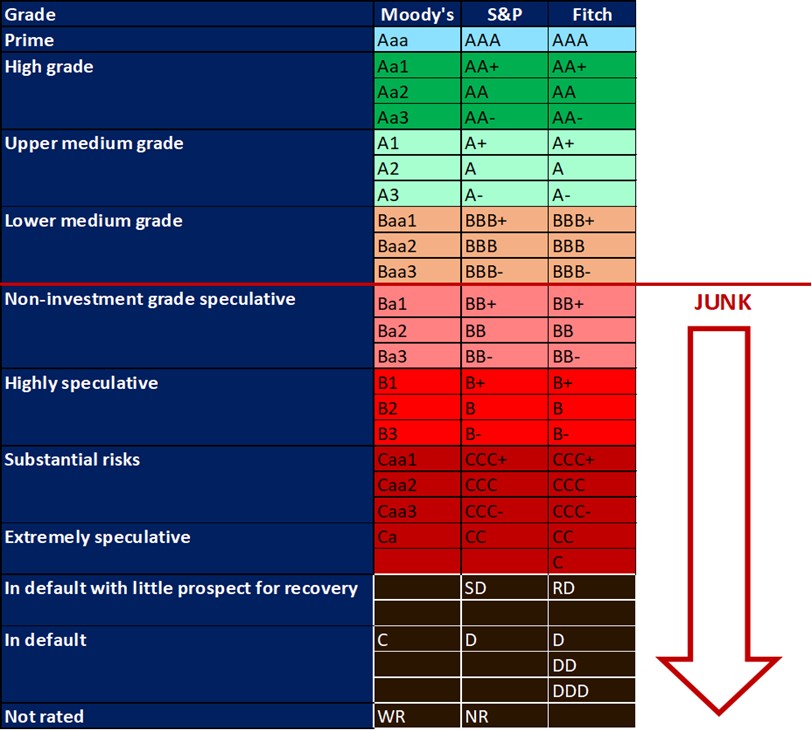
The South African Reserve Bank is also having new discussions around the repo rate, how it is calculated and whether it should still exist. The rate has been fixed at 350 basis points above the country’s monetary policy rate since 2001. These discussions will be monitored over time to see how things unfold.
Source: https://www.spglobal.com/ratings/en/regulatory/article/-/view/type/HTML/id/3479175
https://www.moneyweb.co.za/news/economy/kganyago-favours-ending-use-of-prime-rate/
https://www.moneyweb.co.za/moneyweb-radio/safm-market-update/prime-interest-rate-what-is-it-and-do-we-need-it/
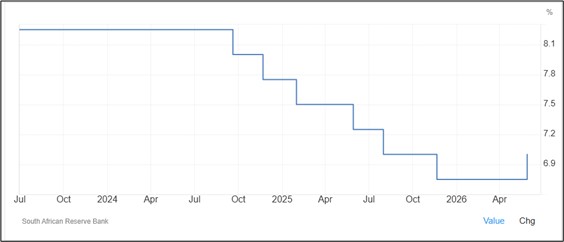
Interest rate: During the previous Monetary Policy Committee (MPC) meeting held on 28 May 2026 the committee decided to keep interest rates unchanged. The repo rate rose to 7% and the prime rate is 10,25%. The next MPC meeting will be held on 23 July 2026.
Interest rate movement:
30th January 2025 – 11,00%
20th March 2025 – 11,00%
29th May 2025 – 10,75%
31st July 2025 – 10,50%
18th September 2025 – 10,50%
20th November – 10,25%
29th January – 10,25%
26th March – 10,25%
28th May – 10,25%
- Current interest rate
The South African Reserve Bank raised its key repo rate by 25 bps to 7% on May 28, 2026, as widely expected, marking its first-rate hike since 2023. Four of the six members of the MPC backed the decision, while two voted to hold. The committee said inflation risks had increased due to the Middle East crisis and warned that overlapping shocks could trigger second-round effects, justifying a monetary policy response to contain risks and bring inflation back to target.
South Africa’s inflation rate climbed to 4% in April from 3,1% in March, now sitting at the upper end of the central bank’s target range. Overall, Inflation forecasts were raised to 4,4% for 2026 (from 3,7%) and to 3,7% for 2027 (from 3,3%).
Regarding economic activity, the central bank lowered its growth forecasts for 2026 to 1,2% (vs 1,4%) and for 2027 to 1,7% (vs 1,9%). The policy statement was again accompanied by three alternative scenarios, all pointing to some additional monetary policy tightening.
Source: South African Reserve Bank: Trading economics
- Inflation rate
As the inflation rate is a driver for increases and decreases in interest rates the current rate and forecast have to be assessed to foresee further increases in the interest rate.
- Current
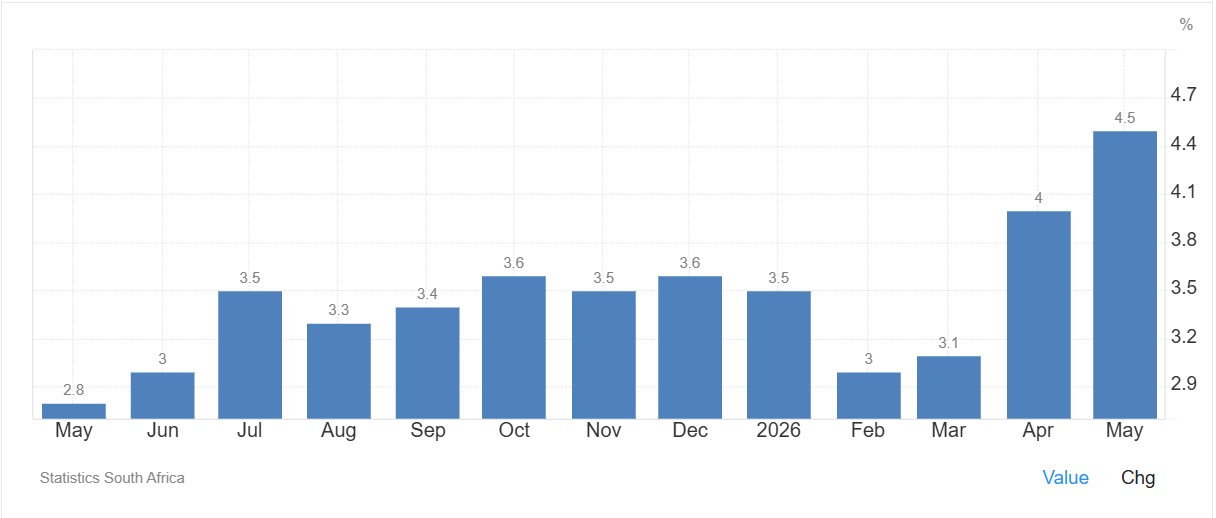
South Africa’s annual inflation rate rose for the third month to 4,5% in May 2026, marking the steepest since July 2024, though below the expected 4,7%. Inflation was mainly driven by transportation (9,4% vs 4,9% in April) and housing & utilities (5,3% vs 5,2%), reflecting pass-through from higher fuel costs due to the Middle East conflict and Eskom’s recent electricity tariff hike. Additional upward pressure came from insurance and financial services (5,7% vs 5,7%) and restaurants & hotels (5,8% vs 5,2%).
Meanwhile, food inflation continued to ease (1,9% vs 2,9%). The core inflation rate, which excludes prices of food, non-alcoholic beverages, fuel, and energy, rose to an over 1-1/2-year high of 3,8% in May, up from 3,6% in the previous month. Monthly, the CPI rose by 0,7% in May, down from a 1,1% increase in the prior month.
Source: Statistics South Africa
- Inflation rate per month
- Inflation rate forecast
Inflation rate in South Africa increased to 4,5% in May from 4% in April of 2026. It is expected to be 4,6% by the end of this quarter, according to Trading Economics global macro models and analysts’ expectations. In the long-term, the South Africa inflation rate is projected to trend around 3,7% in 2027 and 3% in 2028, according to our econometric models.
- Highlights in the agrochemical sector
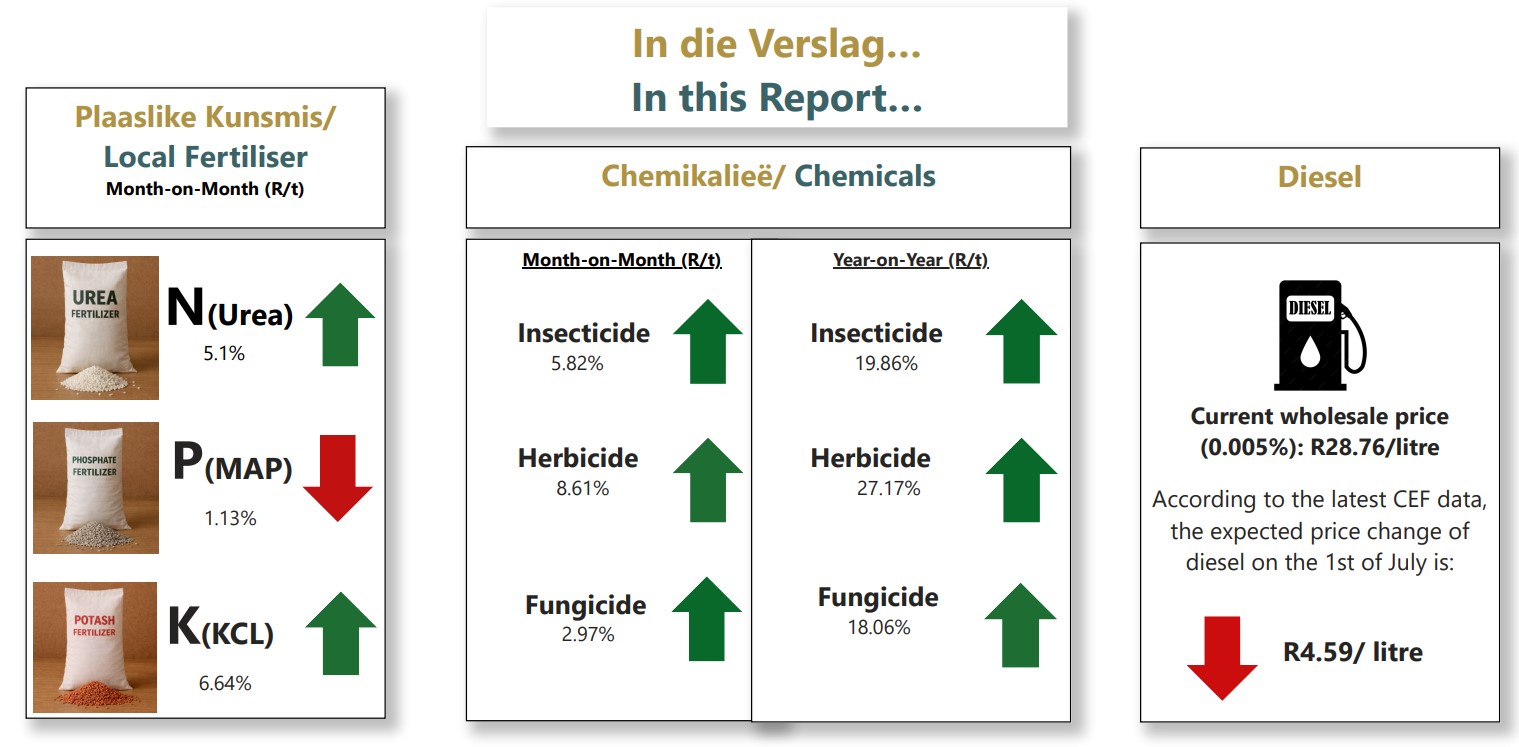
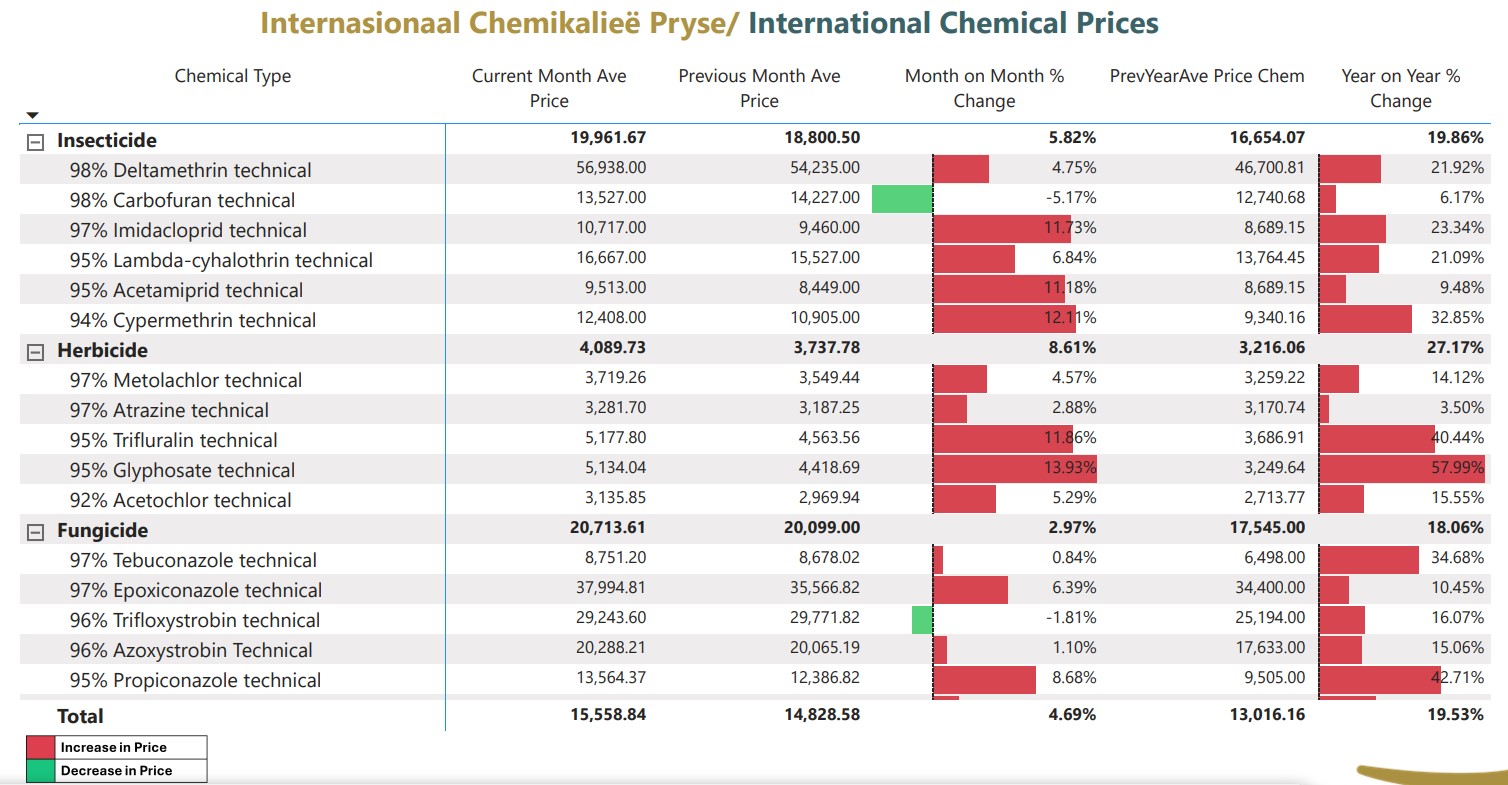
On average month-on-month period, insecticide prices increased by 5,82%, herbicide by 8,61% and fungicide by 2,97%.
On a year-on-year basis, chemical prices for insecticides increased by 19,86%, herbicides by 27,17% and fungicides by 18,06%.
- Fuel costs
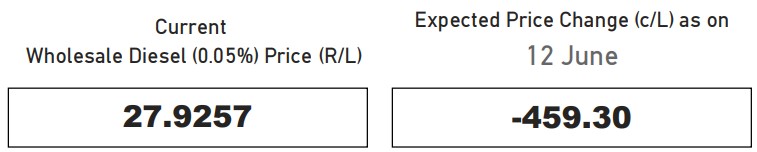
The wholesale diesel (0,05%) price is currently R27,93 per litre and R28,76 per litre (diesel 0,005%), with an expected decrease of approximately R4,59 per litre for diesel 0,005% and R4,28 per litre for diesel 0,05% from 1 July 2026.
Diesel prices have decreased from May to June. At the same time, the rand has remained relatively strong against the US dollar, trading at R16,17/$ on 15 June 2026.
Following the peace talks between the US and Iran, Brent crude oil prices were trading at $82,83/barrel, leading to the opening of the Strait of Hormuz
Sources: https://www.grainsa.co.za/upload/report_files/Input-Monitoring-Report_15-June-2026.pdf
Future prices
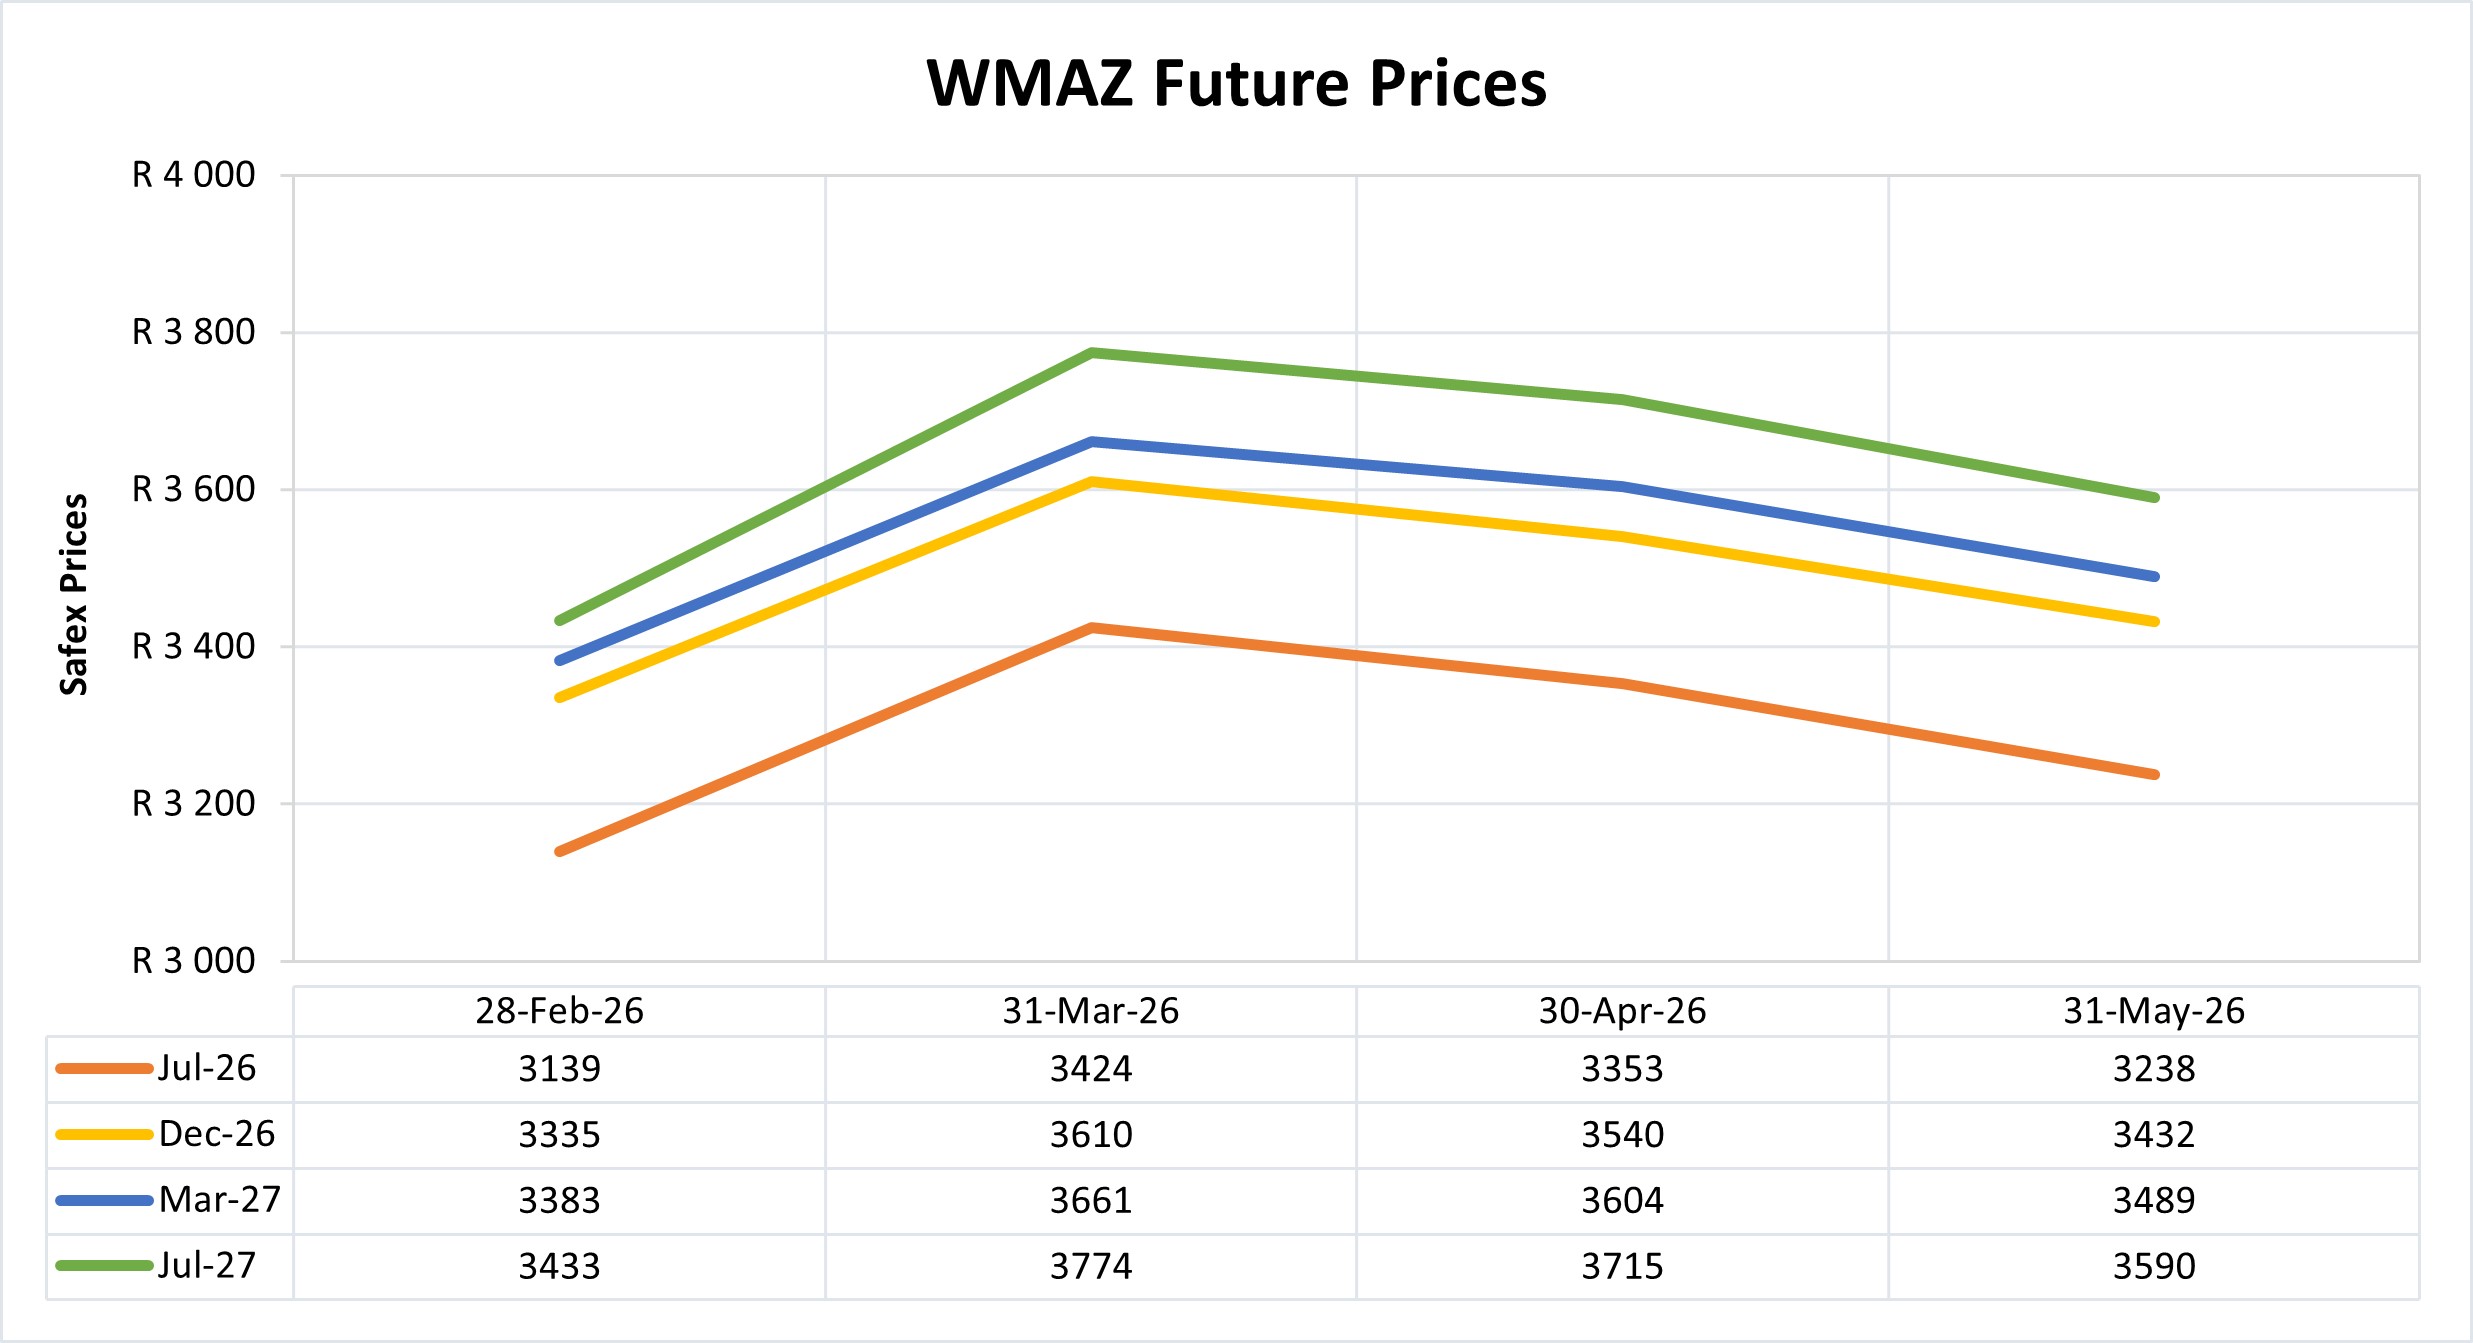
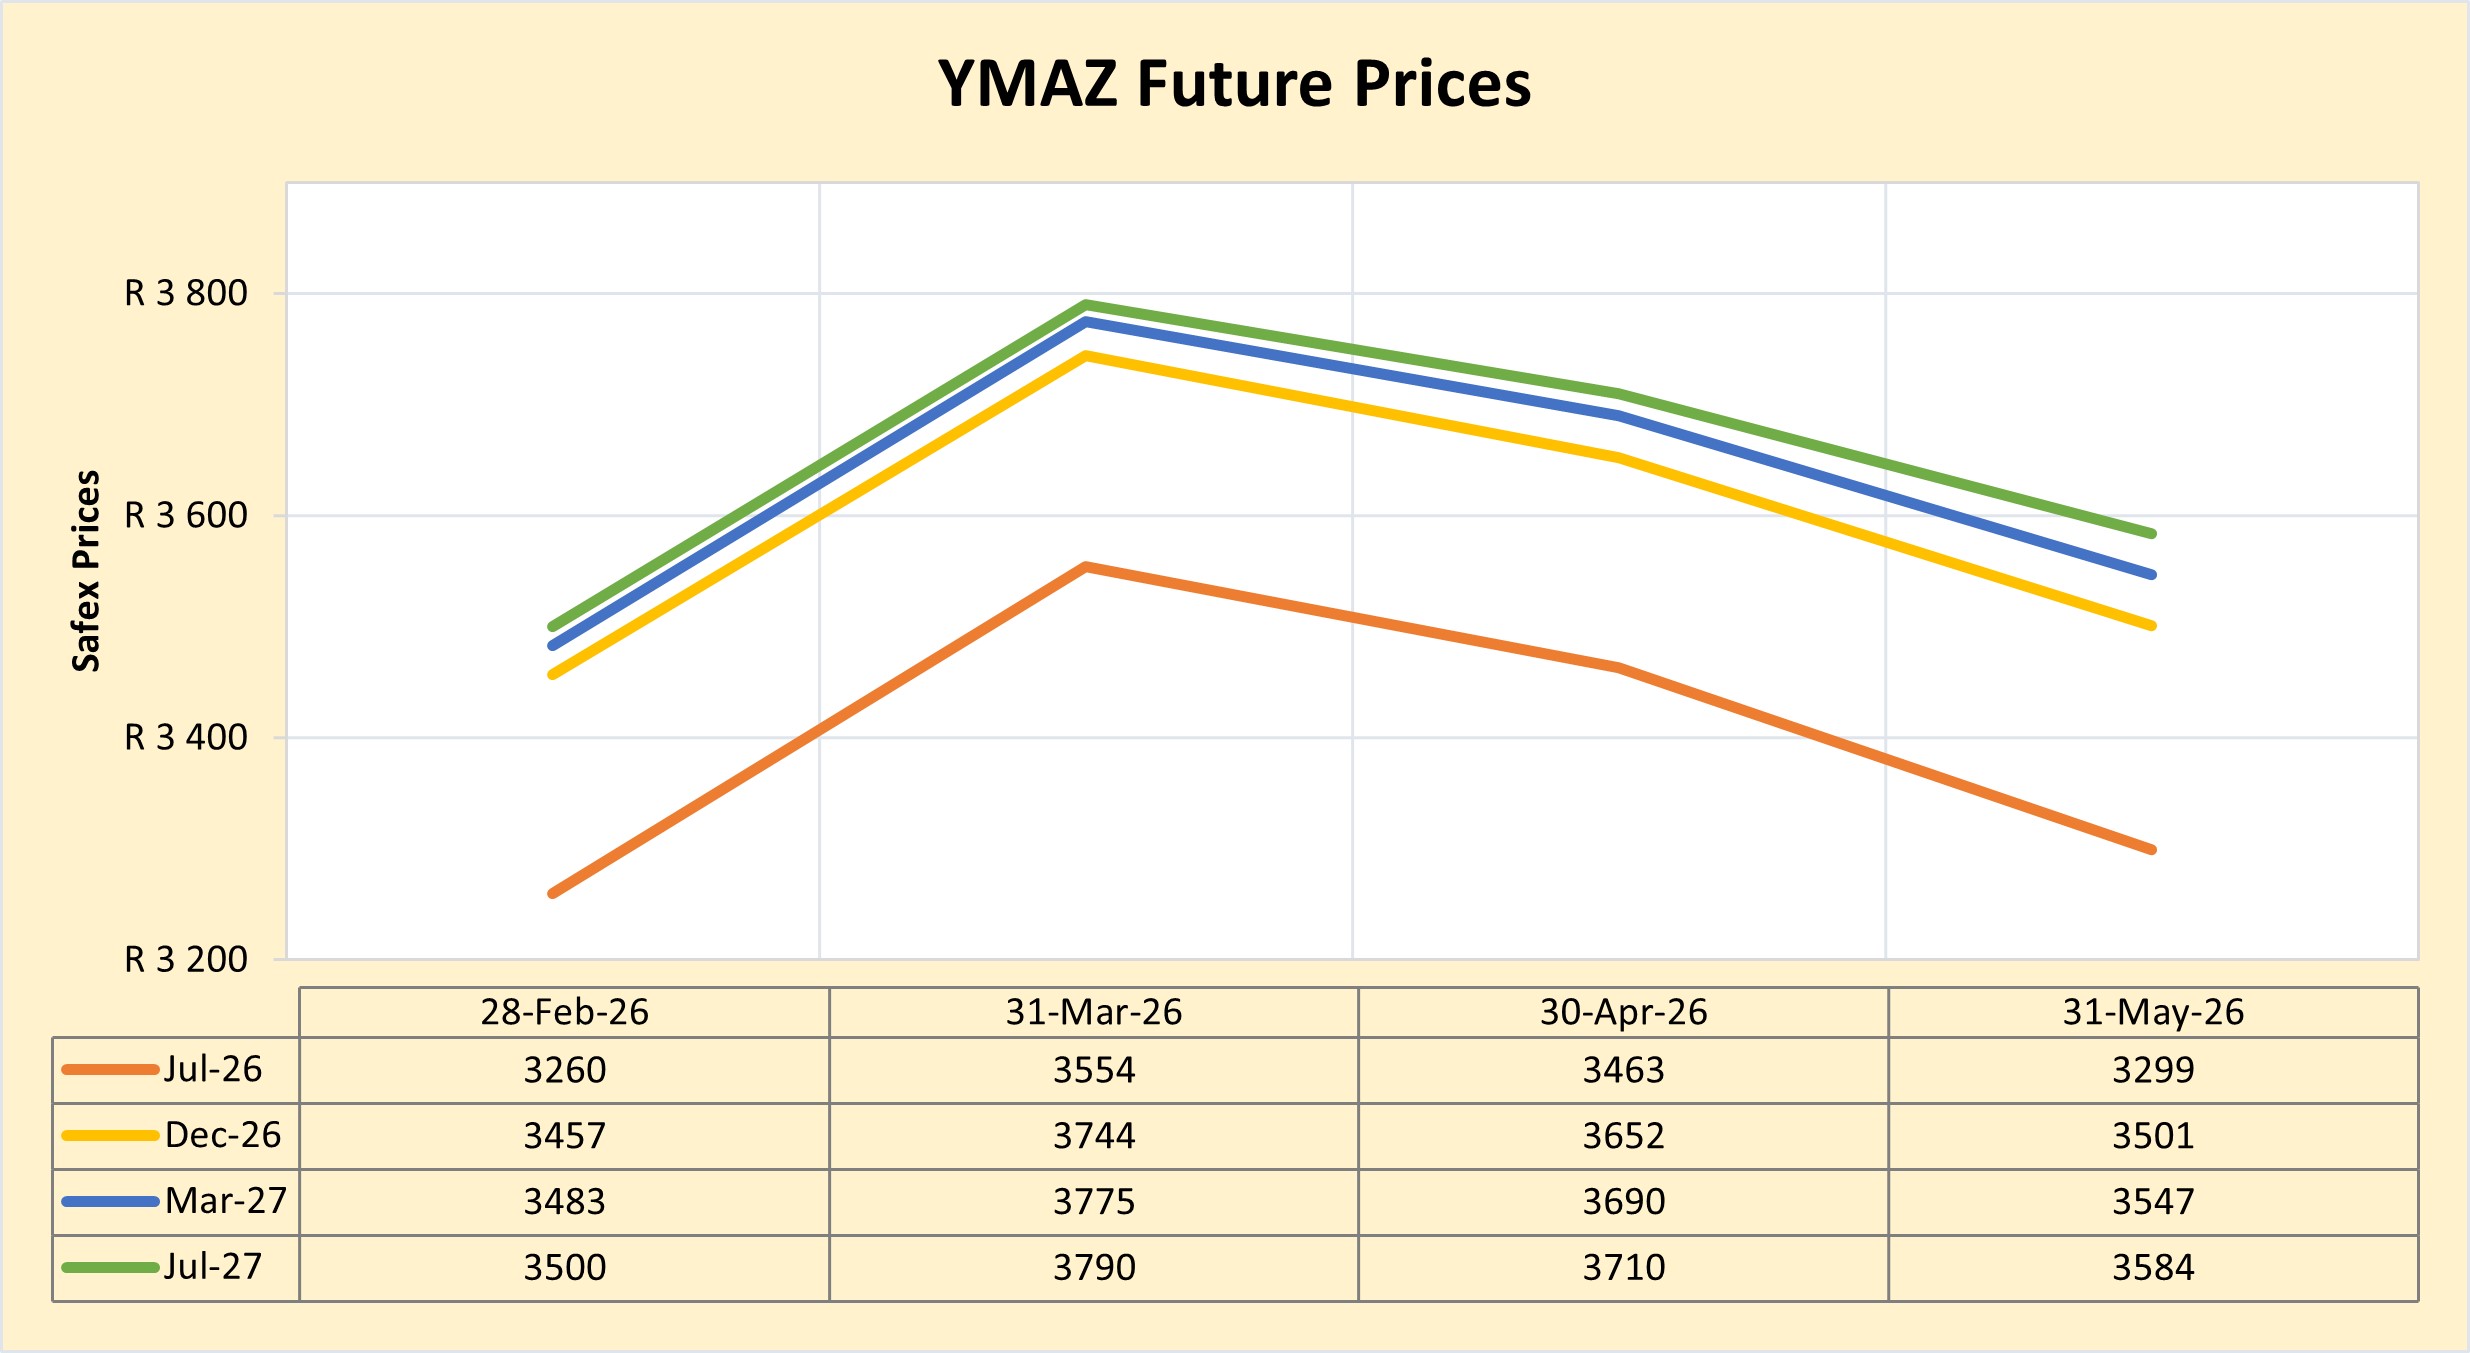
The graphs below illustrate the market sentiment for maize, in the form of future contracts, for the upcoming contract months. The market sentiment is the expectation of supply and demand fundamentals relating to white and yellow maize in South Africa.
- Domestic market overview
Even though prices showed a downward trend towards May 2026, maize prices are expected to increase towards the end of 2026 and 2027. This is mainly due to the strong El Niño that is expected, which will lower crop yields.
Fraud risk
FRAUD AWARENESS
Asset misappropriation
Definition: The theft or misuse of an organisation’s resources by employees, directors, or third parties for personal gain.
Asset misappropriation accounts for the majority of occupational fraud – appearing in roughly 90% of internal‑fraud investigations. The wrongdoing can be as trivial as padding an expense report or as sophisticated as a coordinated, multi‑person scheme.
The main categories of asset misappropriation are:
- Cash theft and skimming: Direct removal of cash or negotiable instruments from the company’s flow of funds.
- Skimming – diverting cash before it is entered into the accounting system (e.g., pocketing unrecorded sales or client payments).
- Larceny – stealing cash or checks after they have been recorded (e.g., taking money from a register or tampering with bank deposits).
- Fraudulent disbursements: Manipulating payment processes to divert money to the fraudster.
- Fake‑vendor billing – creating shell companies and submitting fictitious invoices.
- Payroll fraud – adding “ghost” employees or inflating hours/pay rates.
- Expense‑reimbursement abuse – claiming personal costs or overstating legitimate travel/meal expenses.
- Inventory & asset misuse: Misappropriation of tangible or intangible assets that are not cash‑based.
- Theft of merchandise, equipment, or supplies.
- Unauthorised use of company technology, data, or intellectual property for outside ventures.
Warning signs
- Missing or altered documentation – absent receipts, unexplained gaps in ledgers, or inventory shortages.
- Unusual lifestyle changes – employees whose spending far exceeds known income, or who avoid taking vacation (which could expose their activity).
- Reconciliation gaps – recurring mismatches among bank statements, accounts payable, and accounts receivable.
- Vendor irregularities – vendors sharing an employee’s address, lacking tax identification numbers, or submitting invoices that sit just below the approval threshold.
Controls to prevent and mitigate misappropriation
- Segregation of duties – Separate the responsibilities for receiving funds, recording transactions, and reconciling accounts so no single individual controls the entire cycle.
- Independent audits – Conduct periodic reviews of financial processes, physical inventories, and vendor master files by auditors who are not involved in day‑to‑day operations.
- Access restrictions – Limit user rights to accounting systems, databases, and physical assets; require multiple approval levels for disbursements.
- Whistle‑blower mechanisms – Offer anonymous reporting channels that encourage employees to flag suspicious behaviour without fear of retaliation.
- Rigorous vetting – Perform thorough background and reference checks on new hires, especially those placed in finance, procurement, or inventory‑management roles.
By embedding these safeguards into everyday operations, organizations can significantly reduce the risk of asset misappropriation and protect both their financial health and reputation.
Source: https://www.reportfraud.police.uk/asset-misappropriation-fraud/
https://www.scribd.com/document/455540292/Asset-Misappropriation-Research-Paper
https://www.acca-aust.com.au/asset-misappropriation/