
External factors
The main focus of this document is to have a closer look at external factors which can affect any business and our customers.
1. GRAIN ENDING STOCK MARKET
The National Agricultural Marketing Council (NAMC) predicts 30 April 2022 ending stock for white and yellow maize to exceed that of the 2020/2021 season. Their forecast for white maize for the season is that of an excellent harvest.
The estimated maize crop is 6% bigger than the 2020 crop. The three main maize producing areas, namely the Free State, Mpumalanga and North West are expected to produce 84% of the 2021 crop.
The repo rate has been cut by 300 basis points this year to help mitigate the economic fallout of the Covid-19 pandemic. The repo rate is currently 3.5% and the prime lending rate 7%.
2. MARKET RISK
2.1 Grain market analysis
- Ending stock – national
Ending stock data is gathered from the NAMC. The estimates are reassessed and reported by the Grain & Oilseeds Supply & Demand Estimates Committee. The following is a summary of the September 2021 ending stock estimates for the 2020/2021 season:
- Wheat = 468 208 tons
The following is a summary of the February 2022 ending stock estimates for the 2021/22 season:
- Sunflower = 48 304 tons
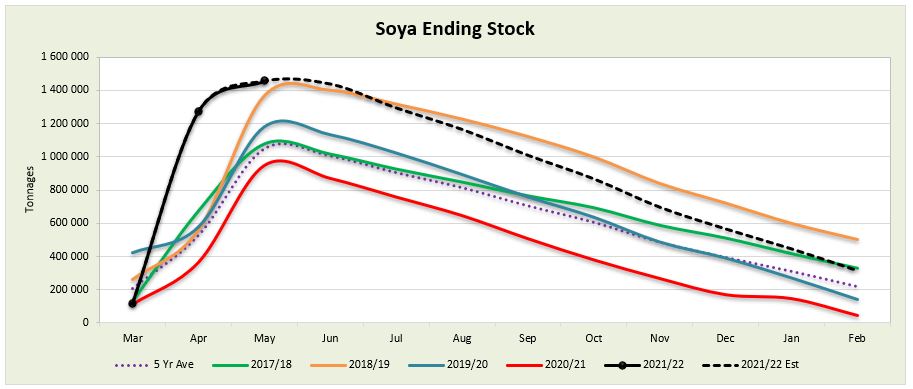
- Soybeans = 315 603 tons
- Sorghum = 71 920 tons
The following is a summary of the April 2022 ending stock estimates for the 2021/2022 season in tonnages:
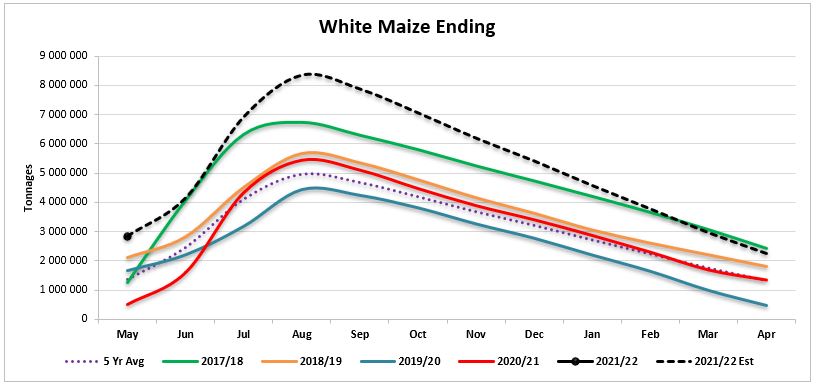
- White maize = 2 240 732 tons
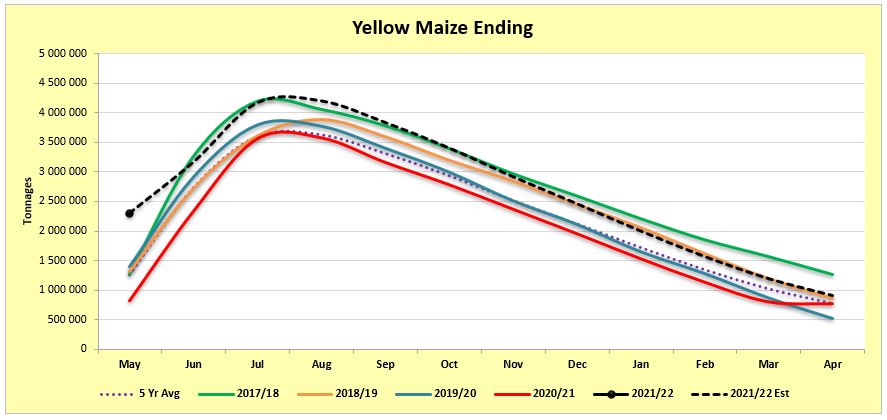
- Yellow maize = 897 482 tons
Graph 1 shows white maize ending stock for April 2022 that are 885 779 tons or 65% more than the 2020/2021 season. Yellow maize (Graph 2) shows a 143 691 tons or 19% increase in ending stock estimation for the 2021/2022 season, over the previous season.
Source: Sagis
Source: Sagis
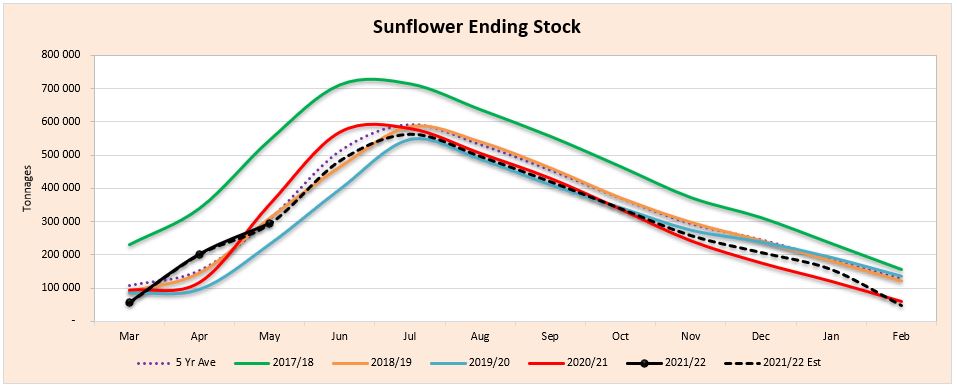
The actual soya ending stock (Graph 3) for February 2022 is 269 550 tons more than February 2021. The actual sunflower ending stock (Graph 4) is 21% (12 660 tons) less than the previous seasons ending stock.
Source: Sagis
Source: Sagis
- Crop estimates
According to the Crop Estimates Committee (CEC) the size of the expected commercial maize crop has been set at 16,233 million tons, which is 0,32% or 52 275 tons more than the previous forecast of 16,180 million tons. The area estimate for maize is 2,755 million hectares, while the expected yield is 5,89 t/ha. The estimated maize crop is 6% bigger than the 2020 crop. The three main maize producing areas, namely the Free State, Mpumalanga and the North West are expected to produce 84% of the 2021 crop.
The area estimate for white maize is 1,692 million hectares (Graph 5) and for yellow maize the area estimate is 1,064 million hectares (Graph 6). The production forecast of white maize is 8,937 million tons, which is 0,51% or 45 375 tons less than the 8,982 million tons of the previous forecast. The yield for white maize is 5,28 t/ha. In the case of yellow maize the production forecast is 7,296 million tons, which is 1,36% or 97 650 tons more than the 7,198 million tons of the previous forecast. The yield for yellow maize is 6,86 t/ha.
Source: CEC
Source: CEC (Crop Estimates Committee)
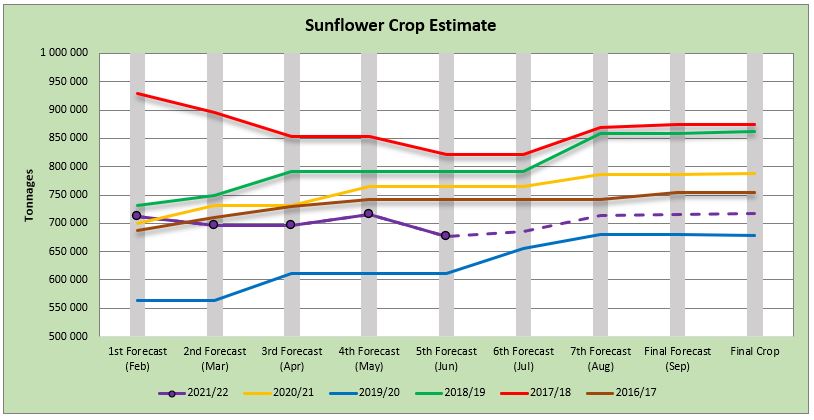
The production forecast for sunflower seed is 677 240 tons, which is 5,45% or 39 000 tons less than the 716 240 tons of the previous forecast. The area estimate for sunflower seed is 477 800 ha (Graph 7) while the expected yield is 1,42 t/ha.
Source: CEC (Crop Estimates Committee)
The production forecast for soybeans remained unchanged at 1,918 million tons. The estimated area soybeans planted is 827 100 hectares (Graph 8) and the expected yield is 2,32 t/ha.
Source: CEC (Crop Estimates Committee)
- Imports and exports – national
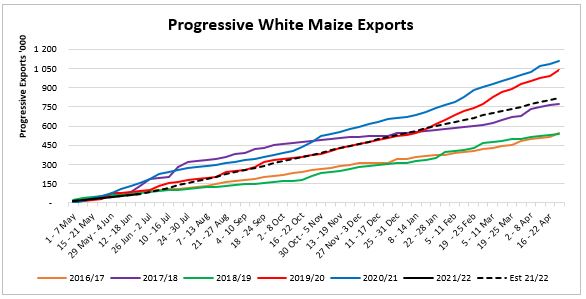
To date, 69 041 tons of white maize and 535 982 tons of yellow maize have been exported since the beginning of May 2021 (Graph 9).
Source: Sagis
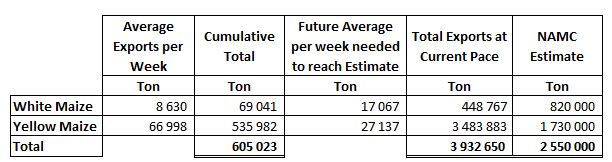
As seen in Table 1, the average white maize exports per week are currently 8 630 tons. If theoretically, white maize exports remain at the current average of 8 630 tons per week then there would be 371 234 tons less white maize exports than anticipated.
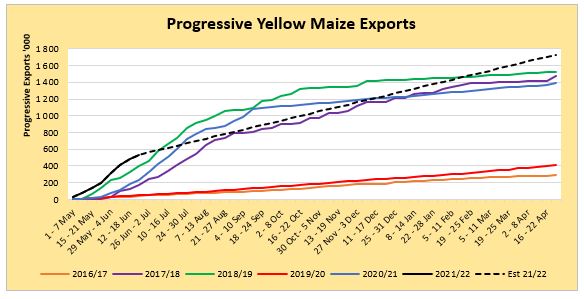
The average yellow maize exports per week are currently 66 998 tons. If theoretically, yellow maize exports remain at the current average of 66 998 tons per week then there would be 1 753 883 tons more yellow maize exports than anticipated (Graph 10).
Source: Sagis
- Parity prices
South Africa is a small producer compared to other countries and is thus a price taker (meaning that we cannot influence world prices). Because of this, our local prices are normally between import and export parity, which is illustrated in Graphs 11 and 12. An import parity price is defined as the price that a buyer will pay to buy the product on the world market. This price will include all the costs incurred to get the product delivered at the buyer’s destination.
An export parity price is defined as the price that a local seller could receive by selling his product on the world market for example excluding the export costs. The price which the seller obtains is based on the condition in which he delivers the product at the nearest export point (usually a harbour) at his own expense.
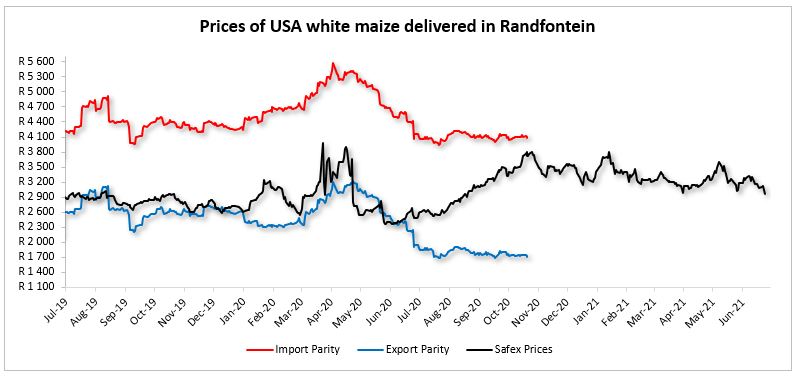
Source: Grain SA (No further import and export parity data available for white maize.)
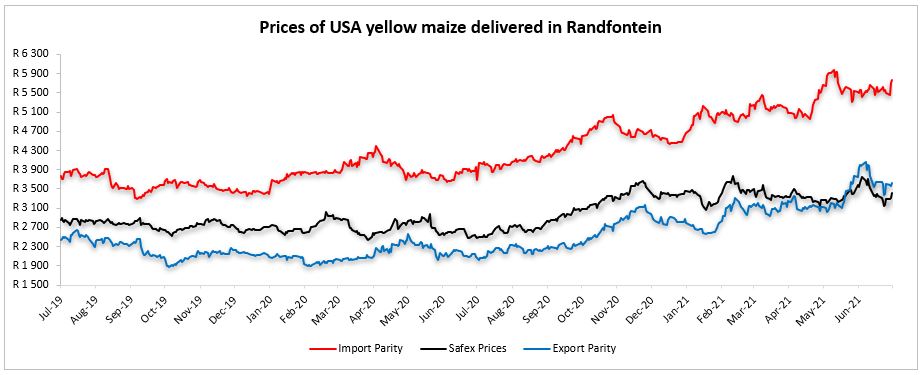
Source: Grain SA
- Producer deliveries – provincial
For the marketing year, which is May to April, the Free State dominates the white maize that is used for human consumption and gristing. North West showed a significant increase for the 2020/2021 season with a 1% rise over the previous season (Graph 13).
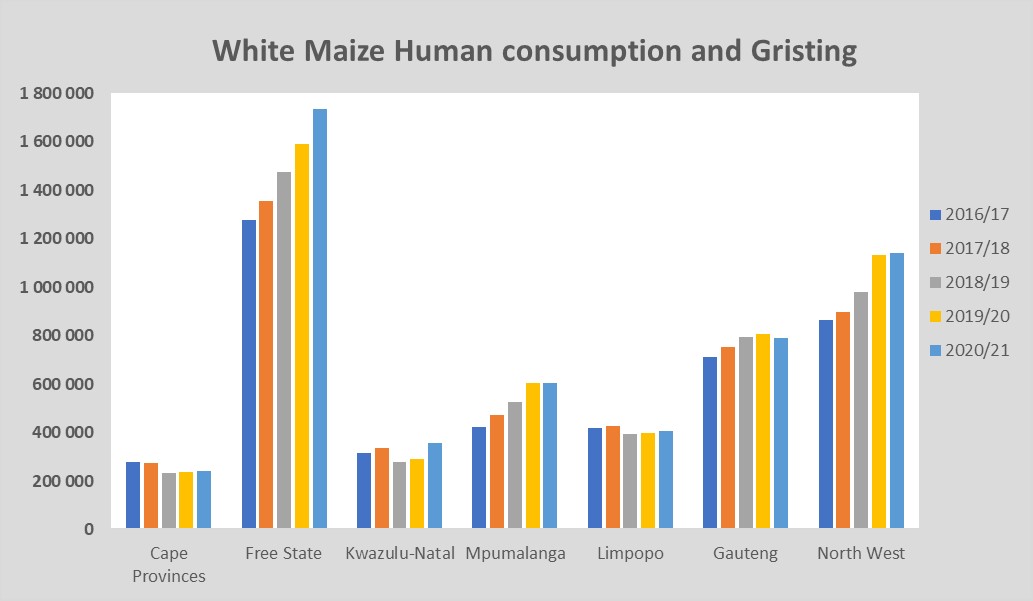
Source: Sagis
North West have a decreasing trend in yellow maize which is used for consumption and gristing. Only 18 563 tons of yellow maize was used in the 2020/2021 season that ended April 2021 (Graph 14).
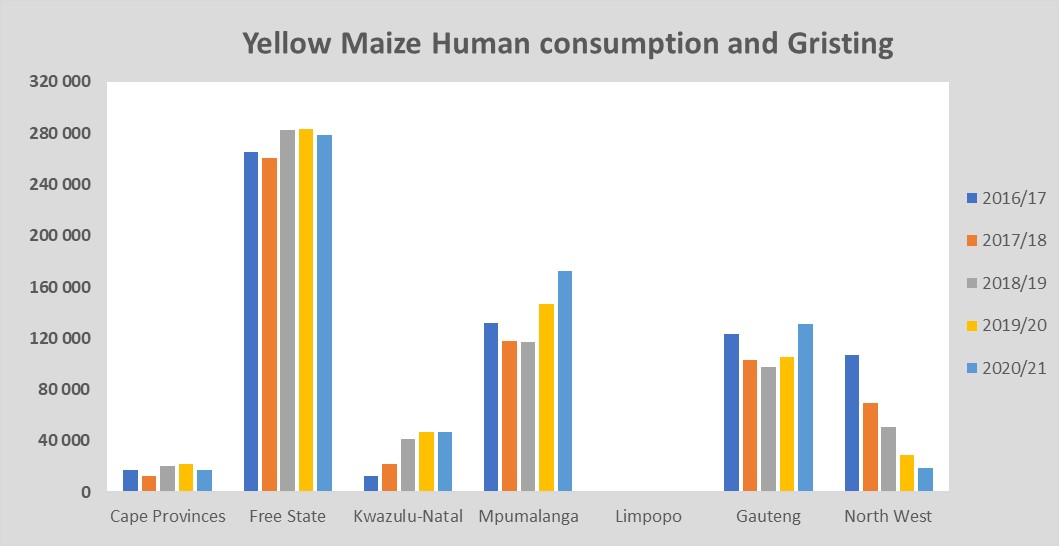
Source: Sagis
- Exchange rate
NWK group is exposed to foreign exchange rate risk on various business areas, such as commodity prices and trade imports.
Source: Standard Bank, Corporate and Investment Banking & SARB
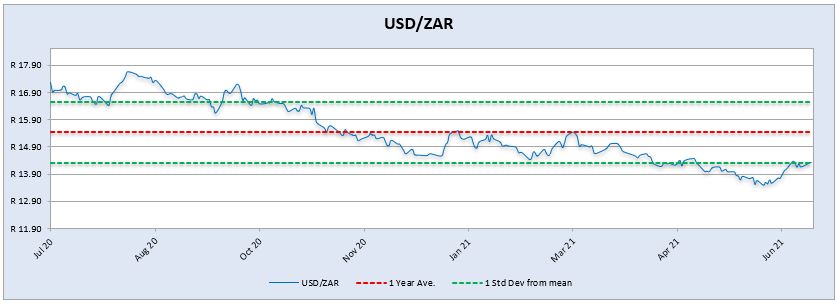
On a monthly average basis, ther appreciated against the US dollar with 1% (0,14c) over the period May 2021 to June 2021. The one-year average for rand/US dollar is R15,43. Moreover, the average rand/US dollar exchange rate for the period June 2021 was R13,92 compared to R14,06 of May 2021 (Graph 15).
According to Nedbank economists the key drivers for the rand that is at a 16-month high against the US dollar were strong global risk appetites, a weaker US dollar, robust commodity prices, better-than-expected domestic fiscal outcomes and encouraging signs that the ruling party started to take action against corruption within its ranks.
- Exchange rate forecast
Graph 16 shows the actual USD/ZAR for 2021 Quarter 1 (Q1) and 2021 Quarter 2 (Q2) against the forecasted figures. Trading Economics’s forecast for 2021 Q1 was the closest to actual and The Economy Forecast Agency’s forecast for 2021 Q2 was the closest to actual. According to Nedbank and Trading Economics the Rand will strenghten in the year 2021 but ABSA and The Economy Forecast Agency says the opposite.
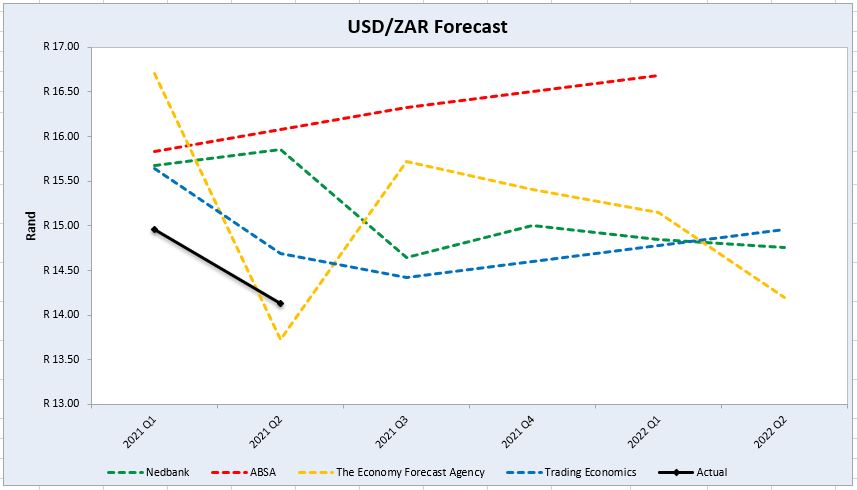
Source: Nedbank CIB; ABSA; The Economic Forecast Agency; Trading Economics
- Future prices
Graphs 17 and 18 illustrate the market sentiment for maize, in the form of future contracts, for the upcoming contract months. The market sentiment is the expectation of supply and demand fundamentals relating to white and yellow maize in South Africa.
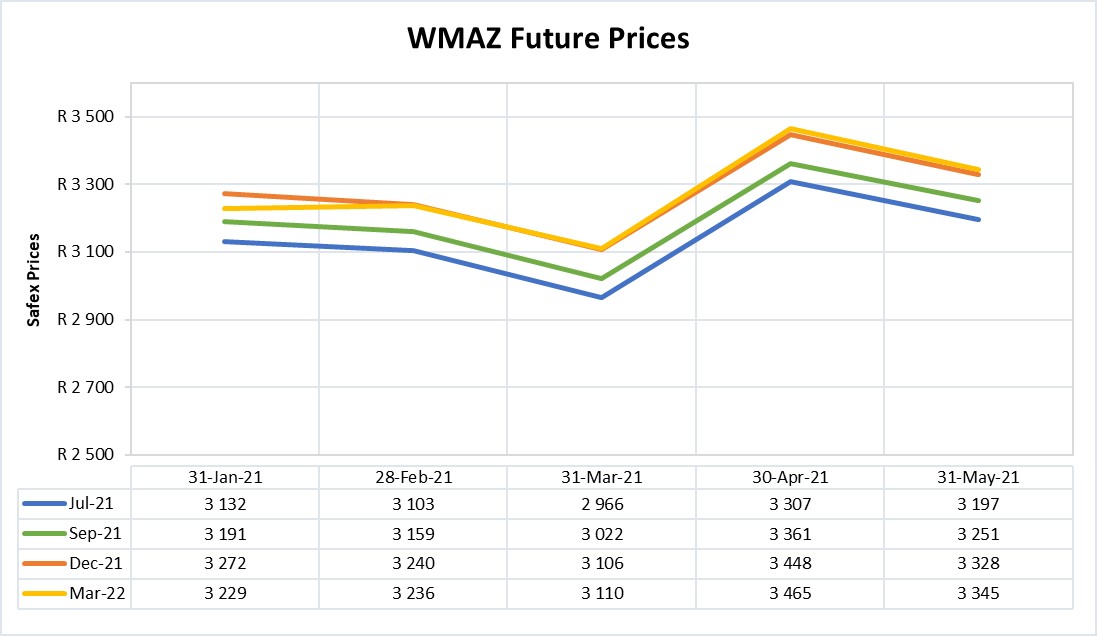
Source: Sagis
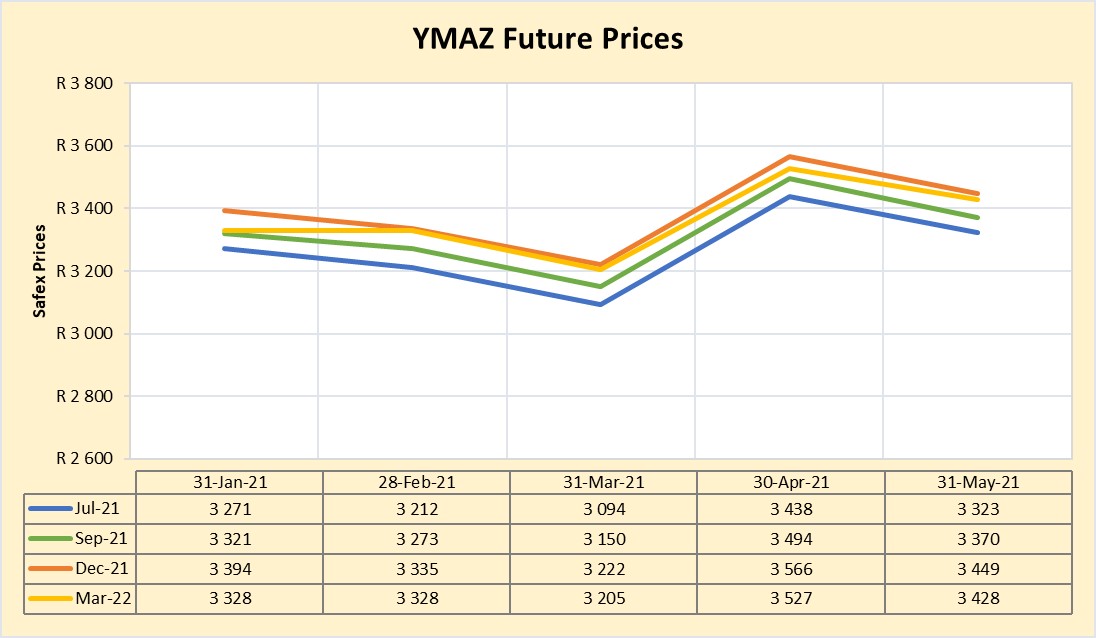
Source: Sagis
2.2 Weather and climate
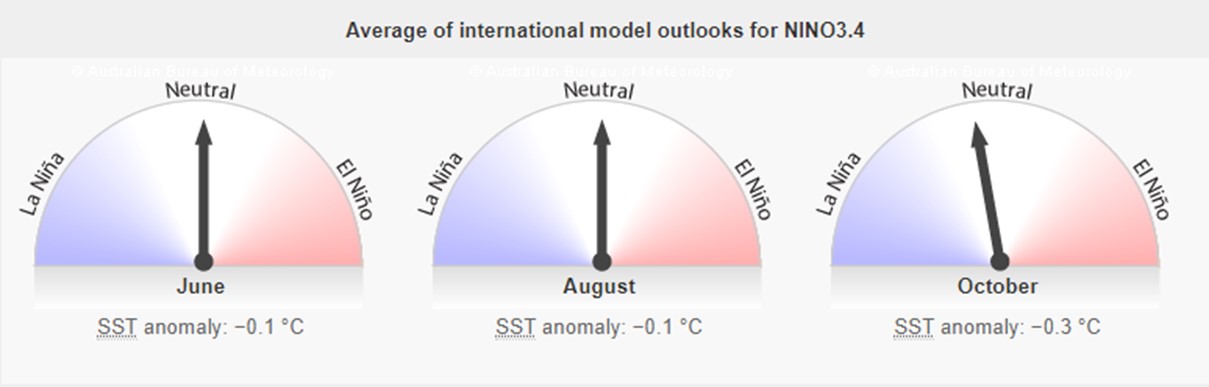
ENSO-neutral conditions continued during May, with near-average sea surface temperatures observed across most of the equatorial Pacific Ocean. Sea surface temperatures (SST) remained positive but decreased slightly due to the weakening of above-average subsurface temperatures.
La Niña chances increase to near 50% during the month of October 2021 until February 2022.
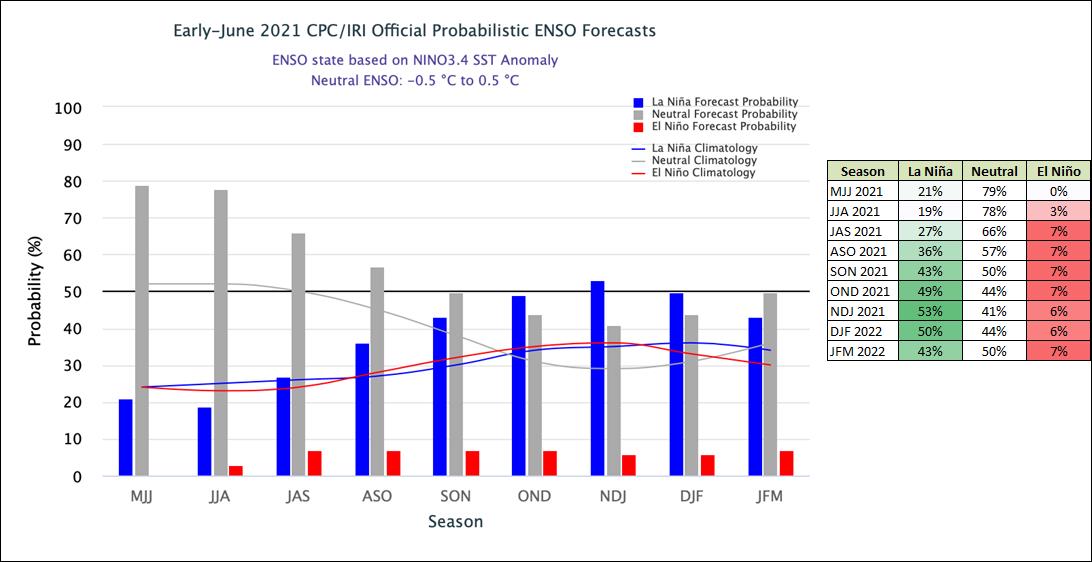
The El Niño-Southern Oscillation (ENSO) is neutral. The model outlooks for NINO 3.4 indicates that it will remain neutral until at least early spring.
2.3 Interest rate risk
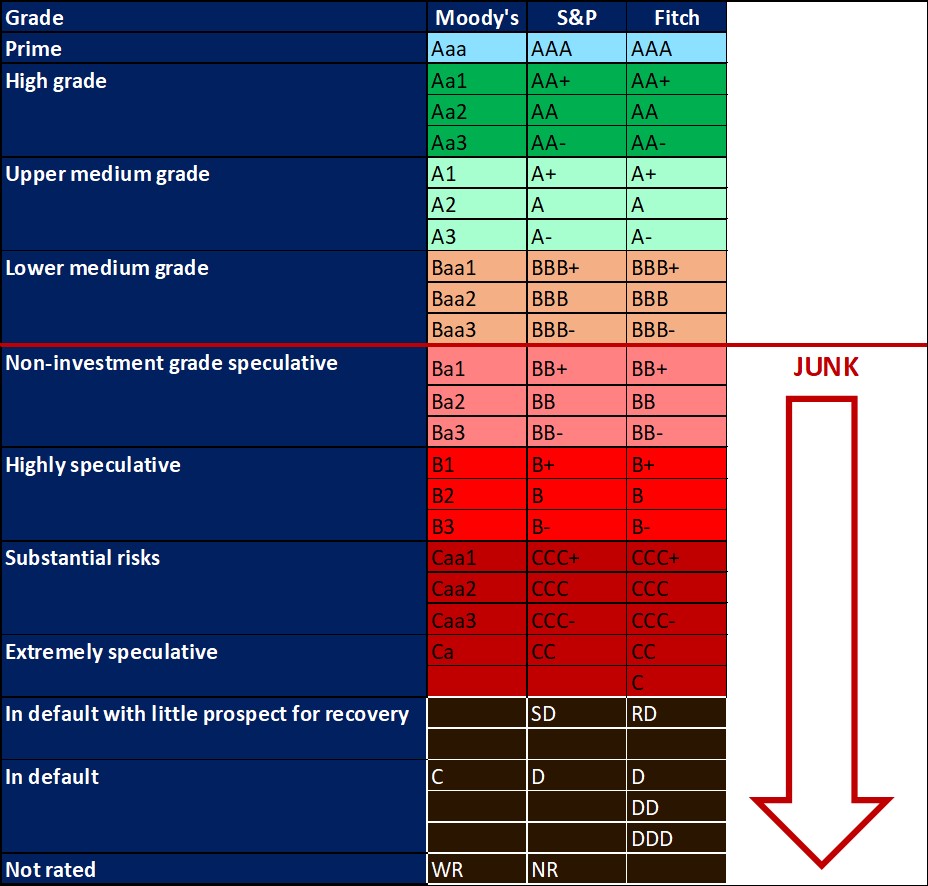
On 27 March 2020, Moody’s downgraded South Africa’s sovereign credit rating to sub-investment grade and placed a negative outlook on the rating. The key drivers for this downgrade include weak economic growth, continuing deterioration in fiscal strength, and slow progress on structural economic reforms. It is now the first time in post-apartheid South Africa where all major rating agencies, that is Moody’s, Fitch and S&P, have South Africa’s credit ratings in sub-investment grade territory.
The Covid-19 pandemic has forced the South African Reserve Bank to make a number of interest rate cuts to bring relief to the economy. Interest rate movement:
- 20 March 2020 – 8,75%
- 15 April 2020 – 7,75%
- 22 May 2020 – 7,25%
- 23 July 2020 – 7,00%
Since the Monetary Policy Committee (MPC) meeting in July 2020, the interest rate has remained unchanged.
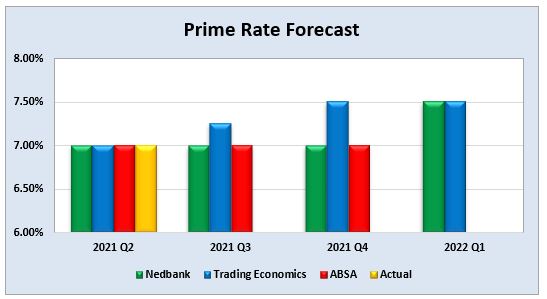
Graph 19 shows the prime rate forecast for 2021 Quarter 2 to 2022 Quarter 1. Trading Economics’ forecast that the prime interest rate will increase with 25 basis points for 2021 Q3 and again for 2021 Q4. The next MPC meeting date is 22 July 2021.
3. FRAUD RISK
3.1 Fraud awareness
SymQuest believes that business data is more vulnerable than ever before. Cybersecurity is necessary for any business to efficiently operate. It is also critical for protecting your customers’ information.
Following IT best practices goes beyond using the latest technology; it is about staying ahead of risks and disasters. When creating cybersecurity procedures, SymQuest suggests using a layered security model. This model begins with the internet and ends with the company employees. The fourth point in this layered security model that will be referred to is Anti-Virus/Malware Updates. In the coming reports, additional points of the model will be included.

With cybersecurity becoming such an important component of almost any business, the Committee of Sponsoring Organizations of the Treadway Commission (COSO) plans to issue detailed recommendations on how organisations can better manage risks related to cloud computing, artificial intelligence and outside contractors, among other topics in the year ahead.
The final version of the Cybercrime Bill is also completed and ready to become law. The law will effectively deal with cybercrimes.
3.2 Fraud tip
The fraud prevention tip for this month is: Make employees aware – set up a reporting system.
Awareness is applicable to all employees. Those who are planning to commit fraud will hopefully be deterred by the idea that management is watching. Honest employees will also be made aware of possible signs of fraud or theft. These employees are assets in the fight against fraud. According to the Association of Certified Fraud Examiners (ACFE) 2014 report, most occupational fraud (over 40%) is detected because of a tip. While most tips come from within the organisation, other important sources of tips are vendors, customers, competitors and acquaintances of the fraudster.


