
The NWK Limited external factors report provides an overview of the main external factors that NWK and its clients are exposed to at a specific point in time. This report opts to aid in a timely basis to foresee external market and other factors that may have an impact on any business and clients. The main focus of this document is to have a closer look at external factors that can affect any business and our customers.
Executive summary
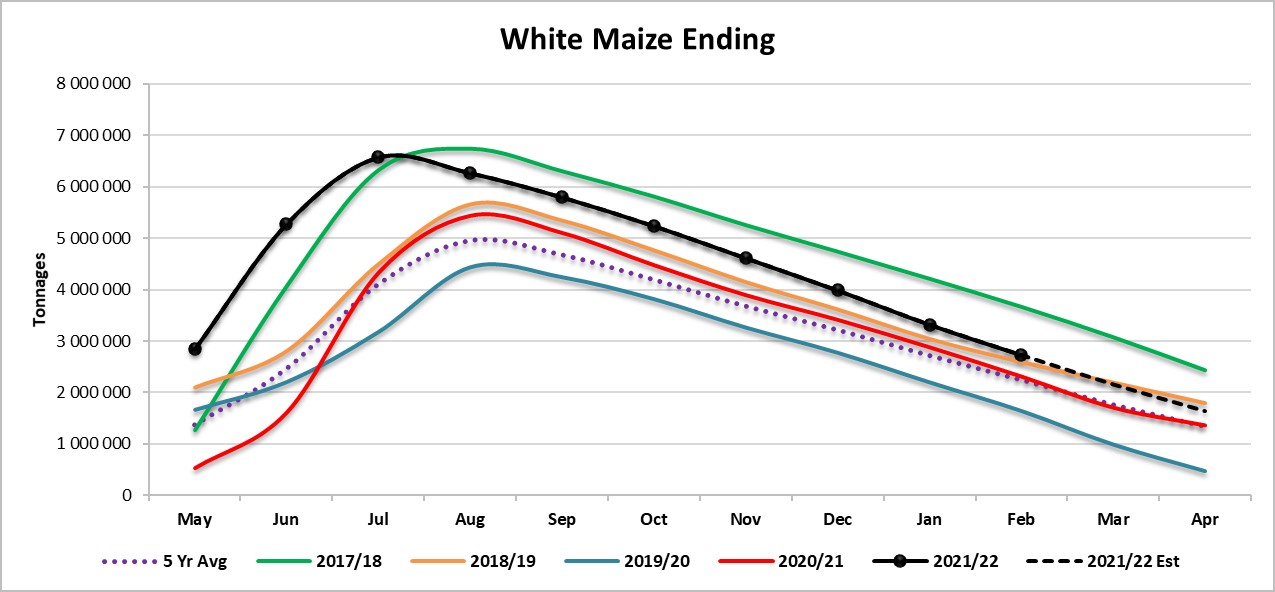
The Agribusiness Confidence Index for March (Q1), compiled by the Agricultural Business Chamber (Agbiz), presents a picture of a sector that is still on solid footing. The National Agricultural Marketing Council (NAMC) predicts 30 April 2022 ending stock for white and yellow maize to exceed that of the 2020/2021 season. Their forecast for white maize for the season is that of an excellent harvest. The estimated maize crop is 10% less than the 2021/2022 crop. According to the second maize forecast the three main maize producing areas – the Free State, Mpumalanga and North West – are expected to produce 82% of the 2021/2022 crop.
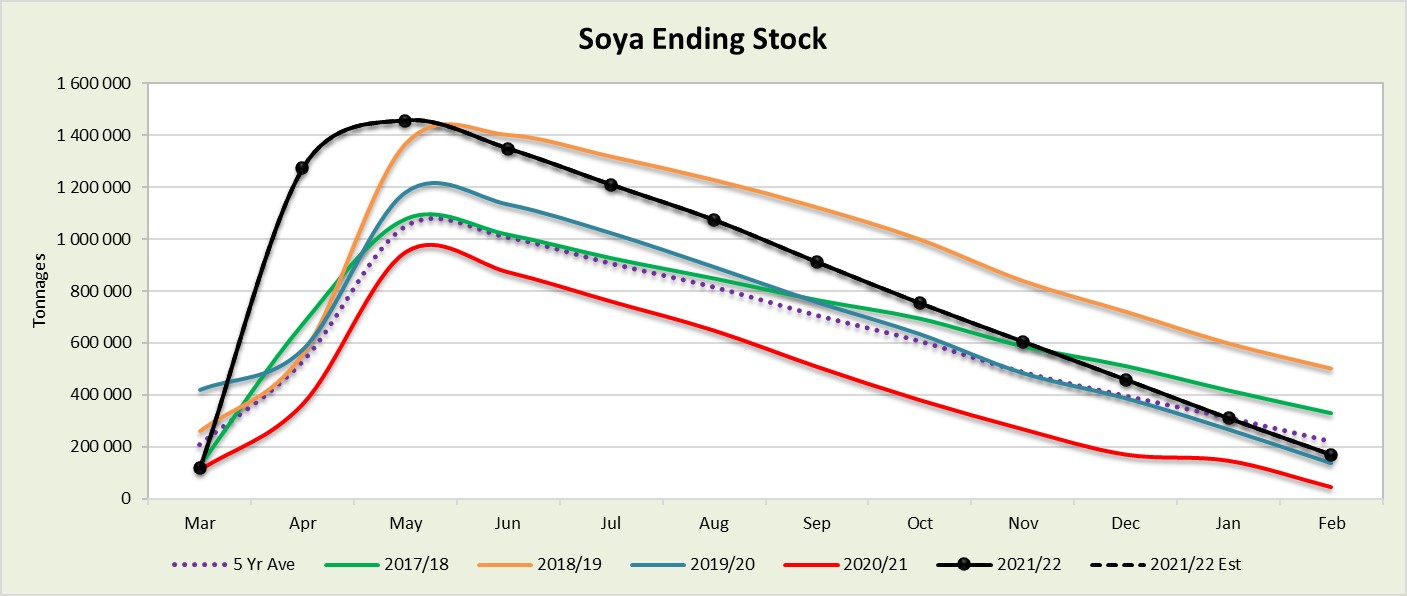
The final soya ending stock for February 2022 is 123 657 tons more than February 2021, an astronomical increase of 269%. A record average of 2,32 t/ha soybeans was harvested in 2021.
The repo rate has been cut by 300 basis points to help mitigate the economic fallout of the COVID-19 pandemic until November 2021. During March 2022 the Monetary Policy Committee (MPC) of the South African Reserve Bank (SARB) increased the repo rate with another 25 basis points, thus the repo rate is currently 4,25% and the prime rate is 7,75%.
In the first quarter of 2022, the fading impact of the ‘Double Control Policy’ will support China’s agrochemical operation rate from March 2022. However, hopes of fertiliser prices stabilising is crushed due to the Russia-Ukraine war.
GDP growth is expected to average at 1,8% over the next three years and Macro-economic outlook projects a real GDP growth of 2,1% in 2022.
The Russia-Ukraine conflict has a big impact on the global economy as these two countries are rich in minerals and key role-players in the export of oil, natural gasses, sunflower oil, palladium and fertiliser materials amongst others. With exports influenced the increasing demand for these resources cause prices to rise. The spill over effect of rising brent crude oil prices is higher fuel prices which result in higher food prices and in turn causes inflation to rise. When inflation goes up interest rates also tend to go up in an effort to get inflation under control.
Agbiz/IDC ACI moderates in Q1, 2022
Agbiz quarterly conducts a survey in order to create an Agribusiness Confidence Index (ACI). The Agbiz/IDC Agribusiness Confidence Index, which was released on the 15th of March 2022, reflects the perceptions of at least 25 agribusiness decision-makers on the ten most important aspects influencing a business in the agricultural sector.
These ten aspects are:
- turnover;
- net operating income;
- market share;
- employment;
- capital investment;
- export volumes;
- economic growth;
- general agricultural conditions;
- debtor provision for bad debt; and
- financing cost.
These aspects are used by agribusiness executives, policymakers and economists to understand the perceptions of the agribusiness sector. It also serves as a leading indicator of the value of the agricultural output while providing a basis for agribusinesses to support their business decisions. Graph 1 shows the Agribusiness Index from 2002.
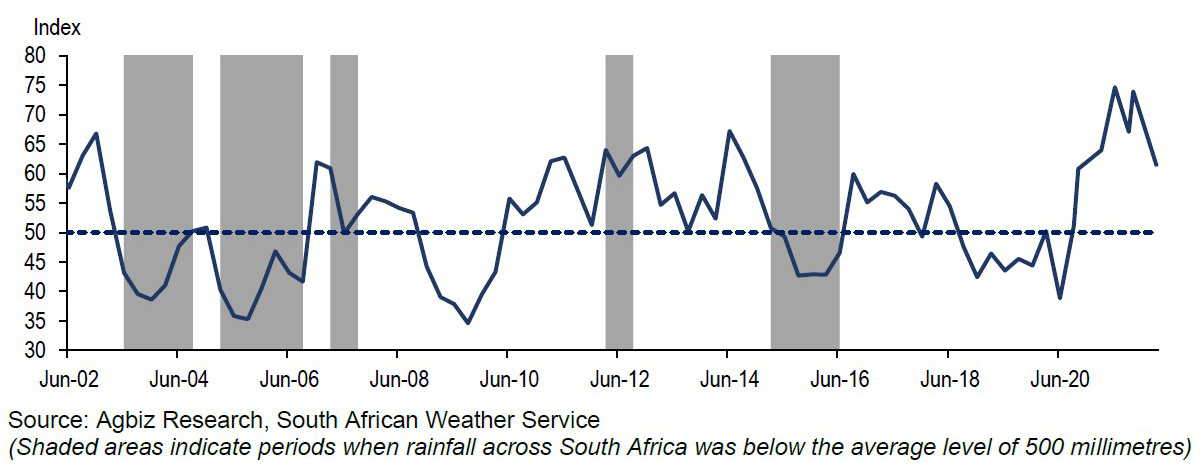
The ACI is comprised of ten subindices, of which eight declined in the first quarter of this year. The turnover and the net operating income subindices declined by 7 and 6 points to 86 and 79 in Q1 2022, respectively. This was mainly due to the expected lower summer crop harvest, which negatively affected the agribusinesses operating in field crops, livestock and agricultural machinery industry.
The market share of the agribusiness’s subindex fell by one point from the last quarter of 2021 to 76. The agribusinesses with summer and winter crops were among the first respondents who signalled weaker expectations. However, most of the respondents maintained a broadly unchanged view from the last quarter of 2021.
The employment subindex confidence fell by 2 points from the last quarter of 2021 to 60 in Q1 2022. This mirrors the expected decline in summer crop harvest, and to an extent, some horticulture products. This, after the early summer season excessive rains caused crop damages. With that said, this change in sentiment should not necessarily be viewed as a decline in agricultural employment since a level of about 50 still signals expansionary conditions for agricultural sector jobs. It is expected that South Africa’s primary agricultural jobs will most likely remain at levels over 800 000, above the long-term average.
Confidence in the capital investments subindex fell by 13 points from the last quarter to 67 in Q1 2022. The rising farm input costs and general uncertainty about potential economic spill overs from the Russia-Ukraine war could possibly limit the farmers and agribusiness’s flexibility to invest in new machinery or new business ventures.
The subindex measuring the volume of exports sentiment declined by one point from the previous quarter to 78 in Q1 2022. This is reflected in the potential decline in summer crop harvest, some horticulture produce, and the volume of exports after that. That said, a level of 78 still indicates robust export conditions.
Confidence in the general economic conditions fell by 25 points to 48. This reflects the uncertainty in the current geopolitical environment, a general slowdown in the global economy, and more domestic events such as load-shedding, amongst other factors.
The general agricultural conditions subindex saw a sharp quarterly decline of 28 points to 60 in Q1 2022. The excessive rains since the start of the summer crop season, damages on crops in some regions, and animal disease in livestock are all reflected in the respondents’ downbeat mood about the agricultural production conditions. This, however, is still well above the 50-neutral mark, which indicates that although production conditions are down from the previous season, they are not dire and remain at above-average levels.
The debtor provision for bad debt and financing costs subindices are interpreted differently from the abovementioned indices. A decline is viewed as a favourable development, while an uptick is not a desirable outcome as it indicates that agribusinesses are financially constrained. In Q1 2022, the indices for debtor provisions for bad debt and financing costs fell to 45 and 18 by 9 and 28 points, respectively. This is very favourable and reflects the tail end of the farmers’ financial gains of the previous two robust seasons, which enabled them to service their debts.
In conclusion, Wandile Sihlobo, chief economist at Agbiz, said that the first quarter results present a picture of a sector that is still on solid footing, despite the uncertainty generated by geopolitical events and the damages caused by the excessive rains in various regions of the country. The issues which are most concerning right now are the rising fuel, fertiliser and agrochemicals costs, which could negatively impact farmers’ planting decisions in the coming season. This is all a result of the Russia-Ukraine war and pre-existing supply and logistical constraints caused by the COVID-19 pandemic. It is doubtful that the higher commodity prices will be sufficient to offset the rising costs fully. This is one area that needs constant monitoring and engagement with farmers and agribusinesses in the coming months.
Source: www.agbiz.co.za, Issued by Wandile Sihlobo, chief economist: Agbiz
Weather and climate
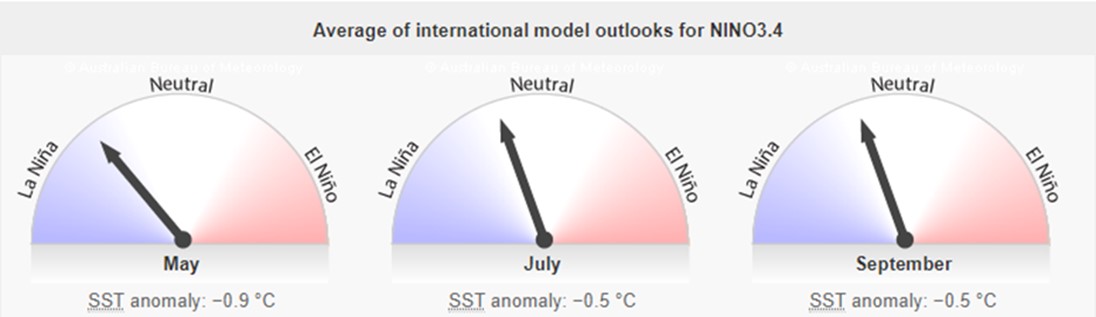
Below-average sea surface temperatures (SSTs) continued during mid-March 2022. In summary, a La Niña is favoured in the next couple of months, with a 64% to 86% chance of La Niña from March 2022 until June 2022.
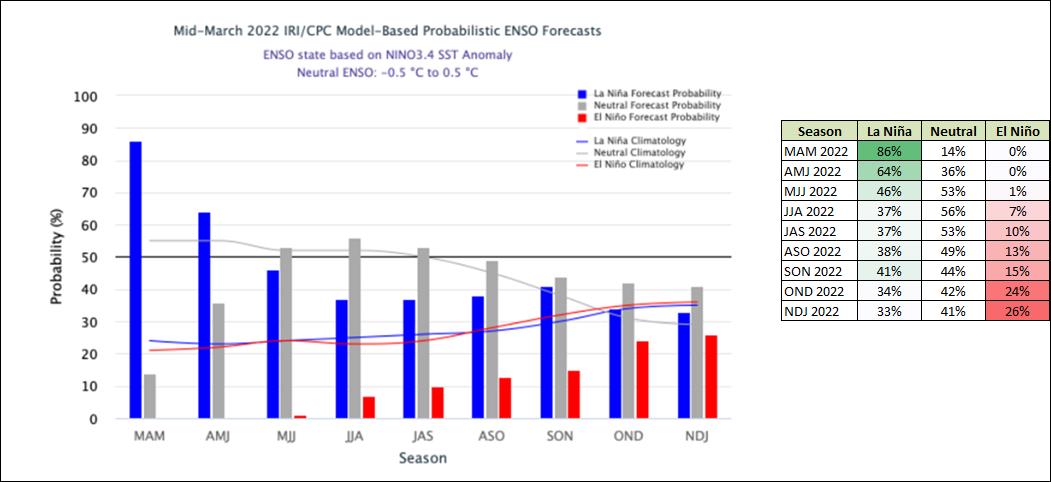
A weak La Niña remains in place where the return to El Niño-Southern Oscillation (ENSO) neutral conditions are predicted for May to July 2022. One model suggests that a La Niña can continue through winter. The majority of the models in the plume predicts SSTs to stay below normal at the level of a weak La Niña until April – June.
Market risk
GRAIN MARKET ANALYSIS
- Ending stock – national
Ending stock data is gathered from the NAMC. The estimates are reassessed and reported by the Grain and Oilseeds Supply and Demand Estimates Committee. The following is a summary of the April 2022 ending stock estimates for the 2021/2022 season:
- White maize => 1 735 717 tons
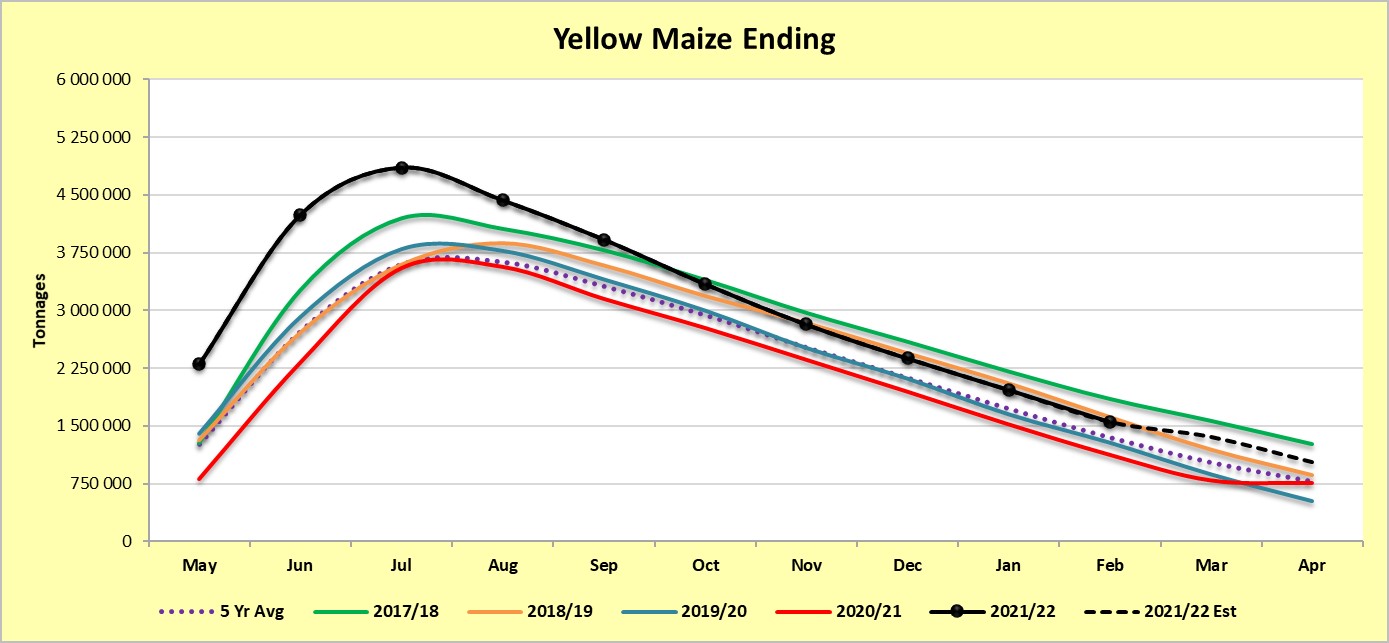
- Yellow maize => 892 682 tons
The following is a summary of September 2022 ending stock estimates for the 2021/2022 season:
- Wheat = 622 509 tons
The following is a summary of the estimated ending stock figures for the 2022/2023 season ending February 2023:
- Sunflower => 137 466 tons
- Soybeans => 250 660 tons
- Sorghum => 94 878 tons
Graph 2 shows the ending stock for white maize for April 2022, which is 279 764 tons or 21% more than the 2020/2021 season. Graph 3 shows a 273 229 tons or a 36% increase in ending stock estimation for the 2021/2022 season compared to the previous season.
Source: Sagis
Source: Sagis
The final soya ending stock for February 2022 is 123 657 tons more than February 2021 – an astronomical increase of 269% (Graph 4).
Source: Sagis
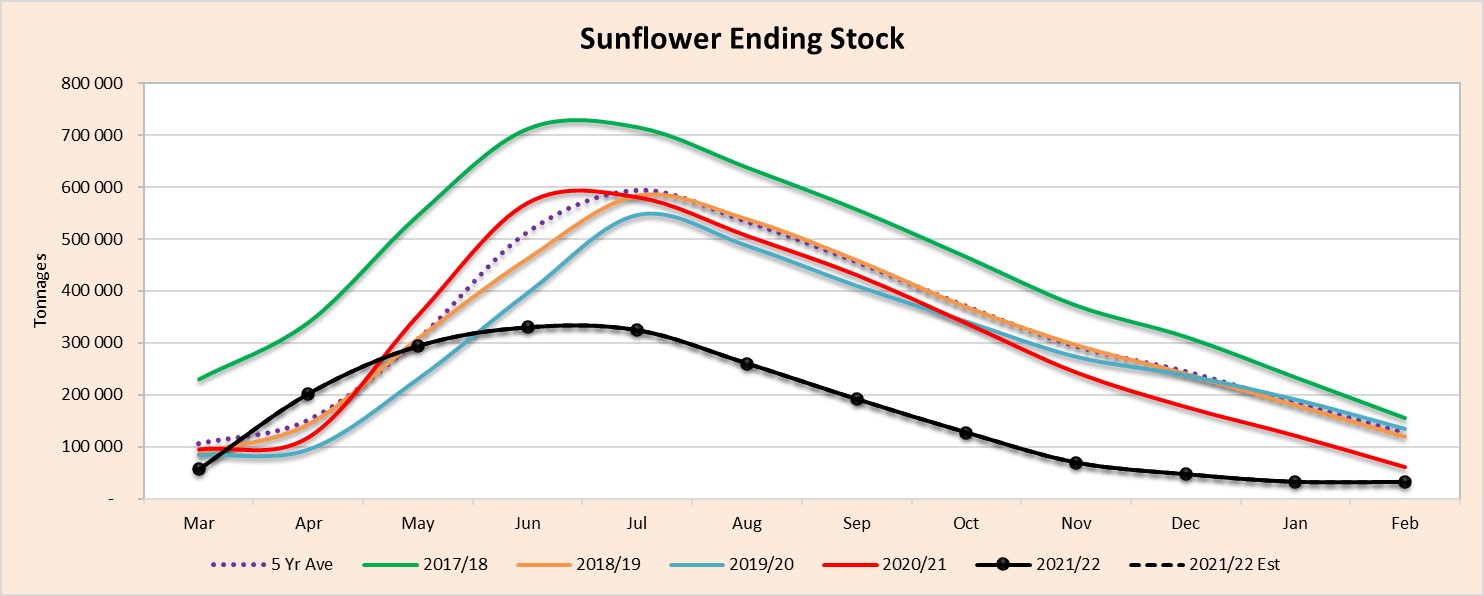
The final sunflower ending stock is 48% (29 178 t) less than the previous seasons ending stock (Graph 5).
Source: Sagis
- Crop estimations
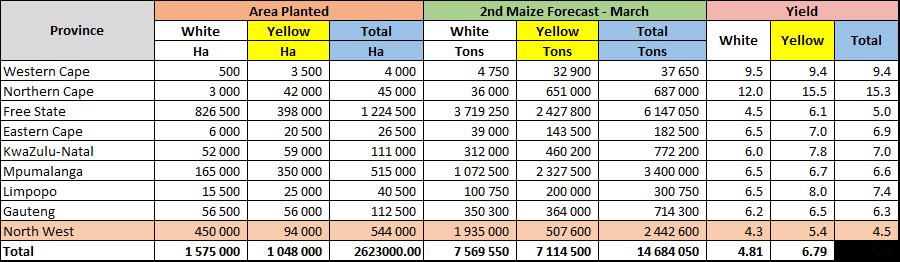
According to the Crop Estimate Committee’s (CEC) first forecast for 2022/2023 the size of the expected commercial maize crop has been set at 14,684 million tons, which is 8% less than the second forecast in 2021 of 15,921 million tons. The area estimate for maize is 2,623 million hectares, while the expected yield is 5,6 t/ha. According to the second maize forecast (Table 1) the three main maize producing areas – the Free State, Mpumalanga and North West – are expected to produce 82% of the 2021/2022 crop.
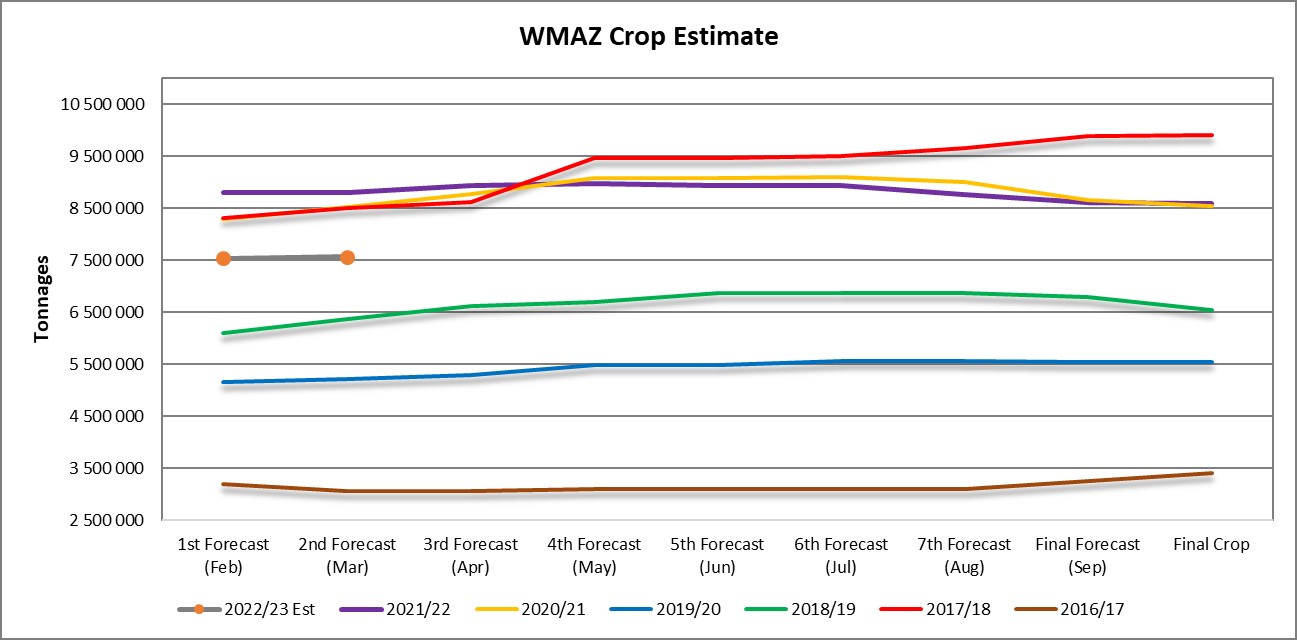
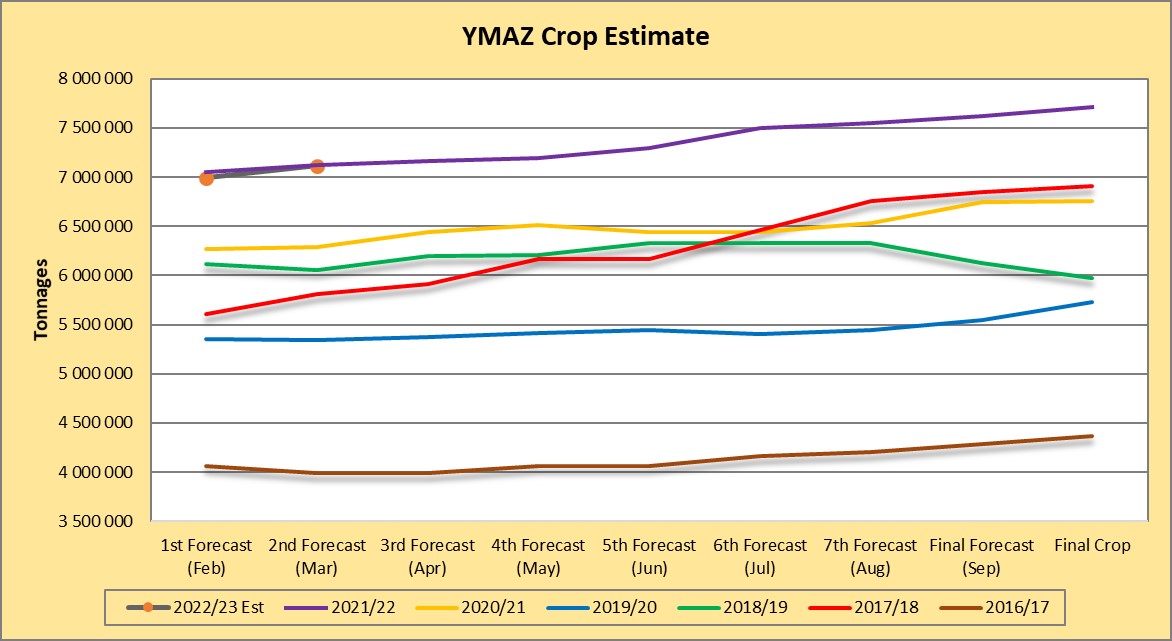
The area estimate for white maize (Graph 6) is 1,575 million hectares and for yellow maize the area estimate is 1,048 million hectares. The second production forecast of white maize is 7,569 million tons. The yield for white maize is 4,81 t/ha. In the case of yellow maize (Graph 7) the second production forecast is 7,114 million tons. The yield for yellow maize is 6,79 t/ha.
Source: CEC (Crop Estimates Committee)
Source: Sagis
Source: CEC
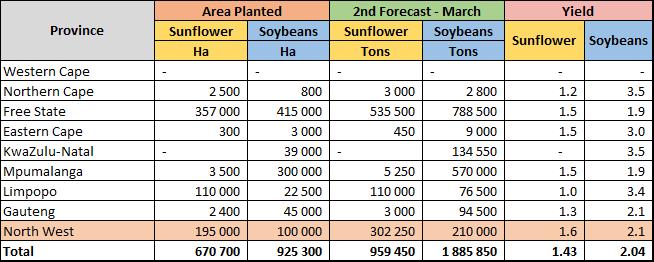
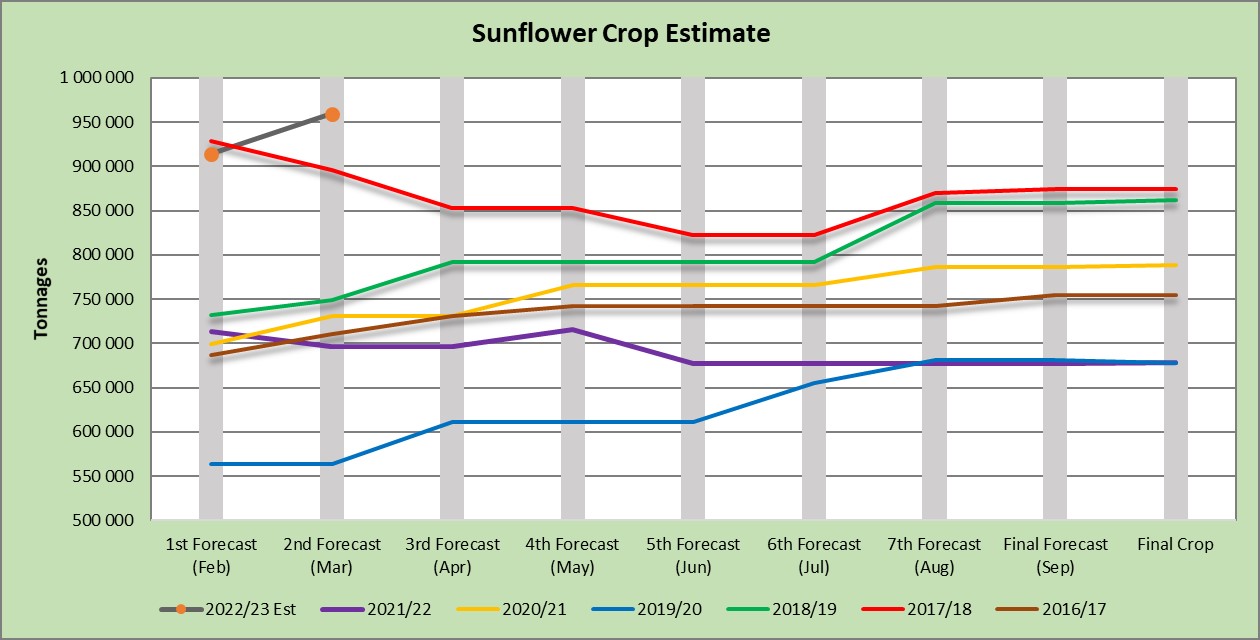
Table 2 shows the preliminary area estimate for sunflower seed (Graph 8) is 670 700 hectares, which is 40% or 192 900 hectares more than the 477 800 hectares planted the previous season. The production forecast for sunflower is 959 450 tons which is 42% more than the final crop of the previous season.
Source: CEC
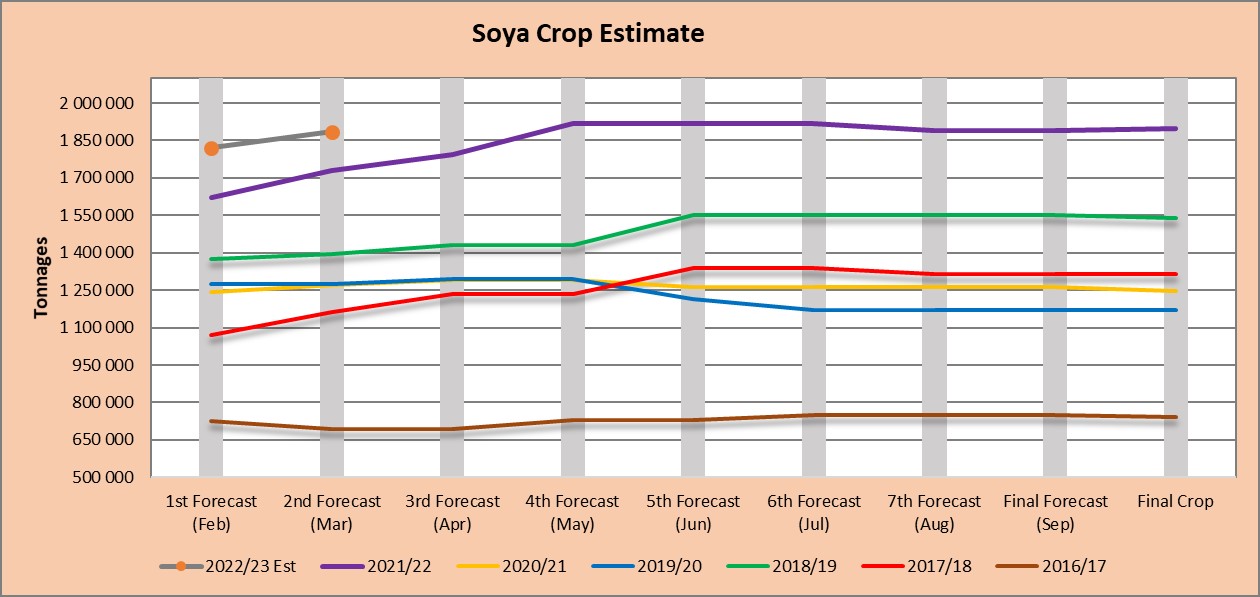
It is estimated that 925 200 hectares have been planted to soybeans (Graph 9), which represents an increase of 12% or 98 200 hectares compared to the actual 827 100 hectares planted last season. This is the highest area planted to soybeans in the history of South Africa. The production forecast for soyabeans is 1,885 mills tons which is 1% less than the final crop of the previous season.
Source: CEC
- Imports and exports – national
Source: Sagis
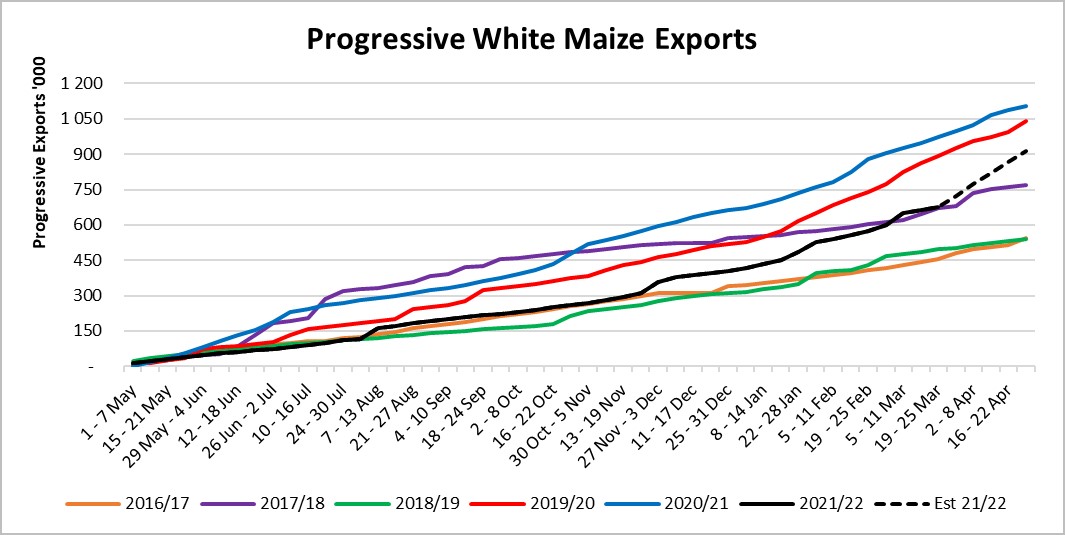
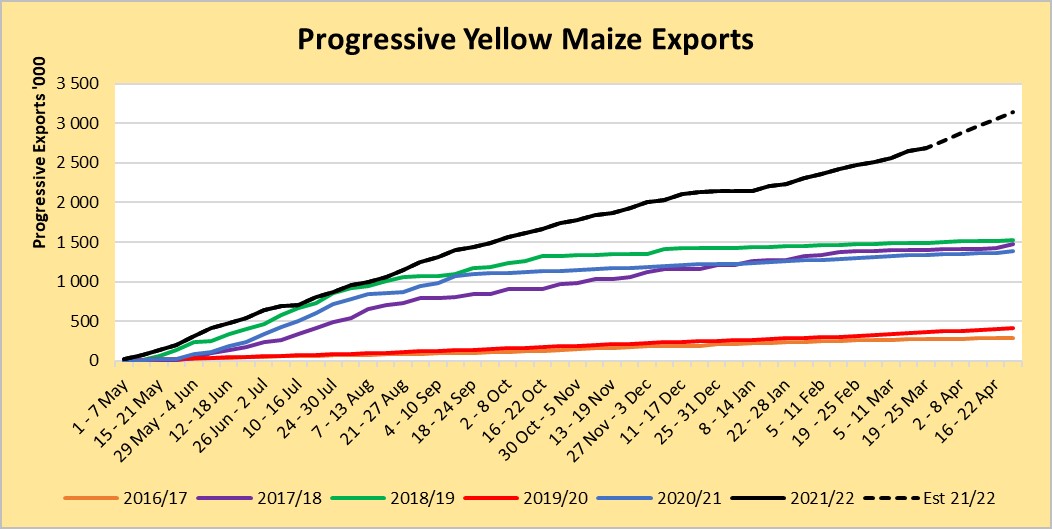
To date, 675 601 tons of white maize (Graph 10) and 2 689 315 tons (Graph 11) of yellow maize have been exported since the beginning of May 2021.
Source: Sagis
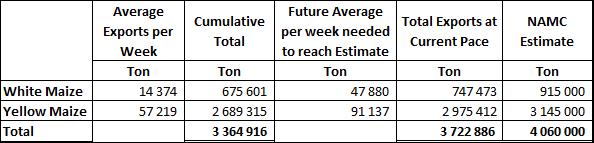
As seen in Table 3 the average white maize exports per week are currently 14 374 tons. If theoretically, white maize exports remain at the current average of 14 374 tons per week then there would be 167 527 tons less white maize exports than anticipated.
The average yellow maize exports per week are currently 57 219 tons. If theoretically, yellow maize exports remain at the current average of 57 219 tons per week then there would be 169 588 tons less yellow maize exports than anticipated.
- Parity prices
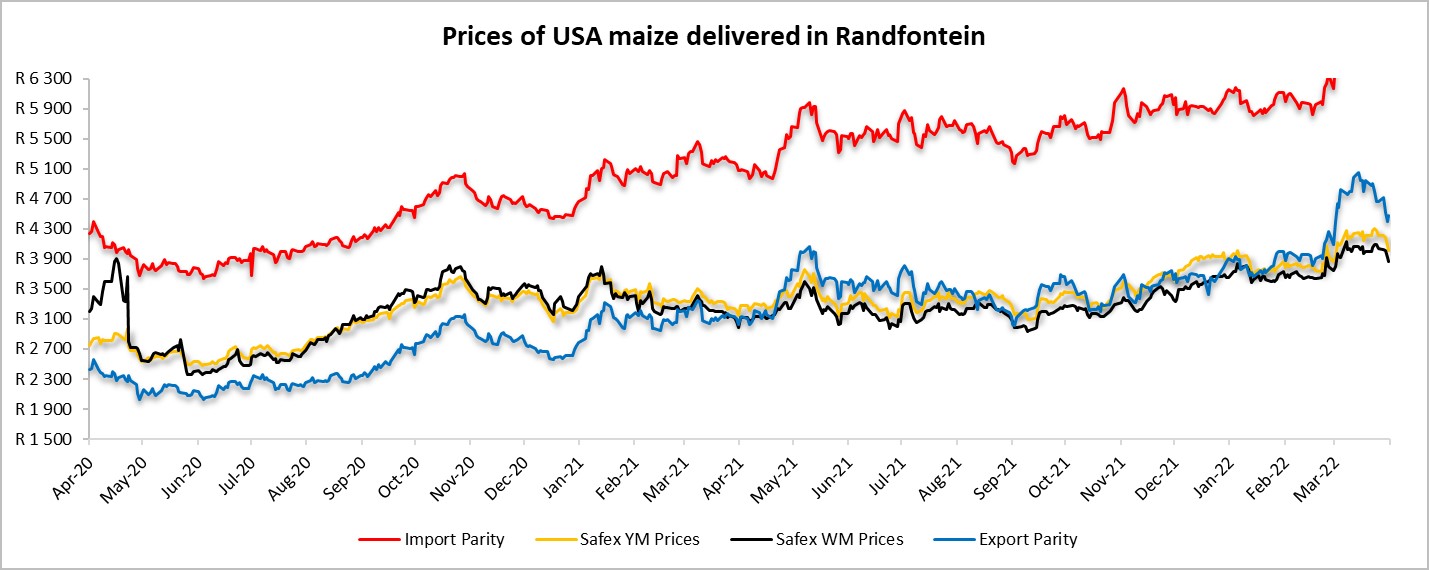
South Africa is a small producer compared to other countries and is thus a price taker (meaning that we cannot influence world prices). Because of this, our local prices are normally between import and export parity, which is illustrated in which is illustrated in Graph 12. An import parity price is defined as the price which a buyer will pay to buy the product on the world market. This price will include all the costs incurred to get the product delivered at the buyer’s destination.
An export parity price is defined as the price that a local seller could receive by selling his product on the world market for example, excluding the export costs. The price which the seller obtains is based on the condition that he delivers the product at the nearest export point (usually a harbour) at his own expense.
Source: Grain SA
- Producer deliveries – provincial
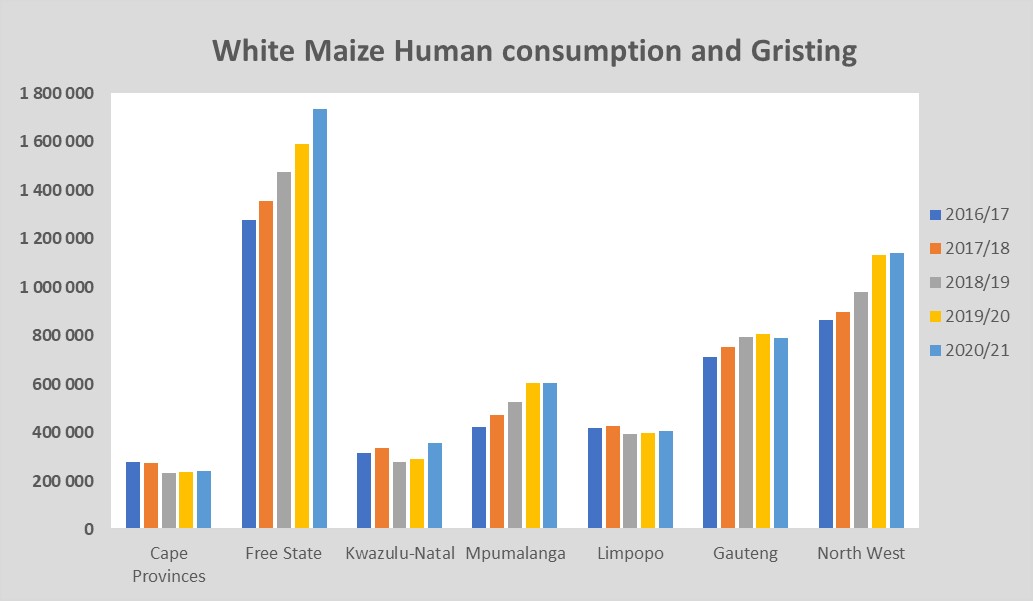
For the marketing year which is May to April the Free State dominates the white maize which is used for human consumption and gristing. North West showed a significant increase for the 2020/2021 season with a 1% rise over the previous season (Graph 13).
Source: Sagis
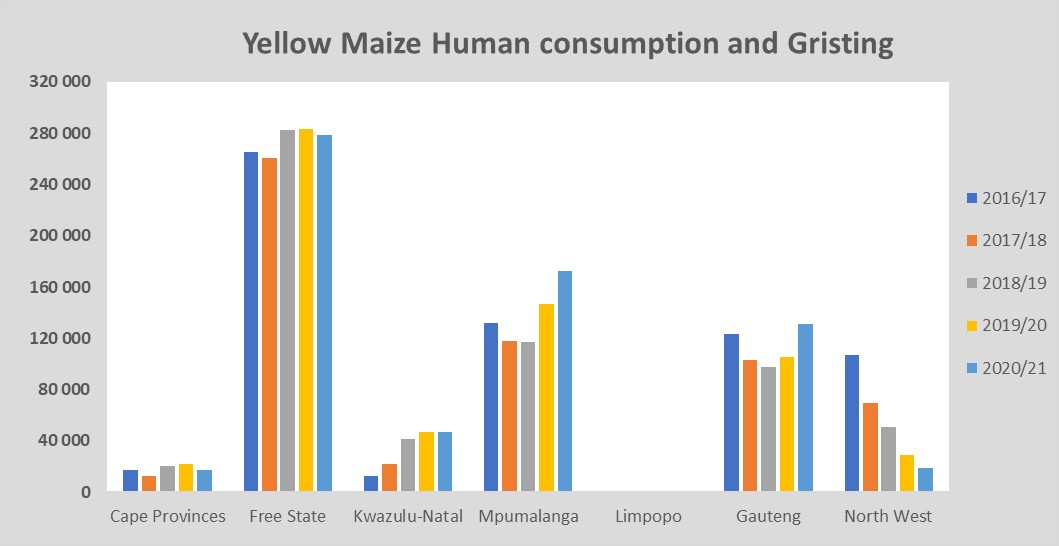
North West has a decreasing trend in yellow maize which is used for consumption and gristing. Only 18 563 tons of yellow maize was used in the 2020/2021 season that ended April 2021 (Graph 14).
Source: Sagis
- Exchange rate
NWK Group is exposed to foreign exchange rate risk on various business areas, such as commodity prices and trade imports.
On a monthly average basis, the rand depreciated against the US dollar with 1,52% (0,23c) over the period February 2022 to March 2022. The one-year average for rand/US dollar is 14,85. Moreover, the average rand/US dollar exchange rate for the period March 2022 was R14,98 compared to R15,22 in February 2022 (Graph 15).
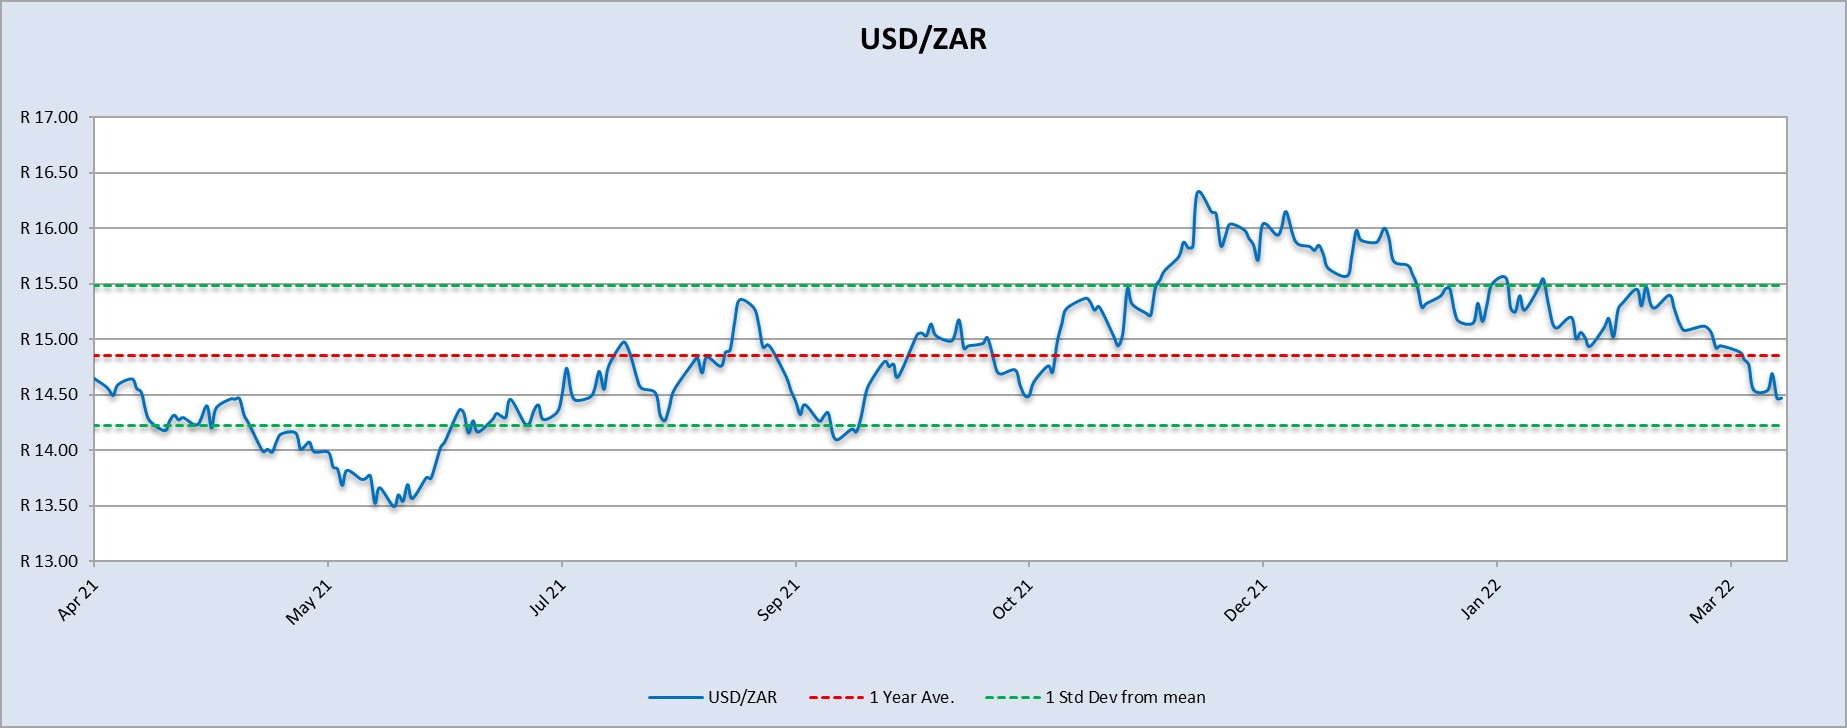
Source: Standard Bank, Corporate and Investment Banking & SARB
Exchange rate forecast:
Graph 16 shows the actual USD/ZAR for 2021 Quarter 4 (Q4) and 2022 Quarter 1 (Q1) against the forecasted figures. The Economy Forecast Trading’s exchange rate forecast for 2022 Q1 was the closest to the actual exchange rate. According to Nedbank and The Enonomy Forecast Agency and Trading Economics the rand will weaken in the year 2022.
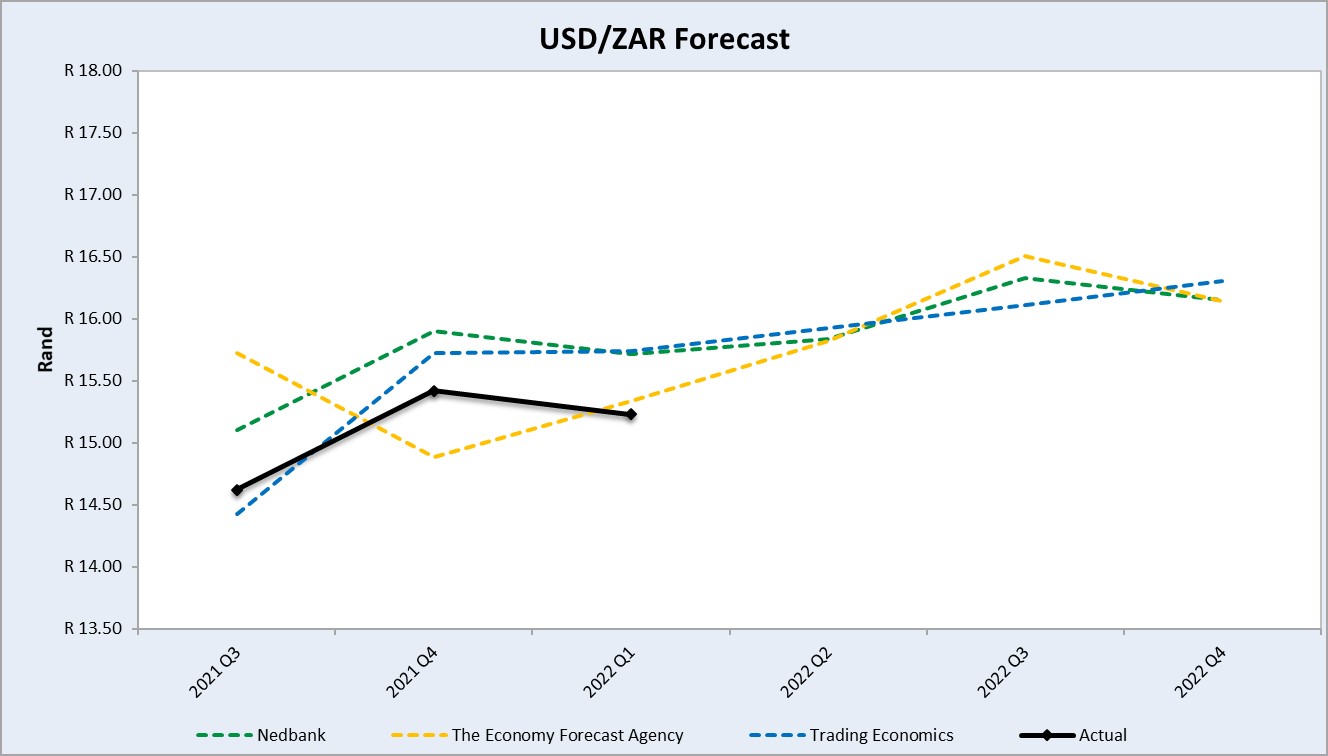
Source: Nedbank CIB; Absa; The Economic Forecast Agency; Trading Economics
- Highlights in the agrochemical sector
In the first quarter of 2022, the fading impact of the ‘Double Control Policy’ will support China’s agrochemical operation rate from March 2022. The double control policy provides a clear alert level of energy consumption intensity reduction and amount reduction. In accordance with China’s Paris Agreement pledge to become carbon neutral. In December China’s annual Central Economic Work Conference released the principle of ‘Double Control Policy’, which mentioned that ‘renewable energy and raw material energy, which is for production (not for fuel or power), are not included in the total energy consumption control’. The clarification supported diminishing the impact of the ‘Double Control Policy’ on ordinary industry operations in 2022. Not only are raw material producers slowly back to normal, but also the upstream manufacturers, especially intermediate producers, can plan for consistent supply for the new season.
Source: Agribusiness Global Direct
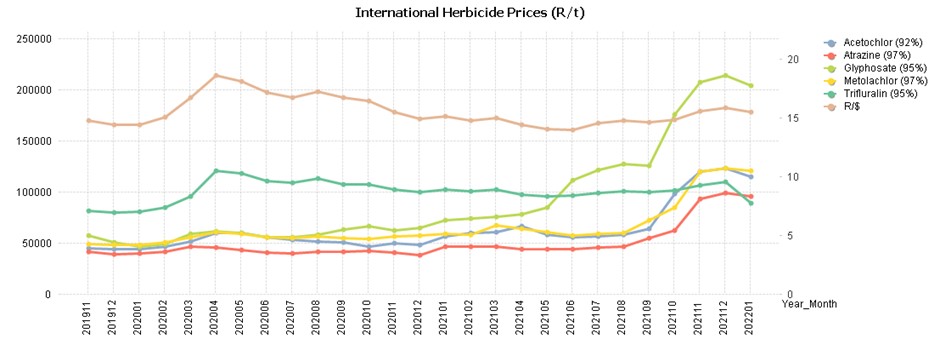
Herbicides
The following comparison is from the February 2022 Grain SA report which reports the previous month prices.
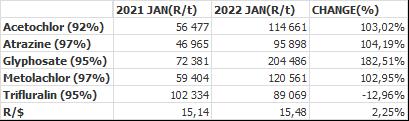
Year to year change (R/t): In comparison with the previous year’s prices, there was a significant increase in prices in four of the five main products. From an increase of 102,95% in Metolachlor to an increase of 182,51% in glyphosate. The only product that has a price decrease was Trifluralin with a decrease of -12,96%. The rand/dollar exchange rate deviates 2,25% from last year and also has an impact on prices.
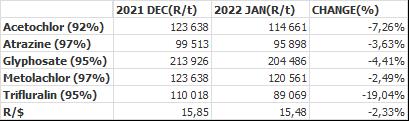
Herbicides – month to month change (R/t): From December 2021 to January 2022 there was a decrease in price on all of the products. The largest price decrease was Trifluralin with -19,04%. Graph 17 shows the international herbicides prices R/t per product from November 2019 up to January 2022.
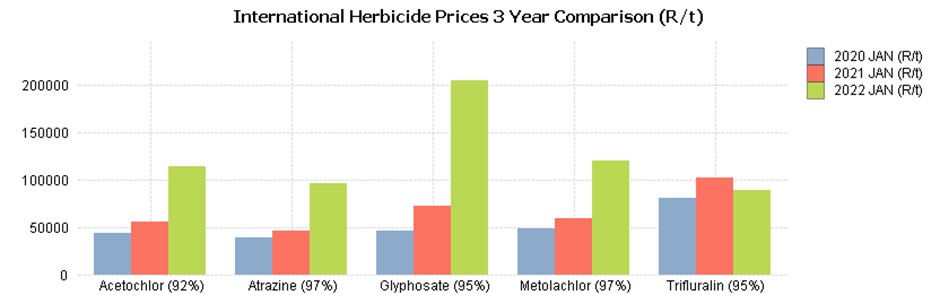
Graph 18 compares the international herbicides prices rand per ton per product from January 2020 to January 2022. The increase in the products can be seen here except Trifluralin which has decreased since 2021.
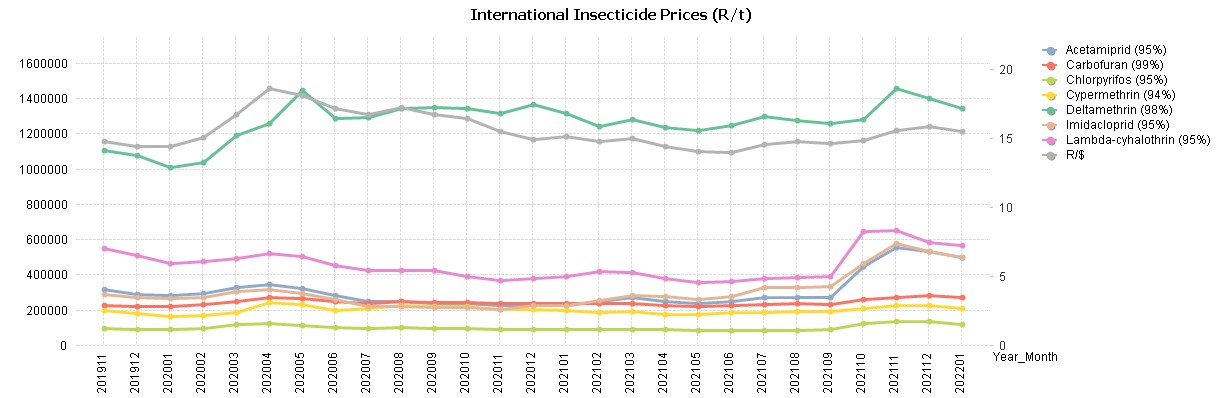
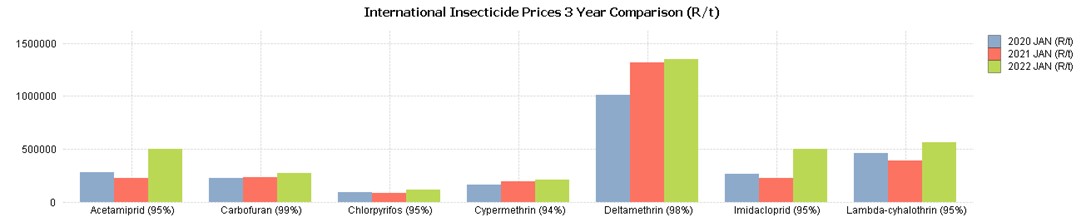
Insecticides
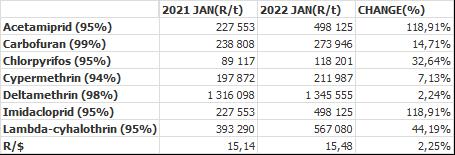
Insecticides – year to year change (R/t): In comparison with the previous year’s prices, there was a significant increase in prices in four of the four main products. An increase of 118,91% in Imidacloprid and an increase of 118,91% in Acetamiprid. There was also a 44,19% increase in Lambda-cyhalothrin and a 32,64% increase in Chlorpyrifos.
The R/$ exchange rate deviates 2,25% from last year and also has an impact on prices.
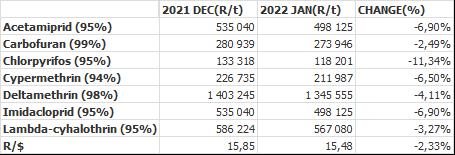
Insecticides – month to month change (R/t): From December 2021 to January 2022 there was more of a decrease in prices than an increase. All of the products show a decrease in prices, both in dollar and rand terms.
Fertiliser
Highlights in the fertiliser market:
-
- China announced the suspension of fertiliser exports until June 2022 to ensure domestic availability amid food security concerns China’s exports of DAP (diammonium phosphate) and urea account for approximately one third and one-tenth of global trade, respectively.
- Russia recently announced restrictions on nitrogen and phosphate fertiliser exports for six months, effective December 2021.
- 2022 outlook urea prices are anticipated to decline marginally in 2022 as feedstock costs moderate DAP prices are projected to remain elevated in the first half of 2022 on expectations of tight supply unless Chinese export restrictions are relaxed earlier than anticipated.
- MOP (Muriate of potash) contract prices are forecast to surge in 2022 following significant increases in spot prices. Upside risks to the outlook include further supply disruptions while downside risks (especially in the longer term) include intensification of environmental policies restricting fertiliser use.
Source: GrainSA/World Bank Blogs
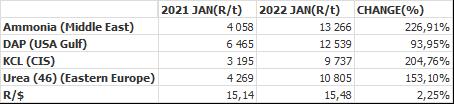
Fertiliser – year to year change (R/t): As seen in Table 6 all of the main fertiliser products increased significantly from January 2021 to January 2022. The highest increase was ammonia with 226,91%, followed by KCL 204,76% and urea 153,10% and DAP with 93,95%, based on average international prices R/t. The exchange rate differs 2,25 % from the previous year, so the increase in rand terms was also due to the exchange rate.
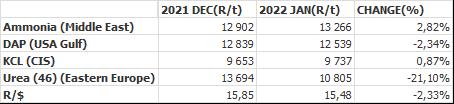
Fertiliser – month to month change (R/t): For the two months December 2021 to January 2022, there was a decrease in the price of two products, urea with -21,10% and a -2,34% decrease in DAP in the international fertiliser prices.
The only products with a price increase are ammonia and KCL with a 2,82% and 0,87% increase respectively.
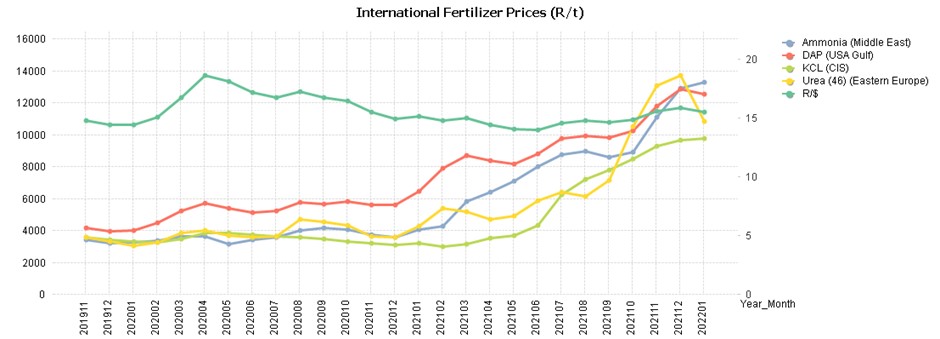
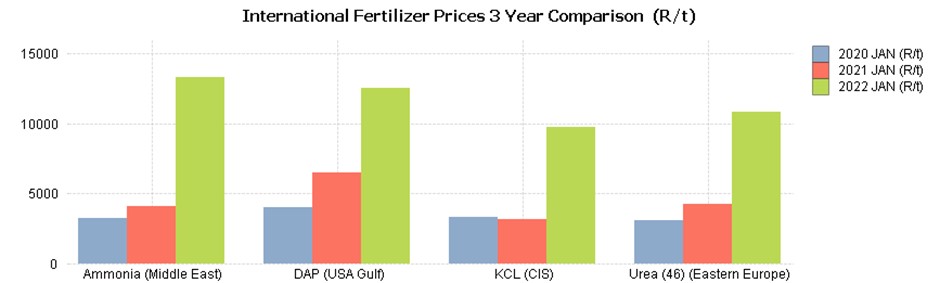
On Graph 22 the increase in international fertiliser prices can be seen. The three years that are compared in the graph are 2020, 2021, 2022.
- National Budget Speech
The minister of finance, Enoch Godongwana, delivered the National Budget speech on 23 February 2022. The national budget and forecasts were released before the Russia-Ukraine war; however, we can still reflect on what was said and look at some of the changes the National Treasury proposed for the next fiscal year.
GDP growth is expected to average at 1,8% over the next three years. This is due to the risk of new COVID-19 variant outbreaks, rising global inflation, and continued disruptions to power supply. Macro-economic outlook projects a real GDP growth of 2,1% in 2022. The government aims to support GDP growth with new infrastructure projects with an investment value of R595 billion.
The pandemic and the public violence of July 2021 had a severe effect on the labour market. Consequently, there were 2,1 million fewer jobs in the third quarter of 2021 than in the final quarter of 2019. Furthermore, the unemployment rate in the third quarter of 2021 rose to 34,9%, the highest rate recorded since 2008. There were 660 000 jobs lost in the third quarter and, as a result of the July violence, 309 000 of these jobs were in the trade sector.
The decision by the constitutional court to uphold the appeal related to non-implementation of the final leg of the 2018 wage agreement poses a great risk to the government. If, however, the court sides with workers on this case, the government will need to procure an additional R80 billion to R85 billion. This will most likely be raised through taxes, more debt or downsizing jobs.
Service debt continue to require an increasing share of GDP and is expected to average at R33,4 billion, a year over the medium term. However, the total consolidated spending will come to R6,64 trillion over the next three years and the bulk of this spending is allocated to learning and culture, R1,3 trillion, social development, R1 trillion, and service debt, R1 trillion, over the medium-term expenditure framework (MTEF).
The budget accounts for 59,4% of all non-interest spending to be allocated to social wage. This includes health, education, housing, social protection, employment programmes and local amenities. The budget also provides for a twelve-month extension of the R350 per month special COVID-19 social relief of distress grant. Furthermore, the greatest vaccine purchases were made in 2021/2022. However, R2,3 billion is allocated for more vaccine purchases in 2022/2023.
Since 2008/2009 South-Africa experienced a series of economic shocks, unbudgeted expenditures and then COVID-19. This resulted in an immense increase in public debt. In 2008/2009 real public debt equalled R22 869 for every person in South-Africa and it currently stands at R69 291 for every person. However, gross debt is projected to stabilise at 75,1% of GDP in 2024/2025.
The government proposed a tax relief of R5,2 billion in an effort to help support the economy. Most of this relief will be provided through a 4,5% adjustment in income tax brackets and rebates, in line with inflation. They also proposed no further increases to the fuel levies and a 1%-point reduction in the corporate tax rate. Furthermore, the tax revenue estimates are higher than the 2021 MTBS with estimates of R71 billion in 2022/23, R86,3 billion in 2023/2024 and R94,4 billion in 2024/2025.
Although major commodity prices decreased during the second half of 2021, these prices still remain above pre-pandemic levels. However, iron ore, platinum and palladium prices are expected to ease in the near term while oil and coal prices are expected to continue to increase in the near term. Nevertheless, coal and iron ore prices are expected to ease in the long-term to offset gradually rising precious metal prices.
Capital flows to developing countries have decreased which is posing a threat to highly indebted countries. In developing economies, the government debt-to-GDP levels increased from 54% in 2019 to 63% in 2021. Consequently, slowing their recovery from the pandemic due to financial stress.
In conclusion, the government aims to achieve a primary surplus, meaning revenue exceeds non-interest expenditure, by 2023/2024. This is a result of a higher-than-anticipated revenue collection which was used to narrow the deficit and reduce the borrowing requirement.
Sources: Exceed / www.gov.za / BusinessTech
- Economic impact of the Russia-Ukraine war
Impact on the broader economy: Despite South Africa’s special role with Russia via the BRICs (Brazil, Russia, India, China, and South Africa) grouping of middle-income countries, the South African government took a stronger stance, calling for Russia to withdraw its forces.
The invasion of Ukraine by Russia has a ripple effect on the world economy. Various countries will feel the short and long term effects of this war. Not all is however negative as a few possibilities arise in the short term.
For one, Ukraine is the biggest exporter of sunflower oil followed by Russia. Russia also ranks first in the world for holding 24% of the world’s total natural gas reserves. Europe receives 30% to 40% of its total gas from Russia and it is going to be difficult to wean itself from Russia to loosen Vladimir Putin’s grip on European countries. Evidentially the price of sunflower oil and natural gasses increased as exports from Russia and Ukraine are backed-up. Brent crude oil recently reached $130 per barrel and analysts predict even further increases. European natural gas also jumped 62%. Despite this several other countries who are also suppliers of sunflower oil and natural gasses may benefit from this war as countries will have to look elsewhere for their usual imported resources.
International sanctions placed on Russia could place a growing demand on palladium as Russia is the world’s biggest producer of palladium with South Africa second. Palladium is a critical component in the manufacturing of automobiles and electronics. Similarly, Russia and South Africa are major exporters of gold and the South African rand has been strengthening as a result of rising global prices for the precious metal.
Despite these possibilities the attack on Ukraine could pose hardships for households, the agricultural sector and food security. The rising price of oil is causing fuel prices to increase and consequently lead to transport being a luxury. In fact, South Africa’s automobile association (SAA) predicts record-high fuel prices for March. On 6 March City Press reported that fuel prices may even hit R40/litre. Ridiculously high fuel prices and fertiliser prices (see Highlights in the agrochemical sector) will shake the economy and consumers hard.
Source: Business Tech
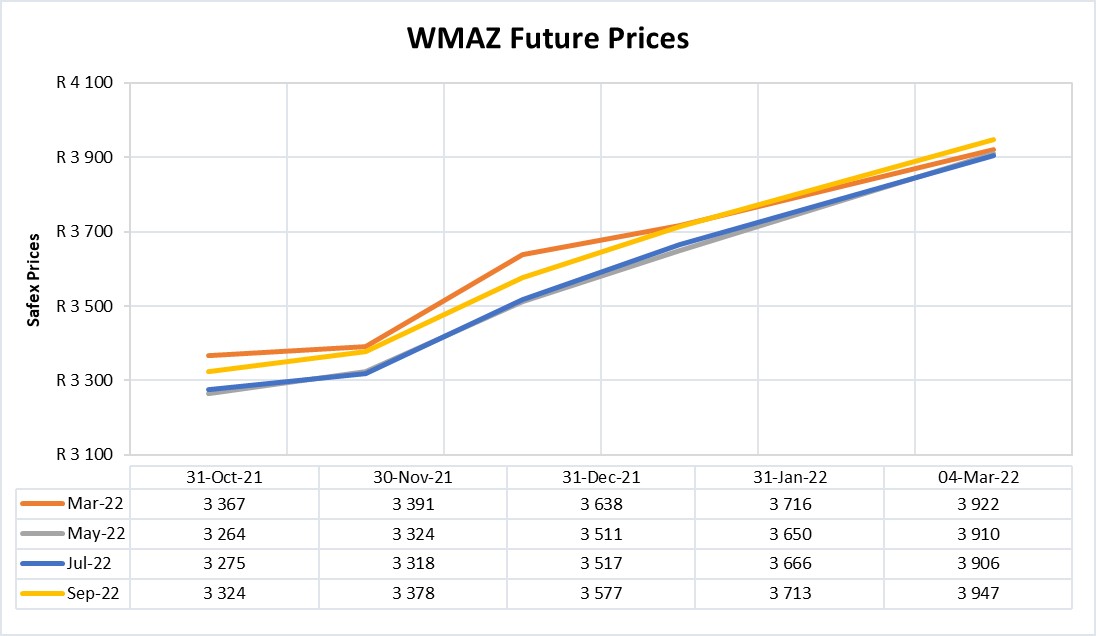
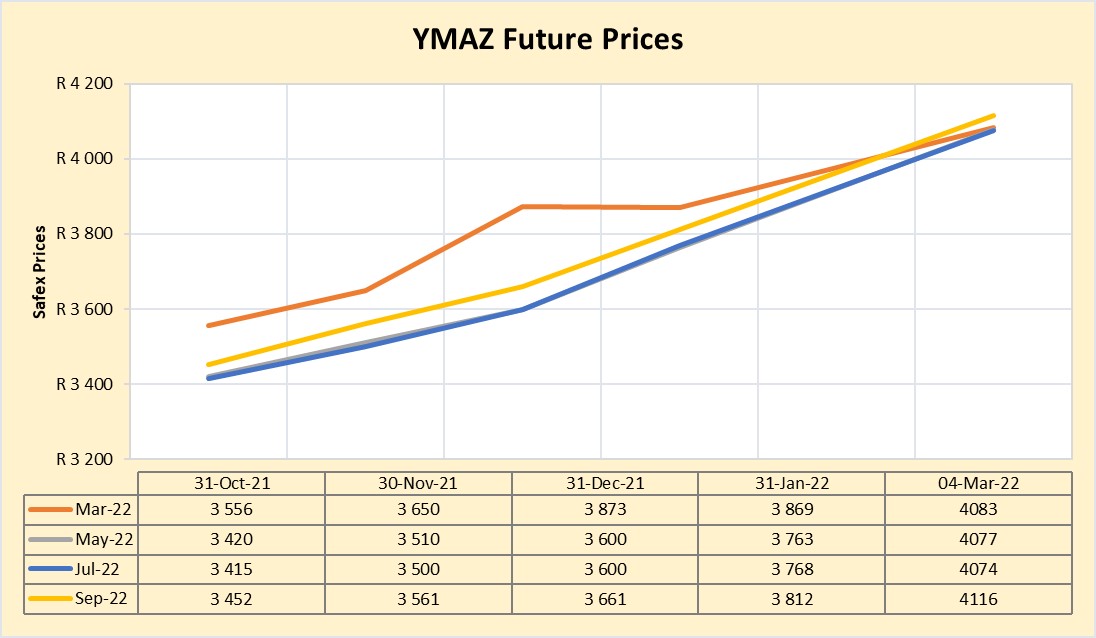
- Future prices
Graphs 23 and 24 illustrate the market sentiment for maize, in the form of future contracts, for the upcoming contract months. The market sentiment is the expectation of supply and demand fundamentals relating to white and yellow maize in South Africa.
Source: Sagis
Source: Sagis
INTEREST RATE RISK
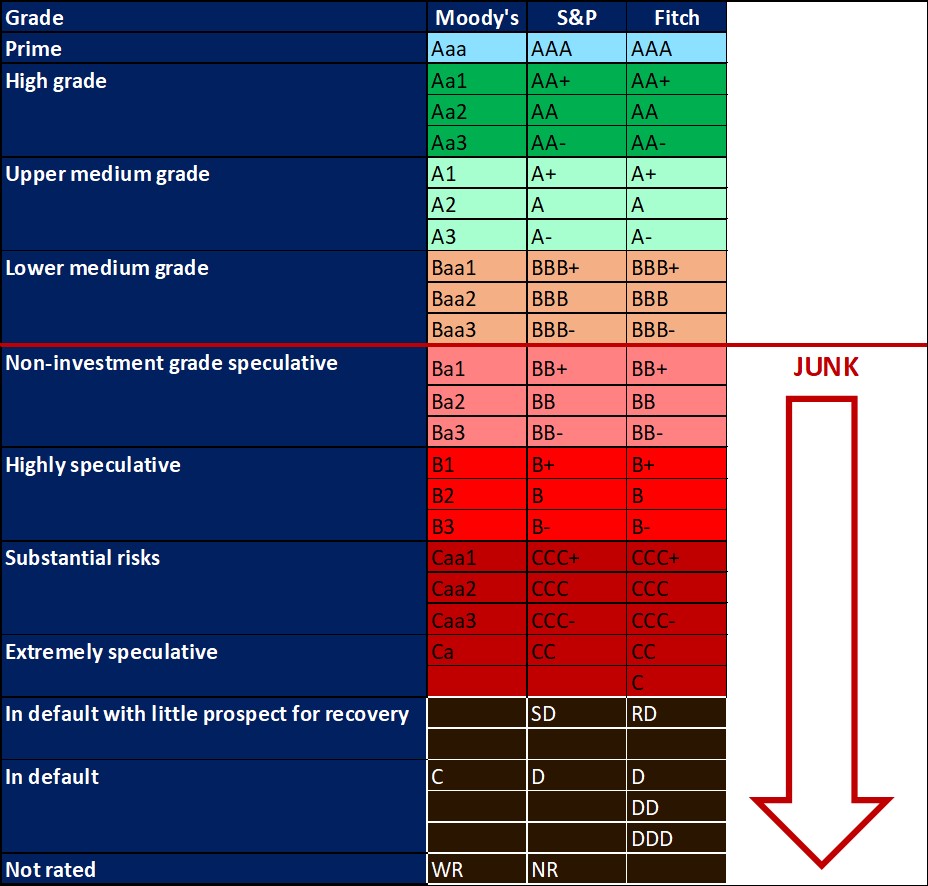
On 27 March 2020, Moody’s downgraded South Africa’s sovereign credit rating to sub-investment grade and placed a negative outlook on the rating. The key drivers for this downgrade include weak economic growth, continuing deterioration in fiscal strength, and slow progress on structural economic reforms. It is now the first time in post-apartheid South Africa where all major rating agencies, that is, Moody’s, Fitch and S&P, have South Africa’s credit ratings in sub-investment grade territory.
The COVID-19 pandemic forced the South African Reserve Bank to make a number of interest rate cuts to bring relief to the economy. Interest rate movement:
- 20 March 2020: 8,75%
- 15 April 2020: 7,75%
- 22 May 2020: 7,25%
- 23 July 2020: 7,00%
- 18 November 2021: 7,25%
- 27 January 2022: 7,50%
- 24 March 2022: 7,75%
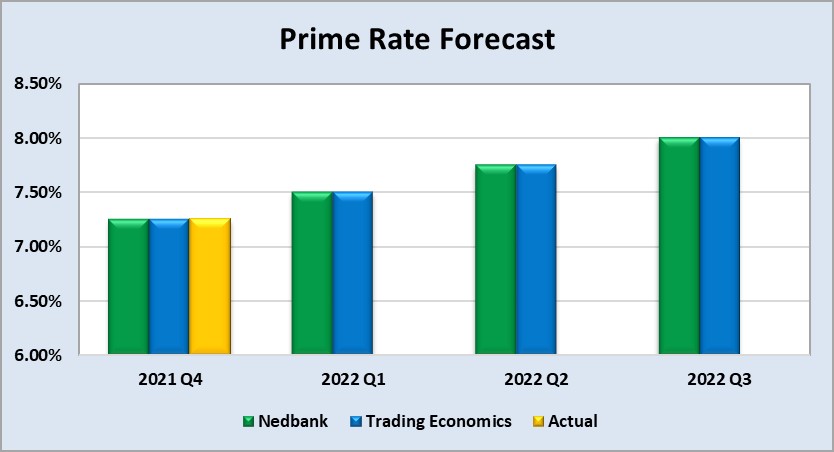
Graph 25 shows the prime rate forecast for 2022 Q1 to 2022 Q4. Nedbank as well as Trading Economics’ forecast that the prime interest rate will increase with 50 basis points for 2022 Q2. The forecast realised on 24 March 2022 when MPC increased the prime interest rate with a further 25 basis points. The next MPC meeting date is 19 May 2022.
Fraud risk
FRAUD AWARENESS
Chargebacks can cause a company to miss its revenue goals. Therefore, the clients’ full details and credibility should be confirmed when accepting chargebacks. A fraud prevention solution with guaranteed chargeback would be optimal. This can help the company with more predictable costs and shipping out good products to great clients.
Completely understand the offer of a supplier. The details of the products or services, total price, delivery time, refund and cancellation policies and the terms of any warranty should be clear. If any of these details are missing or cannot be provided by the supplier the offer might be a scam.
In the case of providing financial or sensitive information online, the letters at the beginning of the web address should change from ‘http’ tot ‘https’ or ‘shttp’ which means the information is being encrypted or scrambled so it cannot be read if intercepted.
Employees who rarely or never take leave might be hiding fraudulent activities. It is thus important that every employee must take a mandatory number of days leave a year so their work can be done by others in order to detect possible fraudulent behaviour.
Compare banking details on invoices received from suppliers to the banking details on the companies’ system. It could happen that a supplier’s email was intercepted by scammers who then provided different banking details in order to obtain the money payable to the supplier.
It is imperative to remember that a financial institution will never request personal or confidential information by means of an email. They will always contact you directly through a contact number.
Open lines of communication between employers, employees and managers. It is important to have good working relationships with within the workplace since often times an unnoticed attitude change of a distraught employee could be a potential fraud risk for the company:
An employee who feels unappreciated by managers or bosses may commit fraud as a revenge strategy.
Employees who have heavier workloads due to layoffs may also be a fraud risk.


