
The NWK Limited external factors report provides an overview of the main external factors that NWK and its clients are exposed to at a specific point in time. This report opts to aid in a timely basis to foresee external market and other factors that may have an impact on any business and clients. The main focus of this document is to have a closer look at external factors that can affect any business and our customers.
Executive summary
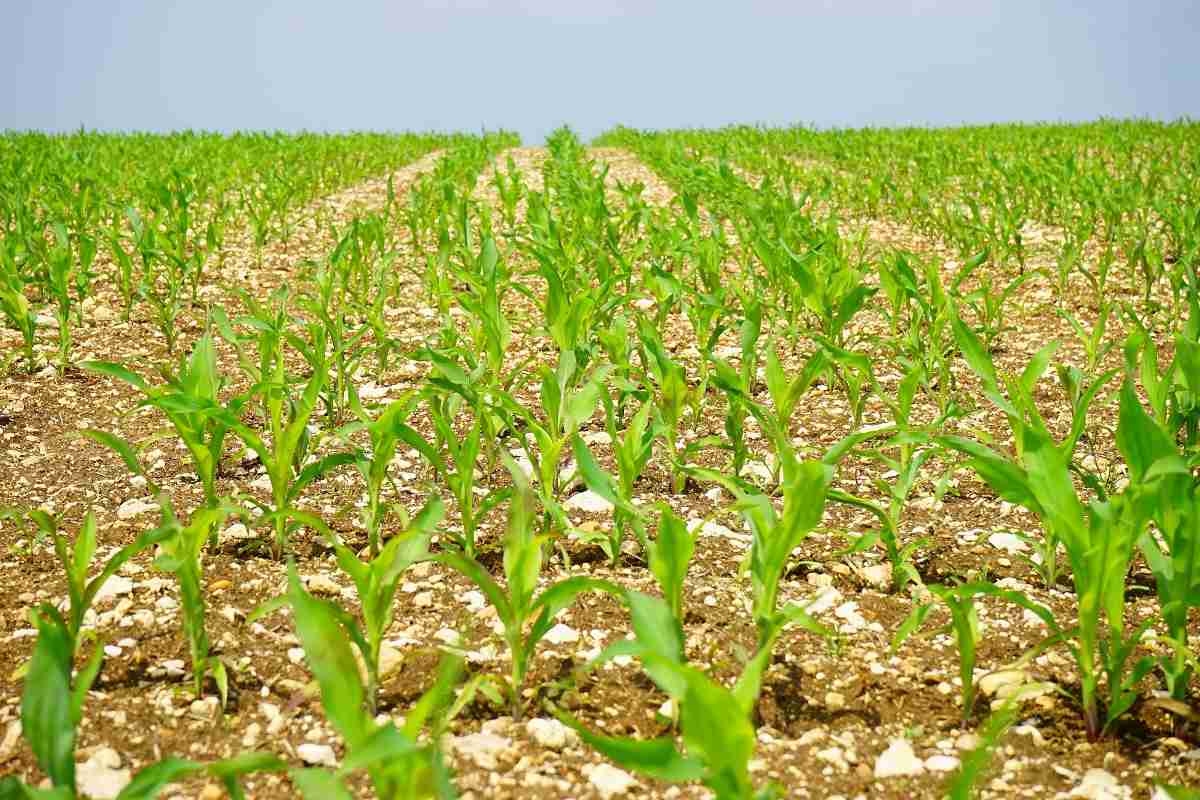
The Agribusiness Confidence Index for June (Q2), compiled by the Agricultural Business Chamber (Agbiz), presents a picture of a sector that is still on solid footing. The National Agricultural Marketing Council (NAMC) predicts 30 April 2022 ending stock for white and yellow maize to exceed that of the 2020/2021 season. Their forecast for white maize for the season is that of an excellent harvest. The estimated maize crop is 10% less than the 2021/2022 crop. According to the fourth maize forecast the three main maize producing areas – the Free State, Mpumalanga and North West – are expected to produce 82% of the 2022/2023 crop.
The repo rate has been cut by 300 basis points to help mitigate the economic fallout of the COVID-19 pandemic until November 2021. During November 2021 the Monetary Policy Committee (MPC) of the South African Reserve Bank (SARB) increased the repo rate with 125 basis points. The repo rate is currently 4,75% and the prime rate is 8,25%. A tough year lies ahead for businesses and consumers as it has a negative impact on employment and growth. Experts also warn that the MPC must proceed with caution in deciding if and by how much interest rates should be further raised this year.
The Russia-Ukraine conflict has a big impact on the global economy as these two countries are rich in minerals and key role-players in the export of oil, natural gasses, sunflower oil, palladium and fertiliser materials amongst others. With exports influenced the increasing demand for these resources cause prices to rise. The spill over effect of rising brent crude oil prices is higher fuel prices which result in higher food prices and in turn causes inflation to rise. When inflation goes up interest rates also tend to go up in an effort to get inflation under control.
Agbiz/IDC ACI moderates in Q2, 2022
Agbiz quarterly conducts a survey in order to create an Agribusiness Confidence Index (ACI). The Agbiz/IDC Agribusiness Confidence Index, which was released on 13 June 2022, reflects the perceptions of at least 25 agribusiness decision-makers on the ten most important aspects influencing a business in the agricultural sector.
These ten aspects are:
- turnover;
- net operating income;
- market share;
- employment;
- capital investment;
- export volumes;
- economic growth;
- general agricultural conditions;
- debtor provision for bad debt; and
- financing cost.
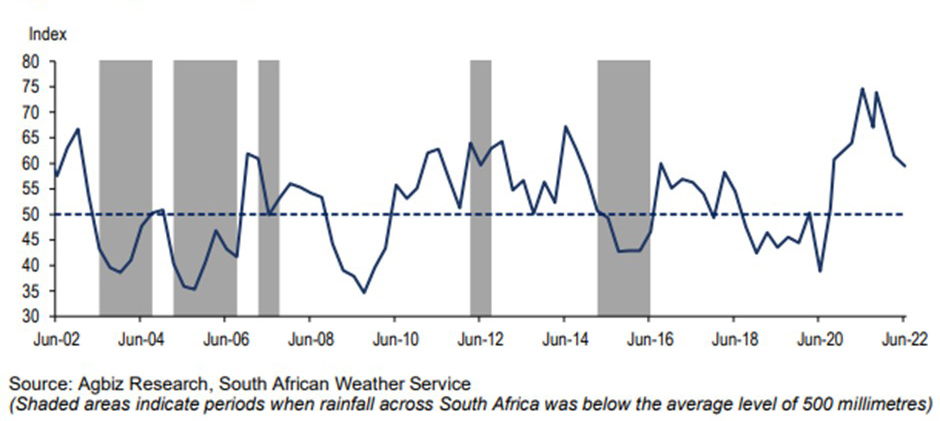
These aspects are used by agribusiness executives, policymakers and economists to understand the perceptions of the agribusiness sector. It also serves as a leading indicator of the value of the agricultural output while providing a basis for agribusinesses to support their business decisions. Graph 1 shows the Agribusiness Index from 2002 to 2022.
The ACI is comprised of ten subindices, of which eight declined in the second quarter of this year. The turnover subindex lifted by 7 points 93, while the net operating income subindex remained unchanged at 79 points. The lifted turnover is mainly due to higher agricultural commodity prices and the expected decent harvest in field crops and horticulture.
The market share of the agribusiness’s subindex fell by 5 points from the first quarter of 2022 to 71. The agribusinesses in horticulture, agricultural machinery and financial services were among the first respondents who signalled weaker expectations. However, most of the respondents maintained a broadly unchanged view from the previous quarter.
The employment subindex confidence increased by 5 points from the first quarter of 2022 to 73 in Q2 2022. This is unsurprising as the second quarter of the year is relatively busy with the harvesting of both summer crops and various horticulture products.
Confidence in the capital investments subindex increased with 6 points which is a pleasant surprise compared to the first quarter’s decrease of 13 points. It currently stands at 73 points. These are encouraging results at a time when farm input costs are rising and adding pressure on farmers and agribusinesses. An important signal of this activity is the tractor and combine harvester sales, which have remained positive for the first five months of this year. This comes on the back of two years of already solid sales growth.
The subindex measuring the volume of exports sentiment declined by 6 points from the first quarter to 71. This is reflects the expected decline in summer crop and wine grape harvests, as well as the temporary stoppage of livestock product exports because of the outbreak of foot-and-mouth disease. That said, a level of 71 still indicates robust export conditions.
Confidence in the general economic conditions fell by 5 points to 43. This reflects the uncertainty in the current geopolitical environment, inflation concerns, a general slowdown in the global economy, and more domestic events such as load-shedding, amongst other factors.
The general agricultural conditions subindex fell by 6 points to 54 in the year’s second quarter. The continued rains that slightly delayed the summer crop harvest might have influenced the respondents’ views here, along with delayed rains in the Western Cape for winter crops. Nevertheless, this subindex is still well above the 50-neutral mark, which shows that the sentiment about agricultural conditions in the country is broadly positive.
The debtor provision for bad debt and financing costs subindices are interpreted differently from the abovementioned indices. A decline is viewed as a favourable development, while an uptick is not a desirable outcome as it indicates that agribusinesses are financially constrained. In Q2 2022, the indices for debtor provisions for bad debt and financing costs fell by 2 and 14 points to 43 and 4, respectively. This is broadly favourable and reflects the tail end of the farmers’ financial gains of the last two robust seasons, which enabled them to service their debts. Still, the rising input costs and expected interest rate increases are aspects that most respondents flagged as crucial concerns.
In conclusion, Wandile Sihlobo, chief economist at Agbiz, said that the second-quarter results present a picture of a sector that is still on solid footing, but we still face numerous risks. The issues which are most concerning right now are the rising fuel, fertiliser and agrochemicals costs, which will pressure farmers and agribusinesses in the coming months. The ongoing war between Russia and Ukraine and the disruptions this has caused on some of our key fruit export markets and supply chains are also a major concern for the sector. However, some of our long-term challenges are within our reach as South Africans. These include the need to improve the efficiency of ports, electricity supply and water, quality of roads, curbing crime that devastates the rail network, and improving biosecurity. Addressing these aspects would have a far more positive impact on the long-term growth of this sector and, subsequently, job creation.
Source: www.agbiz.co.za, Issued by Wandile Sihlobo, chief economist: Agbiz
Weather and climate
Below-average sea surface temperatures (SSTs) continued during early June 2022. In summary, a La Niña is favoured to continue through the end of the year, the odds for La Niña decrease into the Northern Hemisphere late summer (52% chance in July to September 2022) before slightly increasing through the Northern Hemisphere fall and early winter 2022 (58% to 59%).
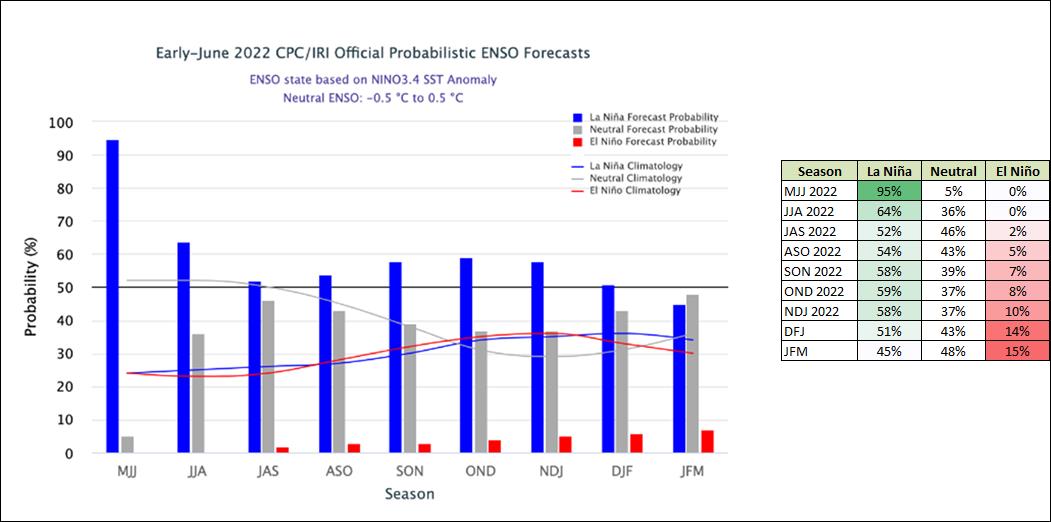
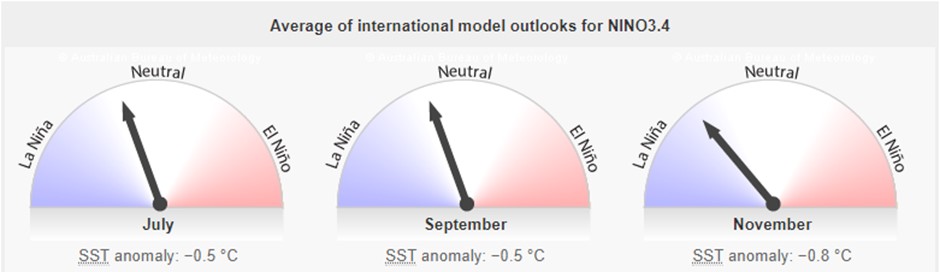
The 2021/2022 La Niña continues to weaken with the latest observations and outlooks indicating a return to neutral-ENSO by July. All but one of the surveyed models predict neutral, but cooler than average, temperatures in the central tropical Pacific throughout the southern winter.
Market risk
GRAIN MARKET ANALYSIS
- Ending stock – national
Ending stock data is gathered from the NAMC. The estimates are reassessed and reported by the Grain and Oilseeds Supply and Demand Estimates Committee. The following is a summary of the April 2022 projected final endig stock for the 2021/2022 season in tonnages:
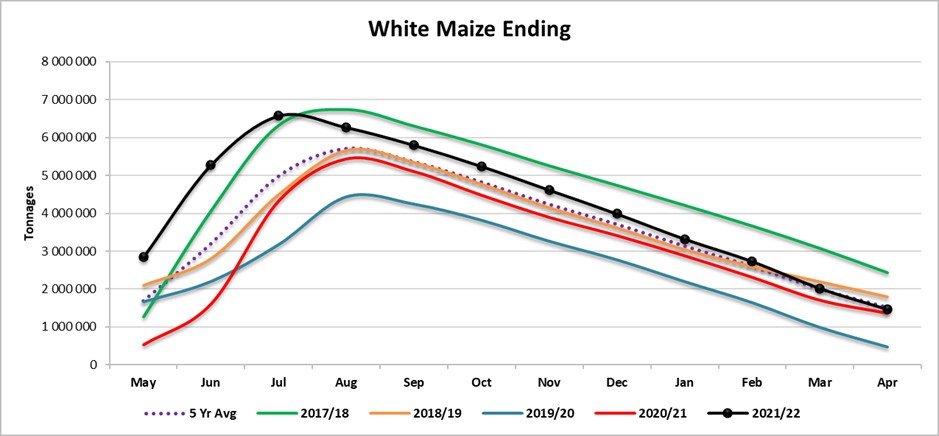
- White maize => 1 463 558 t
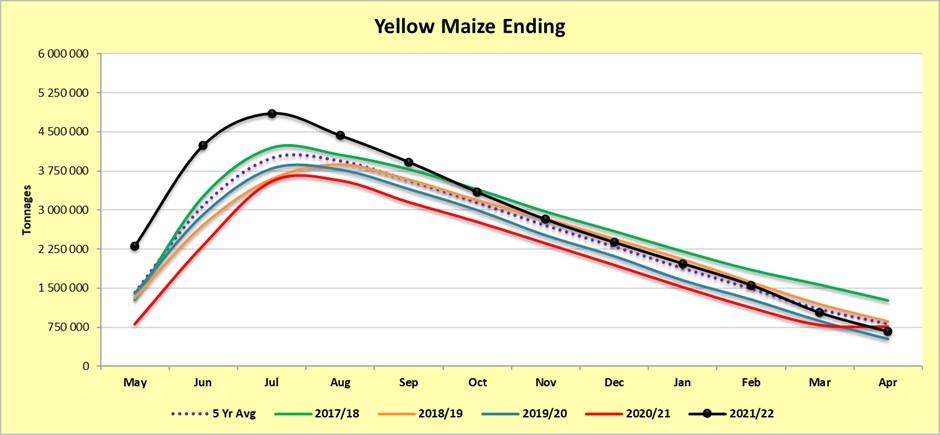
- Yellow maize => 662 890 t
The following is a summary of September 2022 ending stock estimates for the 2021/2022 season:
- Wheat = 620 304 t
The following is a summary of the estimated ending stock figures for the 2022/2023 season ending February 2023:
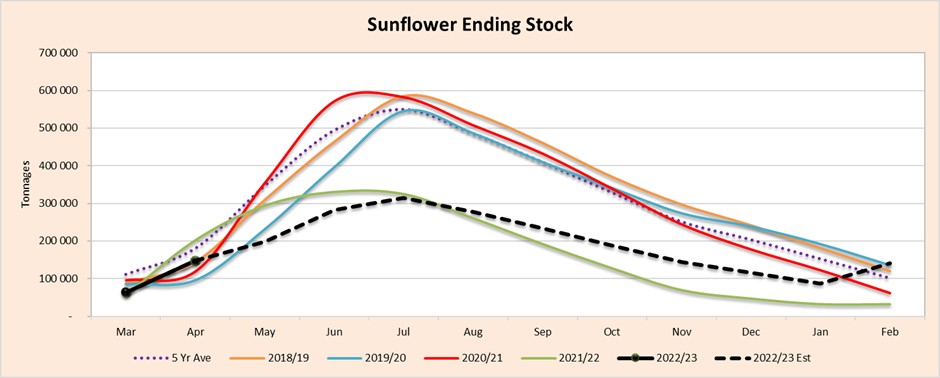
- Sunflower => 140 750 t
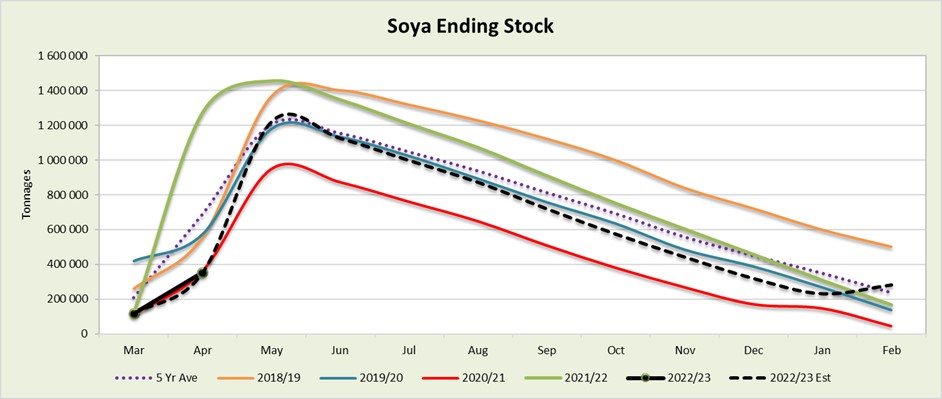
- Soybeans => 282 687 t
- Sorghum => 88 472 t
Graph 2 shows the final ending stock for white maize in April 2022, which is 108 605 tons or 8% more than the 2020/2021 season. Graph 3 shows a 99 063 ton or 13% decrease in ending stock compared to the previous season.
Source: Sagis
Source: Sagis
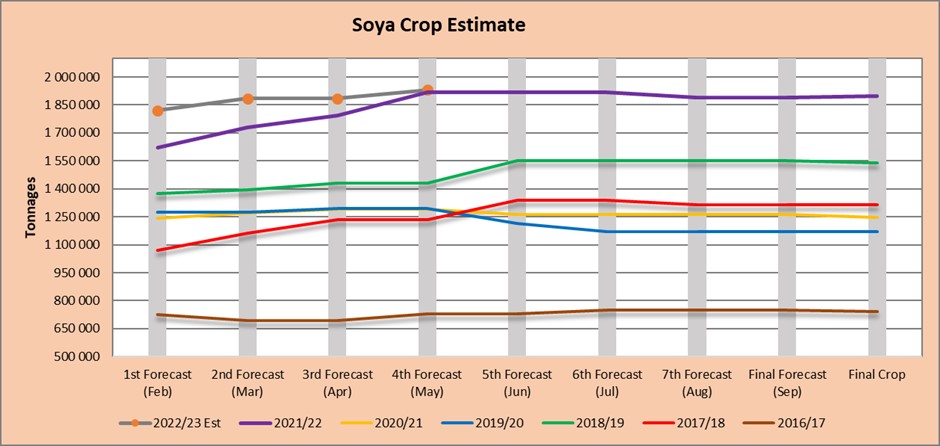
The estimated soya ending stock for February 2022 is 68% (114 300 tons) more than February 2022 – (Graph 4).
Source: Sagis
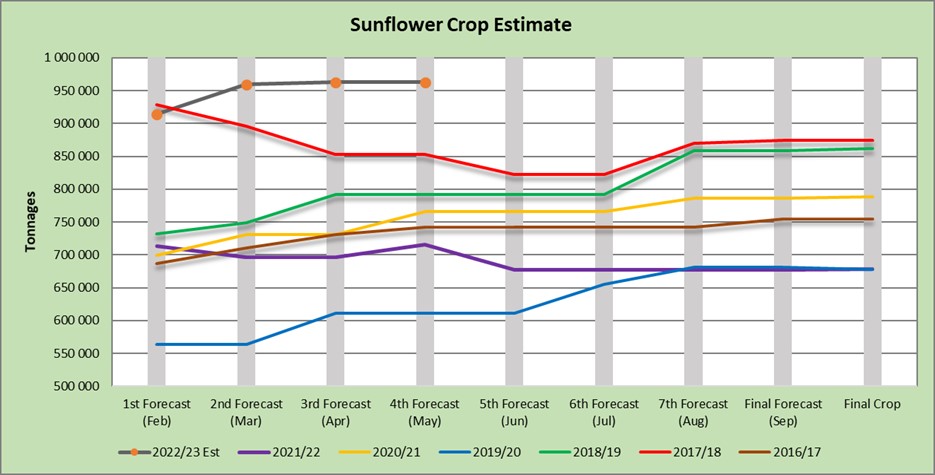
The estimated sunflower ending stock is 343% (108 964 t) more than the previous season’s ending stock (Graph 5). The sharp rise in the forecasting after January could mean that the actual ending stock could be less than what NAMC predicted, according to our forecasting.
Source: Sagis
- Crop estimations
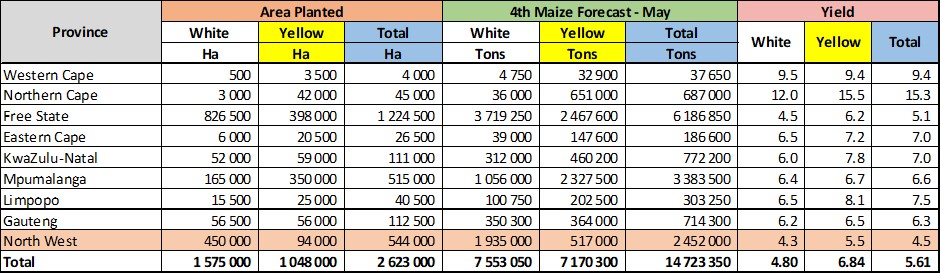
According to the Crop Estimate Committee’s (CEC) fourth forecast for 2022/2023 the size of the expected commercial maize crop has been set at 14,723 million tons, which is 9% less than the fourth forecast in 2021 of 16,180 million tons. The area estimate for maize is 2,623 million hectares, while the expected yield is 5,61 t/ha. According to the fourth maize forecast (Table 1) the three main maize producing areas – the Free State, Mpumalanga and North West – are expected to produce 82% of the 2022/2023 crop.
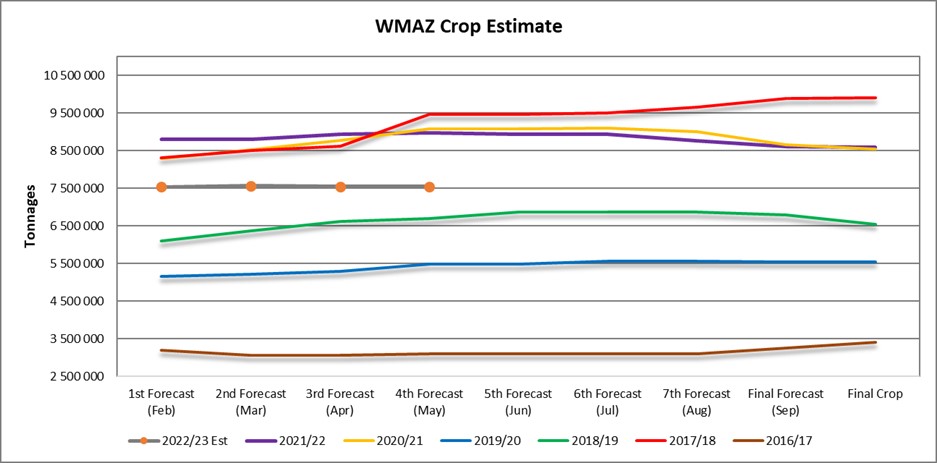
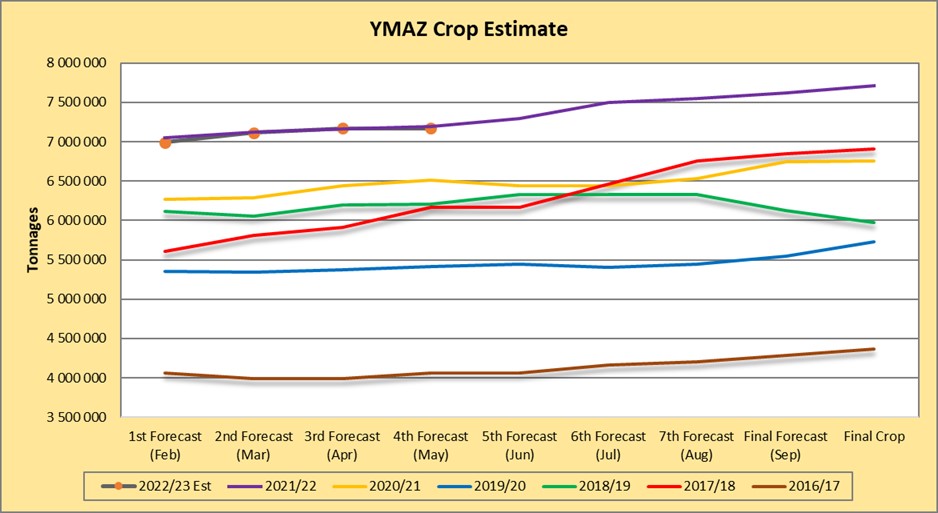
The area estimate for white maize (Graph 6) is 1,575 million hectares and for yellow maize the area estimate is 1,048 million hectares. The fourth production forecast of white maize is 7,553 million tons. The yield for white maize is 4,8 t/ha. In the case of yellow maize (Graph 7) the third production forecast is 7,170 million tons. The yield for yellow maize is 6,84 t/ha.
Source: CEC (Crop Estimates Committee)
The area estimate for white maize (Graph 6) is 1,575 million hectares and for yellow maize the area estimate is 1,048 million hectares. The fourth production forecast of white maize is 7,553 million tons. The yield for white maize is 4,8 t/ha. In the case of yellow maize (Graph 7) the third production forecast is 7,170 million tons. The yield for yellow maize is 6,84 t/ha.
Source: CEC
Source: CEC
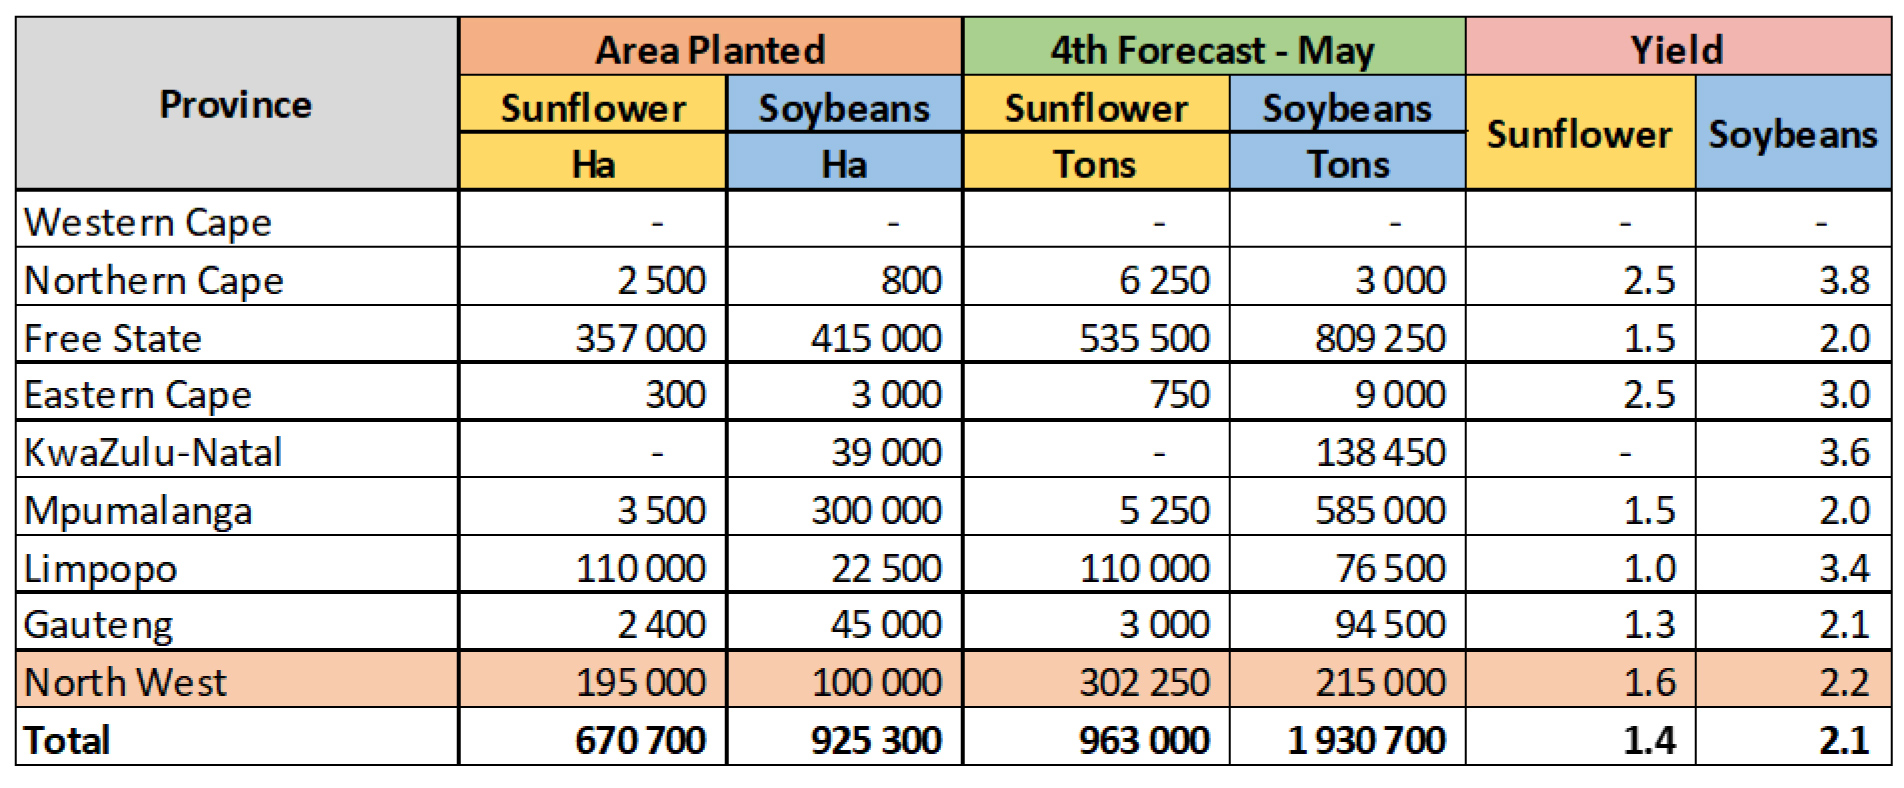
Table 2 shows the preliminary area estimate for sunflower seed which is 670 700 hectares – 40% or 192 900 hectares more than the 477 800 hectares planted the previous season. The production forecast for sunflower is 1,885 mills tons which is 42% more than the final crop of the previous season.
The production forecast for sunflower is 1,885 mills tons which is 42% more than the final crop of the previous season (Graph 8).
Source: CEC
It is estimated that 925 300 hectares have been planted to soybeans (Graph 9), which represents an increase of 12% or 98 200 hectares compared to the actual 827 100 hectares planted last season. This is the highest area planted to soybeans in the history of South Africa. The production forecast for soyabeans is 1,930 mills tons which is 2% more than the final crop of the previous season.
Source: CEC
- Imports and exports – national
Source: Sagis
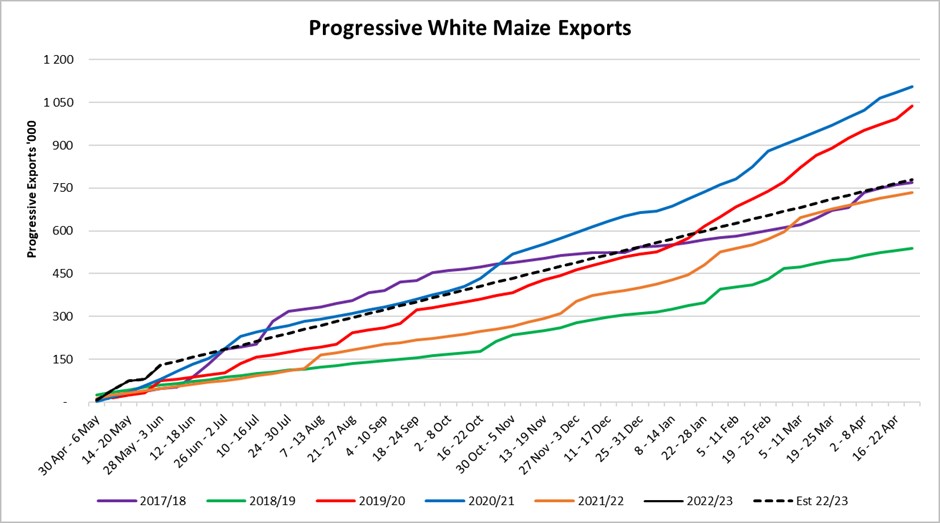
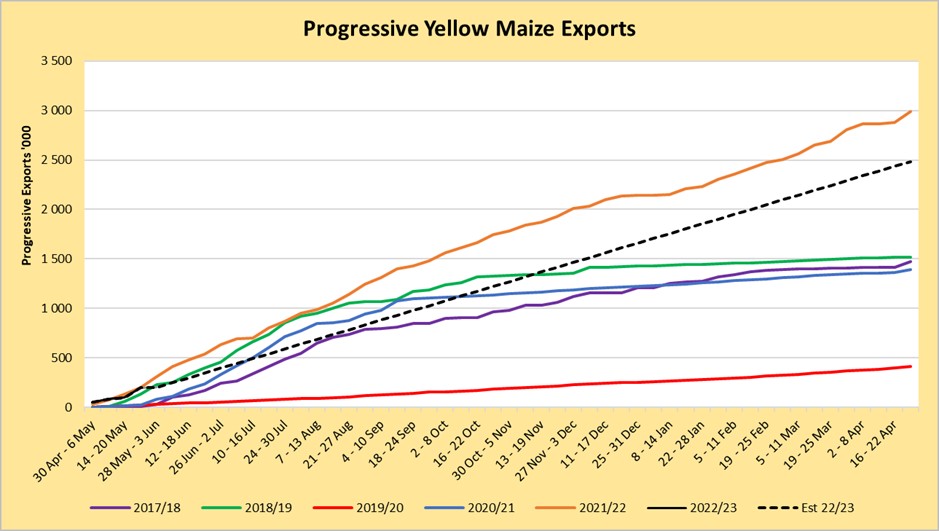
To date, 130 028 tons of white maize (Graph 10) and 200 482 tons of yellow maize (Graph 11) have been exported since the beginning of May 2022.
Source: Sagis
As seen in Table 3 the average white maize exports per week are currently 26 006 tons. If theoretically, white maize exports remain at the current average of 26 006 tons per week then there would be 572 291 tons more white maize exports than anticipated.
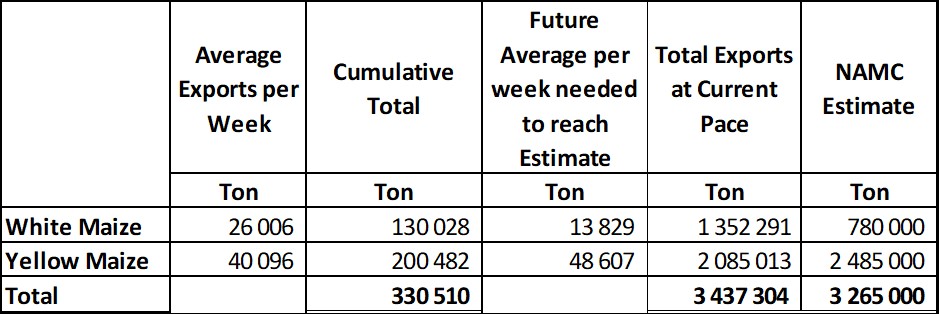
The average yellow maize exports per week are currently 40 096 tons. If theoretically, yellow maize exports remain at the current average of 40 096 tons per week then there would be 399 987 tons less yellow maize exports than anticipated.
- Parity prices
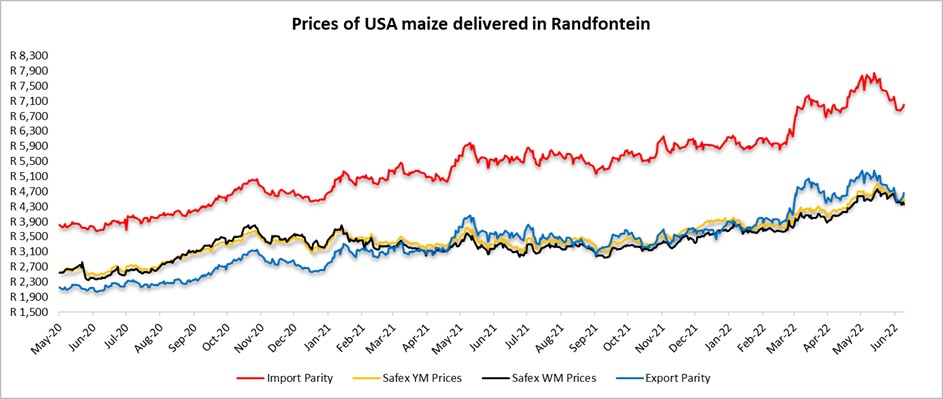
South Africa is a small producer compared to other countries and is thus a price taker (meaning that we cannot influence world prices). Because of this, our local prices are normally between import and export parity, which is illustrated in which is illustrated in Graph 12. An import parity price is defined as the price which a buyer will pay to buy the product on the world market. This price will include all the costs incurred to get the product delivered at the buyer’s destination.
An export parity price is defined as the price that a local seller could receive by selling his product on the world market for example, excluding the export costs. The price which the seller obtains is based on the condition that he delivers the product at the nearest export point (usually a harbour) at his own expense.
Source: Grain SA
- Producer deliveries – provincial
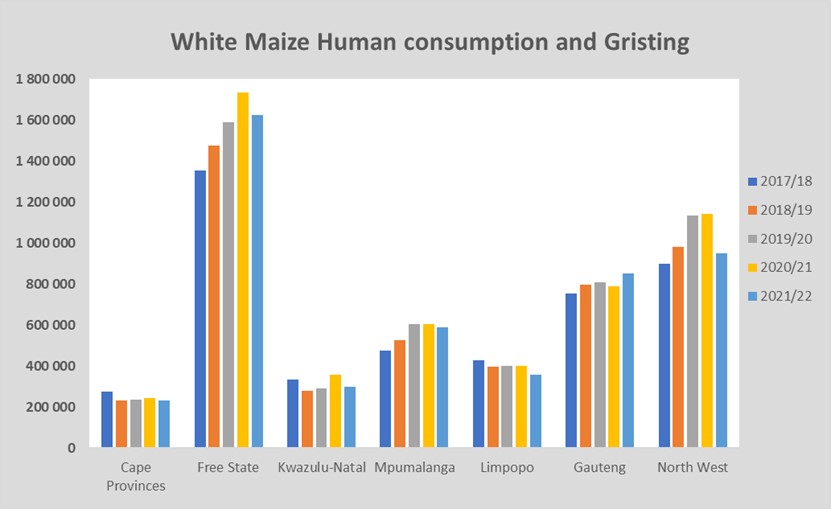
For the marketing year which is May to April the Free State dominates the white maize which is used for human consumption and gristing. North West showed a significant increase for the 2020/2021 season with 1% compared to the previous season (Graph 13), but for the 2021/2022 season it decreased again with 17%.
Source: Sagis
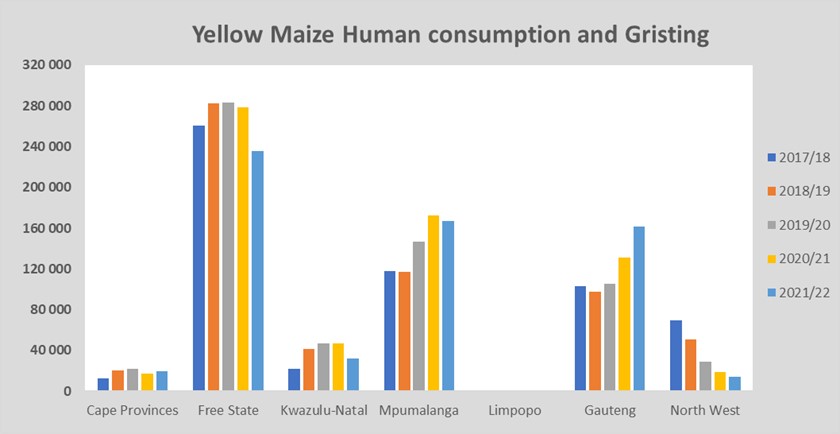
North West has a decreasing trend in yellow maize which is used for consumption and gristing. Only 14 450 tons of yellow maize was used in the 2021/2022 season that ended April 2021 (Graph 14). That is 22% less than in the 2020/2021 season.
Source: Sagis
- Exchange rate
NWK Group is exposed to foreign exchange rate risk on various business areas, such as commodity prices and trade imports.
On a monthly average basis, the rand depreciated against the US dollar with 6,15% (0,92c) over the period April 2022 to May 2022. The one-year average for rand/US dollar is 15,05. Moreover, the average rand/US dollar exchange rate for the period May 2022 was 15,90 compared to R14,98 in April 2022 (Graph 15).
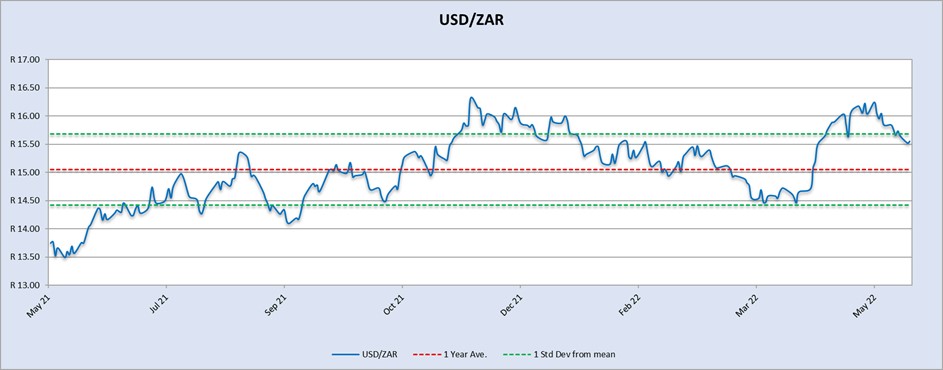
Source: Standard Bank, Corporate and Investment Banking & SARB
Exchange rate forecast:
Graph 16 shows the actual USD/ZAR for 2021 Quarter 4 (Q4) and 2022 Quarter 1 (Q1) against the forecasted figures. The Economy Forecast Trading’s exchange rate forecast for 2022 Q1 was the closest to the actual exchange rate. According to Nedbank and The Enonomy Forecast Agency and Trading Economics the rand will weaken in the year 2022.
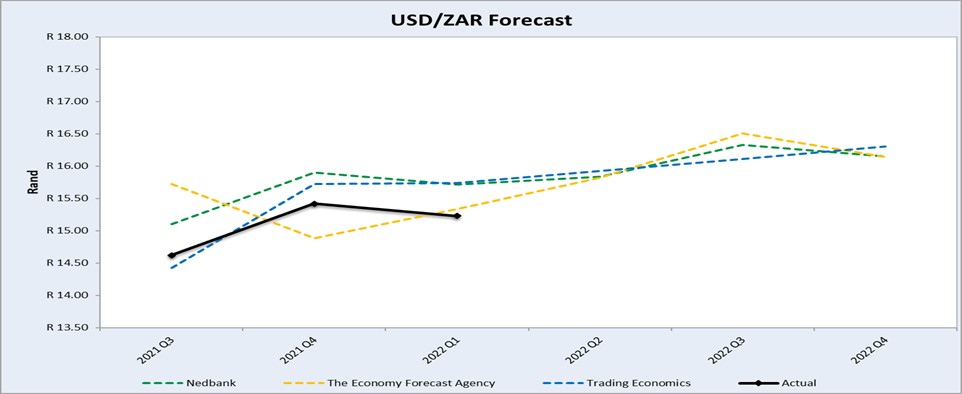
Source: Nedbank CIB; Absa; The Economic Forecast Agency; Trading Economics
- Highlights in the agrochemical sector
The COVID-19 pandemic affected the production and supply of the agrochemicals market. The global pandemic has impacted the proper functioning of the international agrochemical market. As countries are dependent on China for raw material supply, the restrictions imposed on transportation and imports across borders in various nations have resulted in shortages of raw materials. China is currently the largest glyphosate supplier in the world.
The dynamics of China’s glyphosate greatly impact the global supply structure, over 80% of glyphosate produced in China is exported, to more than 20 destinations in the world.
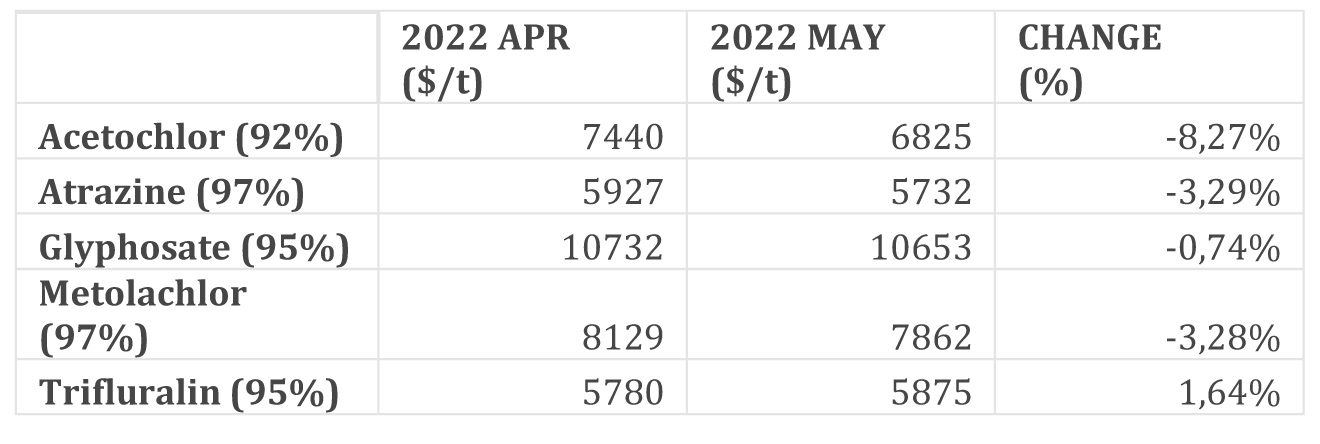
In China, on a month-to-month basis, prices (dollar terms) of most herbicides, insecticides and fungicides decreased from April 2022 to May 2022. According to the tables in this report, glyphosate (95%, dollar terms) decreased by 0,7% from April 2022 to May 2022 as the market demand for this product was rather weak. Although international prices decreased, the weakening of the rand/dollar exchange rate limited this decrease in rand terms.
Just ten days after lifting China’s two-month lockdown, it is said that China’s commercial hub of Shanghai will again lock down millions of people for mass COVID-19 testing.
Analysts, in general, predict pesticide shortages and price spikes are here to stay in 2022.
Source: GrainSA: https://www.dtnpf.com/agriculture/web/ag/crops/article/2022/02/08/pesticide-shortages-high-prices-ease.
Herbicides
The following products are the main products regarding herbicides that may have an impact on input costs for producers:
- Glyphosate (95%)
- Acetochlor (92%)
- Atrazine (97%)
- Metolachlor (97%)
- Trifluralin (95%)
The following comparison is from the June 2022 Grain SA report which reports the previous month’s prices (Table 4 and 5).
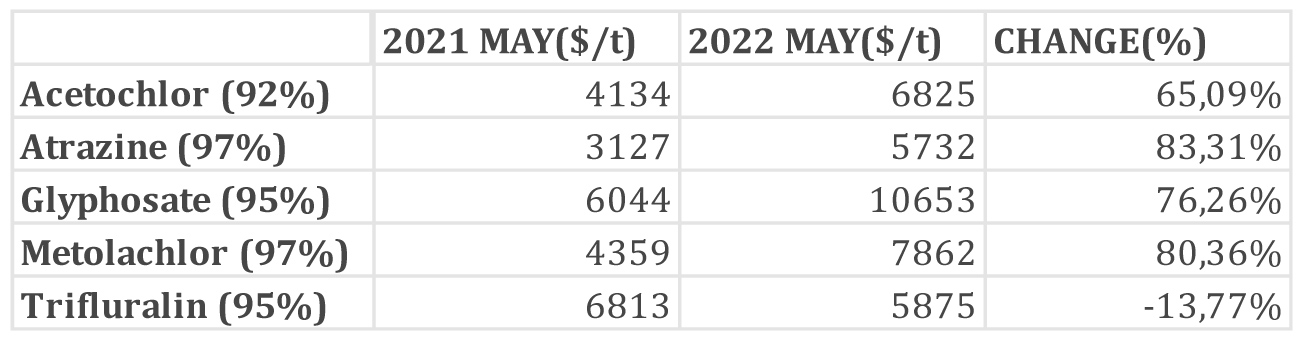
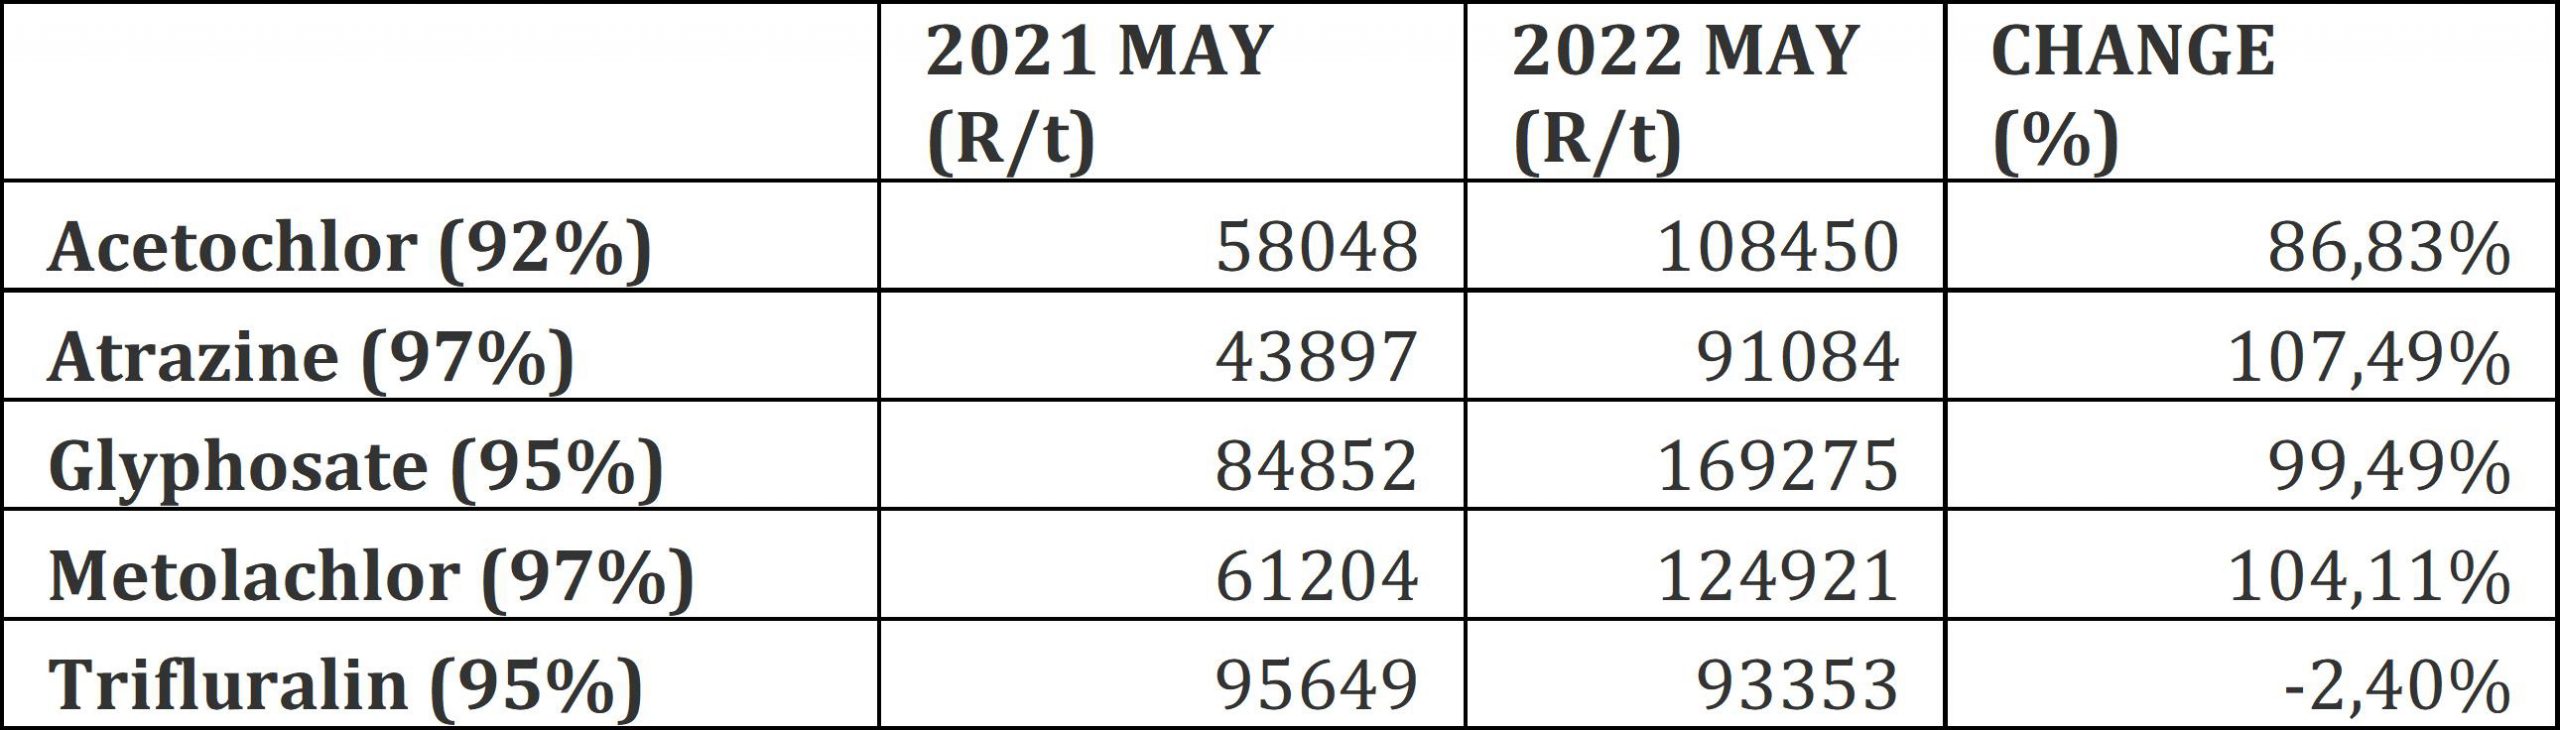
Year to year change (R/t): In comparison with the previous year’s prices, there was a significant increase in prices in four of the five main products. From an increase of 86,83% in Metolachlor to an increase of 107,49% in Altrazine. The only product that had a price decrease was Trifluralin with a decrease of -2,40%.
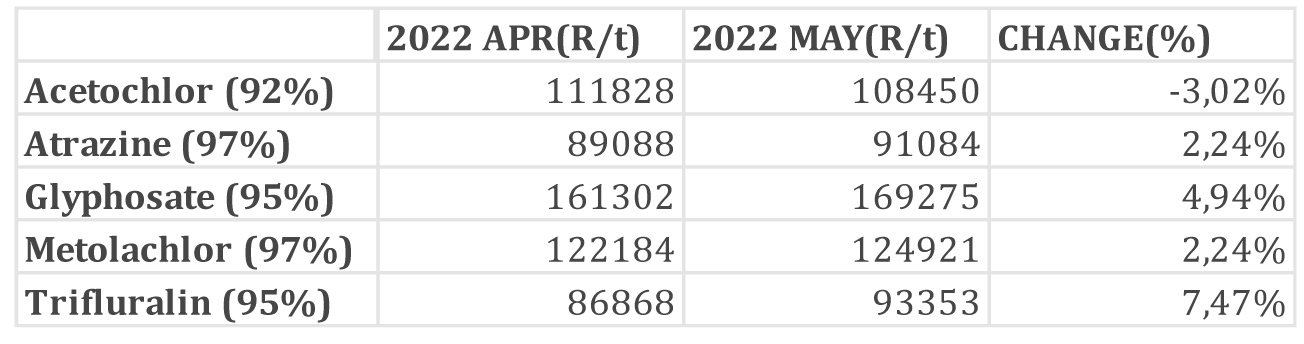
Herbicides – month to month change (R/t): From April 2022 to May 2022 there was a decrease in only one product. From April 2022 to May 2022 there was a decrease in only one product. Acetochlor has a decrease of 3,02% (Table 7). All the other products have increased from 2,24% (Atrazine) to 7,47% (Trifluralin).
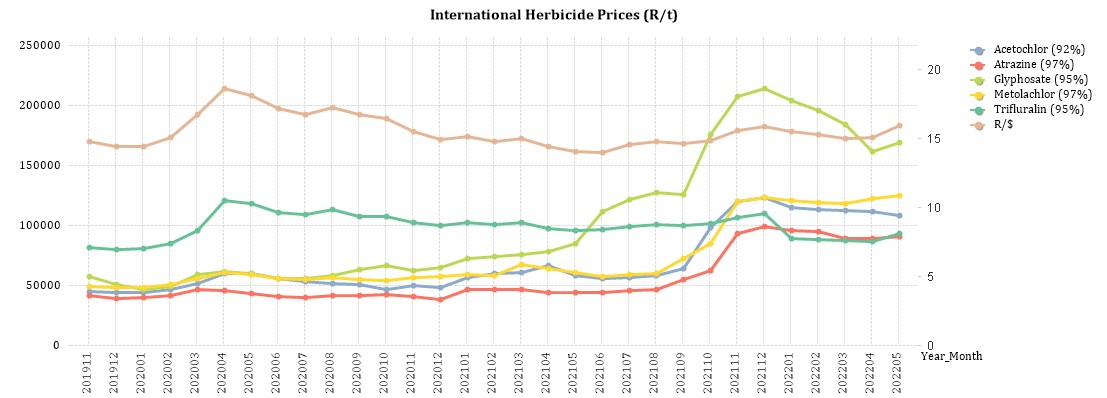
Graph 17 shows the international herbicides prices R/t per product from November 2019 up to May 2022.
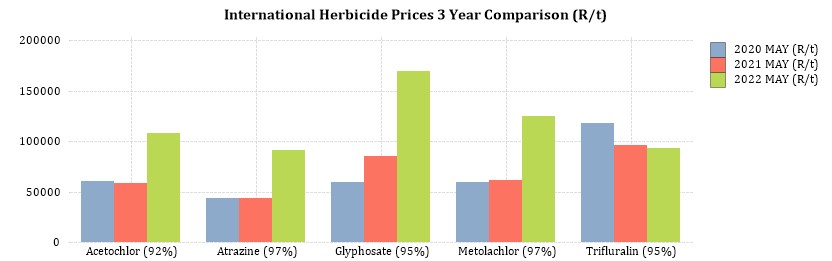
Graph 18 compares the international herbicides prices rand per ton per product from January 2020 to January 2022. The increase in the products can be seen here except Trifluralin which has decreased since 2021.
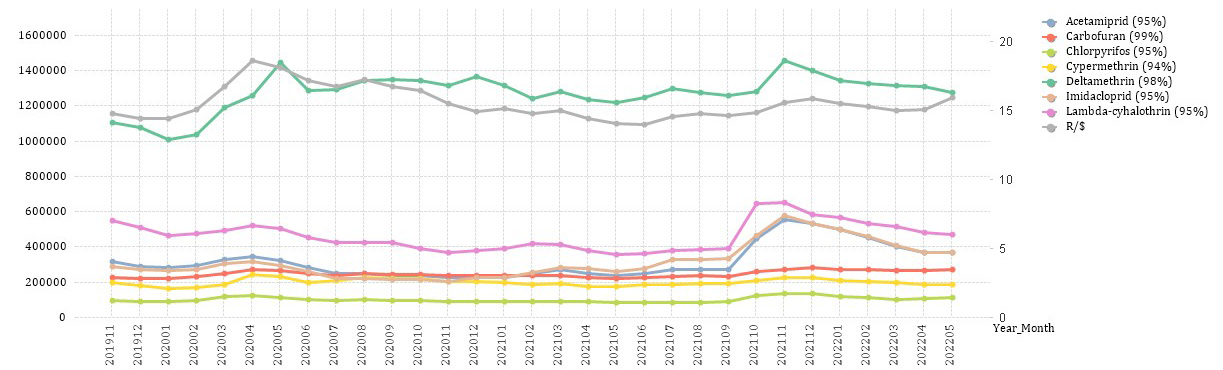
Insecticides
The following products are the main products regarding insecticides that may have an impact on input costs for producers.
- Imidacloprid (95%)
- Lambda-cyhalothrin (95%)
- Carbofuran (99%)
- Deltamethrin (98%)
- Acetamiprid (95%)
- Chlorpyrifos (95%)
- Cypermethrin (94%)
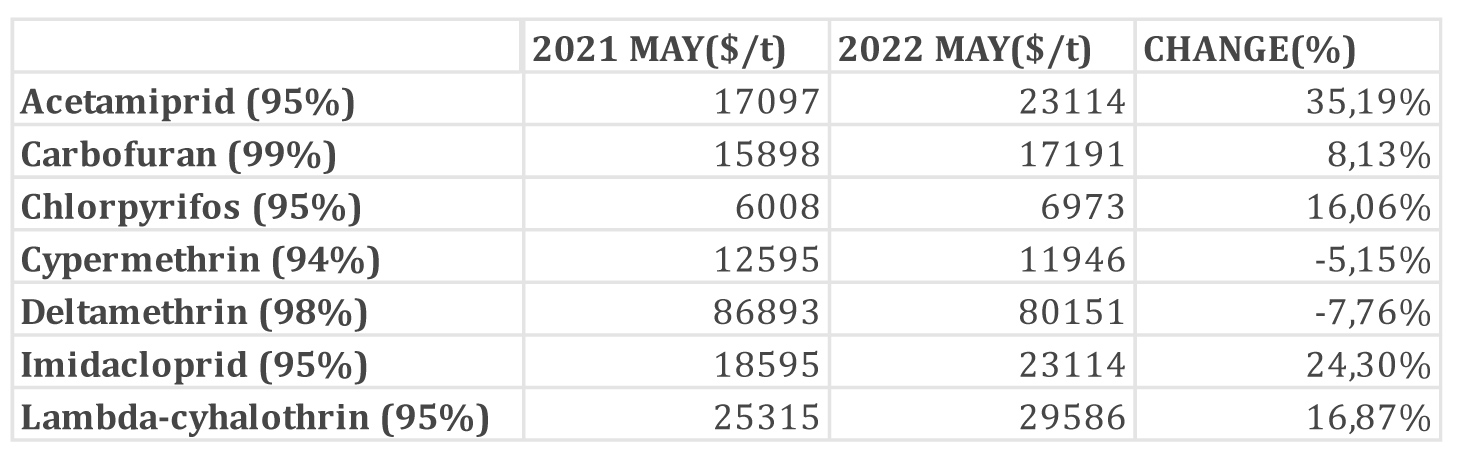
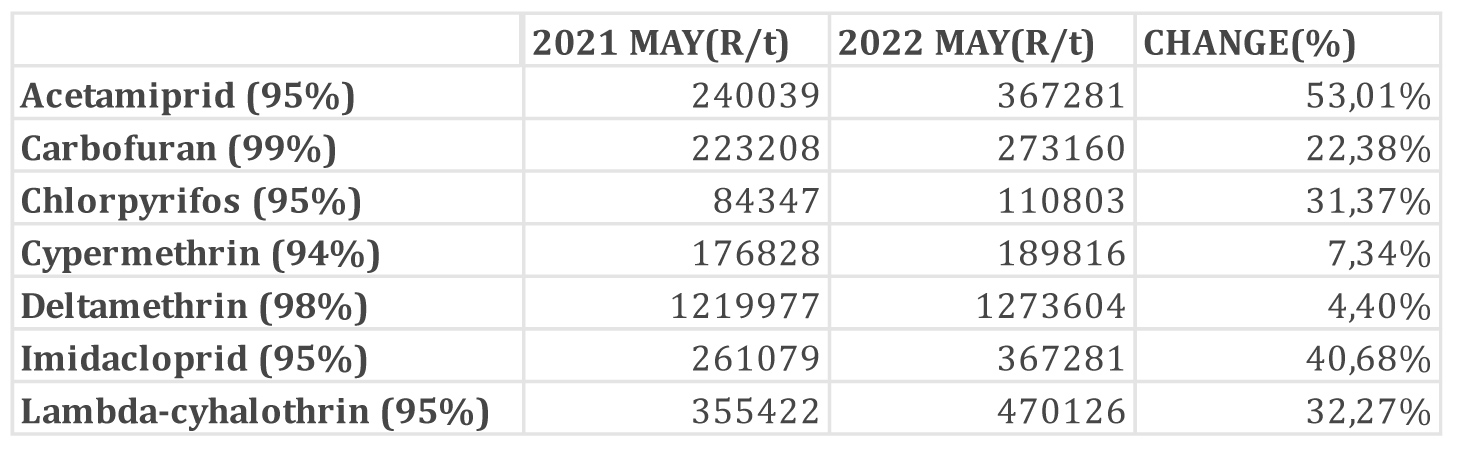
Insecticides – year to year change (R/t): In comparison with the previous year’s prices, there were noticeable increases in prices in four of the four main products. The largest increase was Acetamiprid with an increase of 53,01% (Table 9).
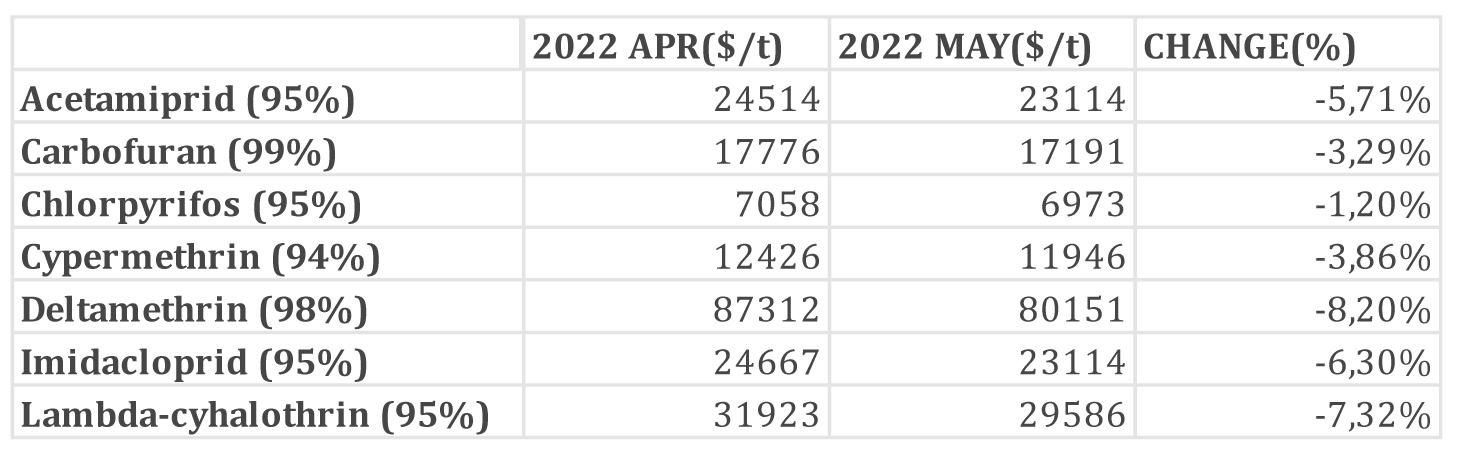
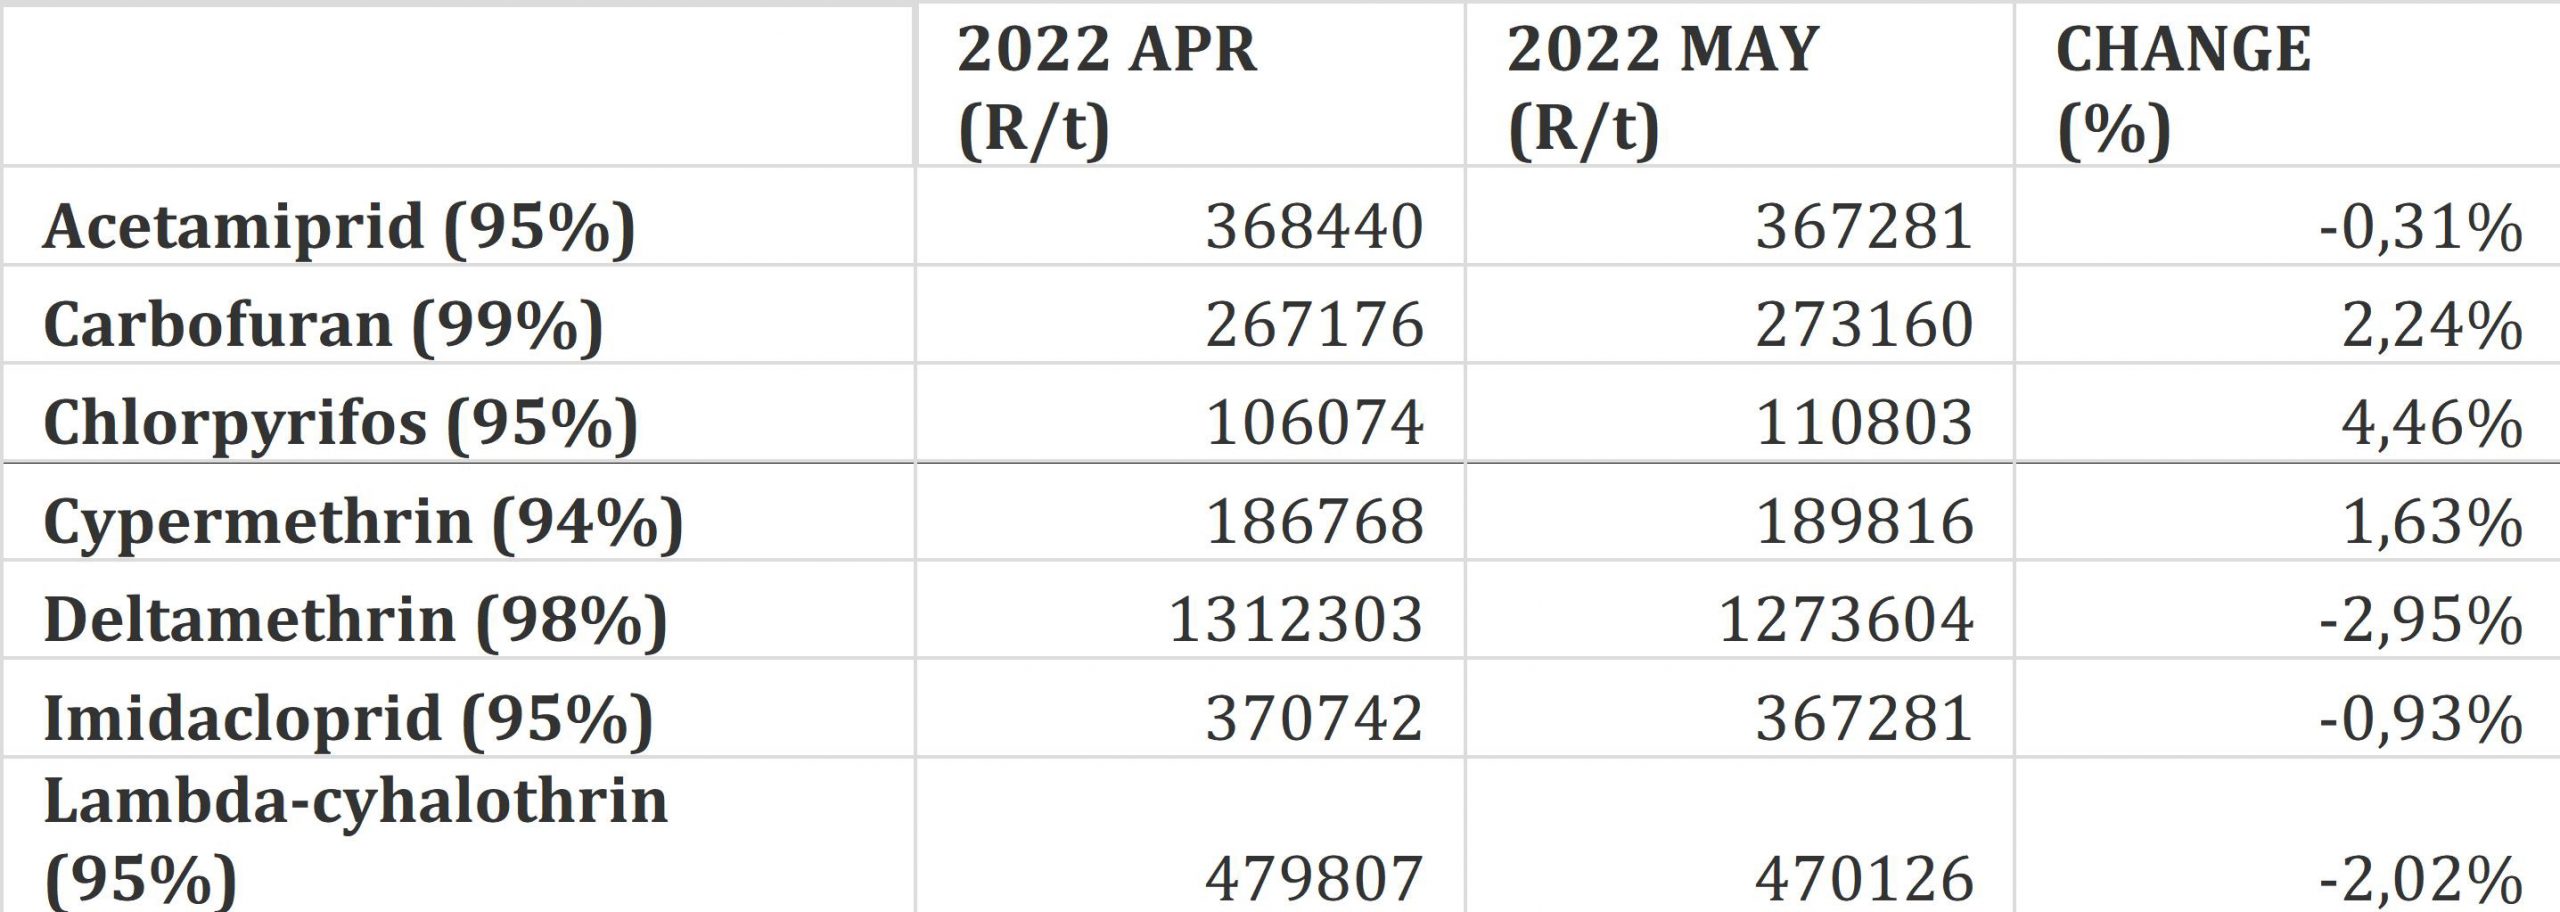
Insecticides – month to month change (R/t): There were no significant changes in the prices. The biggest increase was 4,46% for the product Chlorpyrifos (Table 11).
Graph 19 shows the international insecticide prices (R/t) per product from November 2019 to May 2022, while Graph 20 compares the international herbicides prices (R/t) per product from April 2020 to May 2022.

Fertiliser
The following fertiliser products are being analysed:
- Ammonia (Middle East)
- Urea (46%) (Eastern Europe)
- DAP (USA Gulf)
- KCL (CIS)
Nitrogen: Although nitrogen prices increased in the first few months of the year, the urea market has started to stall as there is widespread buyer resistance to the current high urea prices and with Q2 being a global quiet period.
Urea market: Urea prices continue to trend downwards as buyers expect further decreases and are delaying purchases. Rising Russian export volumes and no Indian tender is expected until mid-July which means prices remain under pressure as supply is exceeding demand. The annual IFA fertiliser industry conference took place the first week of June and there is a consensus that urea prices are headed downwards for another month or so.
Ammonium nitrate market (AN): Very little trading activity was seen in AN but the probability is that AN prices are set to fall as all other nitrogen products are declining. Ammonia market: Buyers are generally bearish about ammonia prices and prepare to wait for lower prices rather than commit at the current price level. The market sentiment is that ammonia is set to fall further.
Phosphates: The phosphate market was relatively quiet, and prices largely stable over the past few weeks. There is an increasing downwards pressure on prices which is mainly due to a continuing lack of demand and flow of Russian phosphates into the market. Phosphate prices do seem to have peaked and are moving downwards, particularly on a rand basis. However, the exchange rate effect is significant and further price declines in the international market (dollar price) need to be noted before it could be concluded that phosphates prices are heading downwards. Poor weather conditions in the US hampered phosphate application and high prices reportedly negatively impacted the demand for phosphates by 10% to 15%. Russian phosphate exports have been surprising the market with some major Russian phosphates players now reporting that their exports are back to normal volumes. While Russian volumes have been high, the price of Russian products has been heavily discounted below product prices from other origins.
The outlook for phosphates prices in general looks relative bearish for the next month Potash: Russian exports are proving to be greater than originally expected in light of US and European sanctions.
Belarus is also managing to export around 100 000 tons/month despite access to its normal export port in Lithuania being blocked. Brazil has been a key market of late and it is now reported that potash stocks are high and the pressure to buy is decreasing. Potash prices are expected to start declining if the flow of Russian potash continues.
There is a feeling that the initial reaction to the Russian invasion of Ukraine was panic and many markets bid prices up excessively to secure products, and now we are starting to see these prices unwind as the markets approach a new equilibrium. The Russian war is not over and potash supply disruptions are very possible, so further price spikes cannot be ruled out but it does appear that potash has peaked and prices will gradually trend downwards for the next few months.
General highlights
Russia’s exports of fertiliser are starting to find homes around the world, which will help boost global fertiliser supplies.
China should soon announce whether or not it will export fertiliser products. If they do start exporting global supplies will increase.
If the Russia-Ukraine war ends, Europe could increase its natural gas production, which would reduce supply and decrease production costs.
Source: F Curve Insight
Source: Agweb JounalStoneX Fertilizer Prices Have Dropped, Should You Book 2023 Needs? | AgWeb
Source: GrainSA
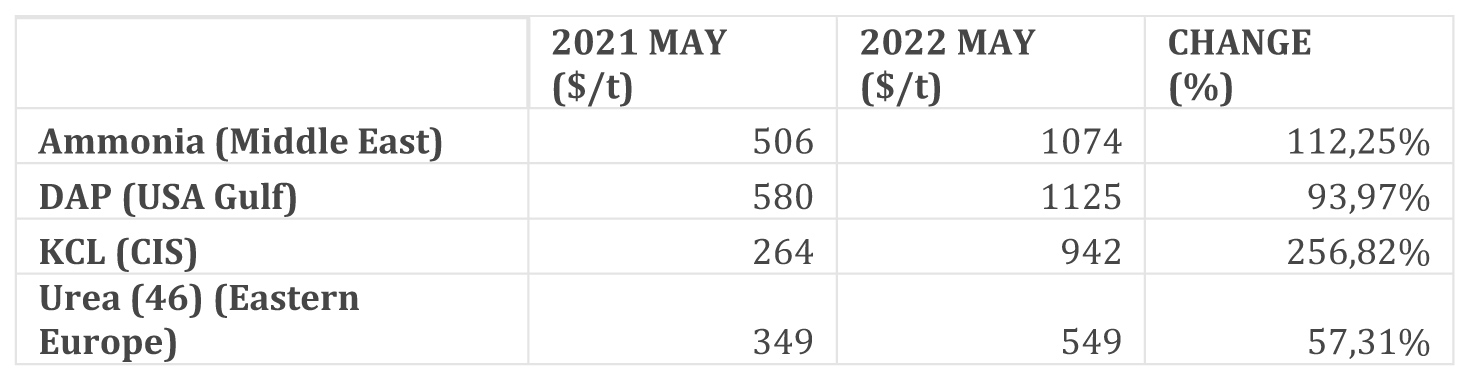
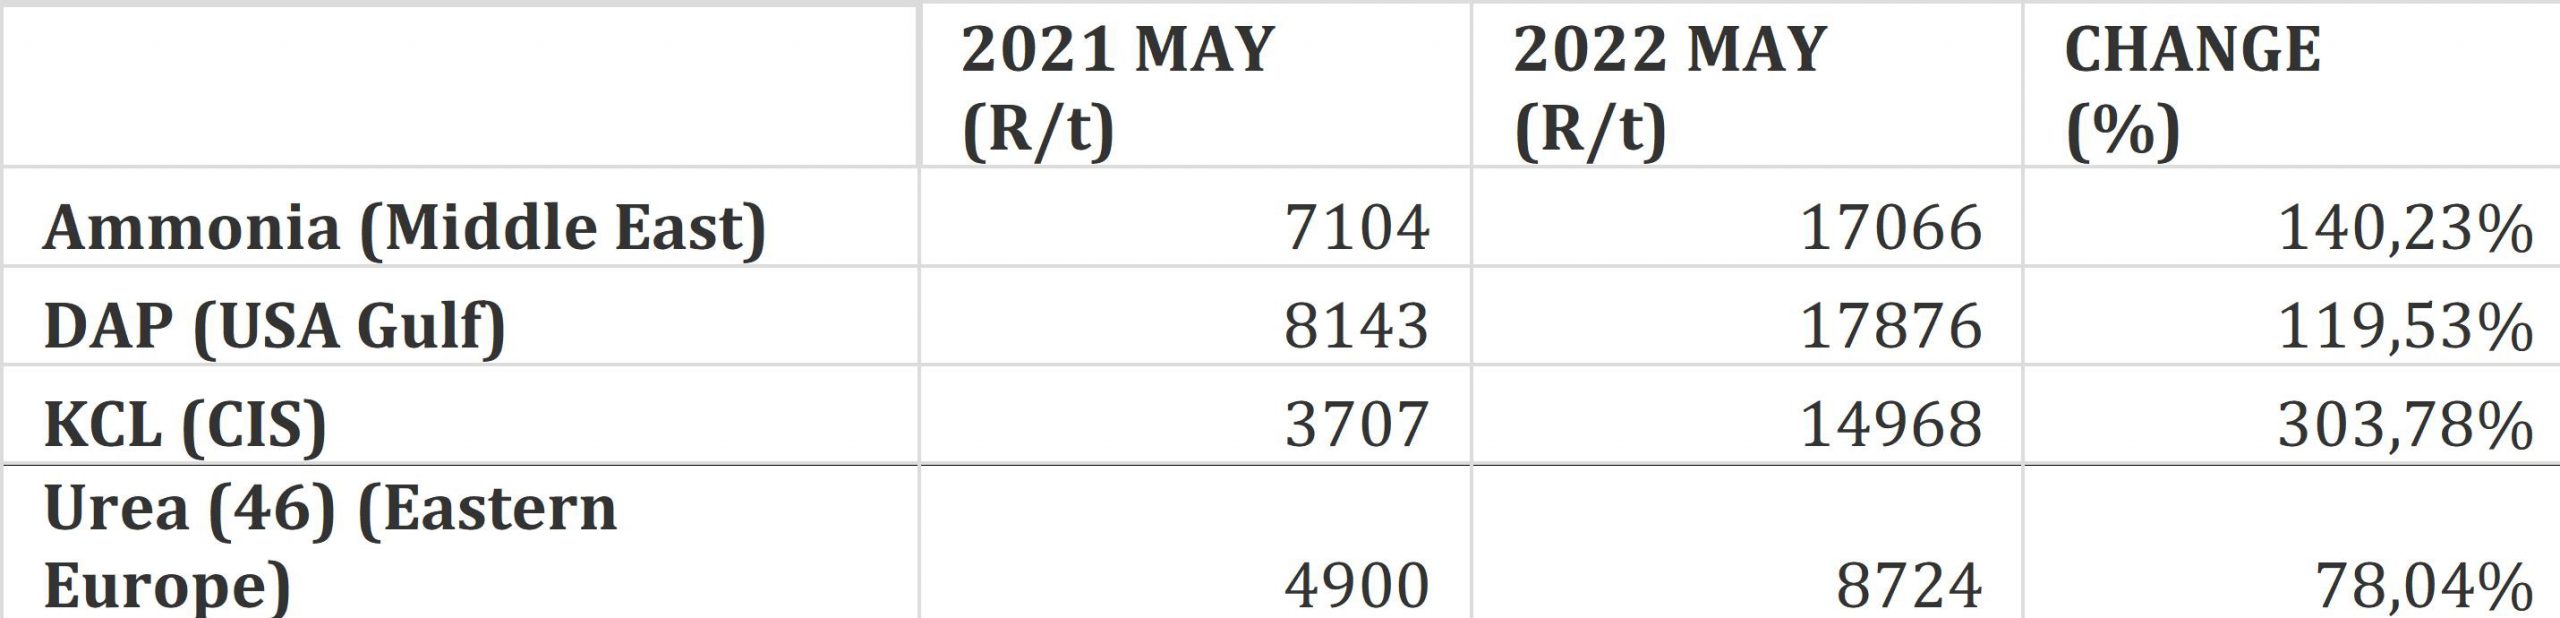
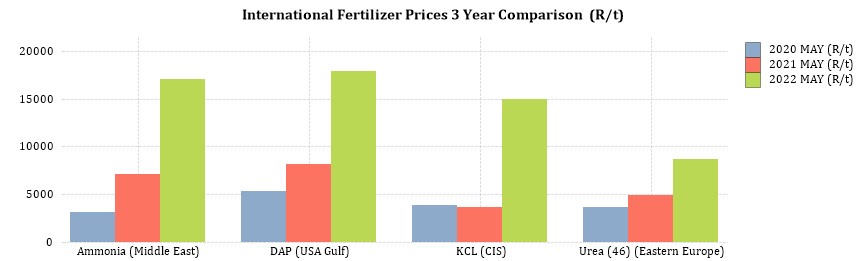
Fertiliser – year to year change (R/t): As seen in Table 13 all of the main fertiliser products increased significantly from May 2021 to May 2022. The biggest increase, based on average international prices R/t, was KCL (303,78%), followed by ammonia (140,23%), urea (78,04%) and DAP (119,53%).
The exchange rate differs 4,3 % from the previous year, meaning the increase in rand terms was also due to the exchange rate.
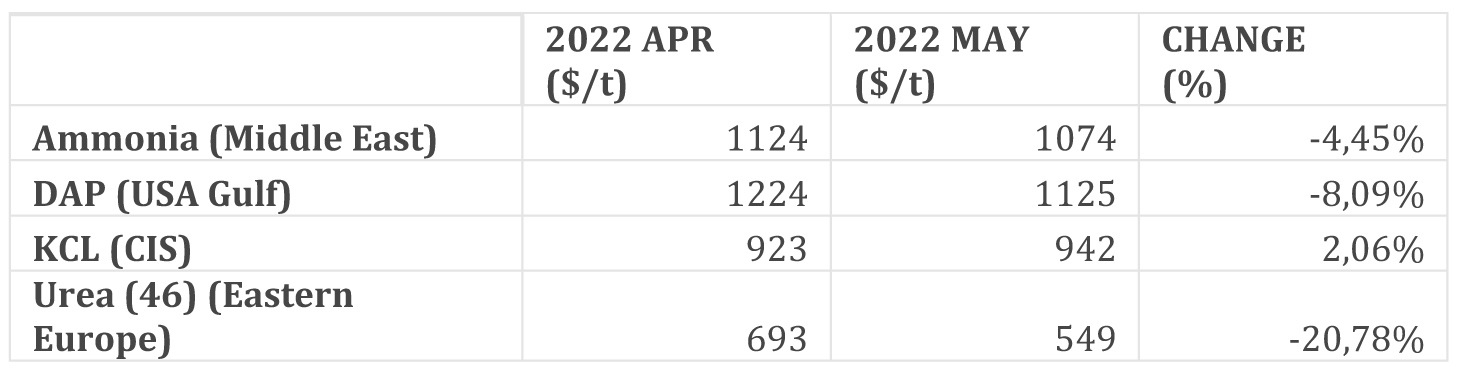
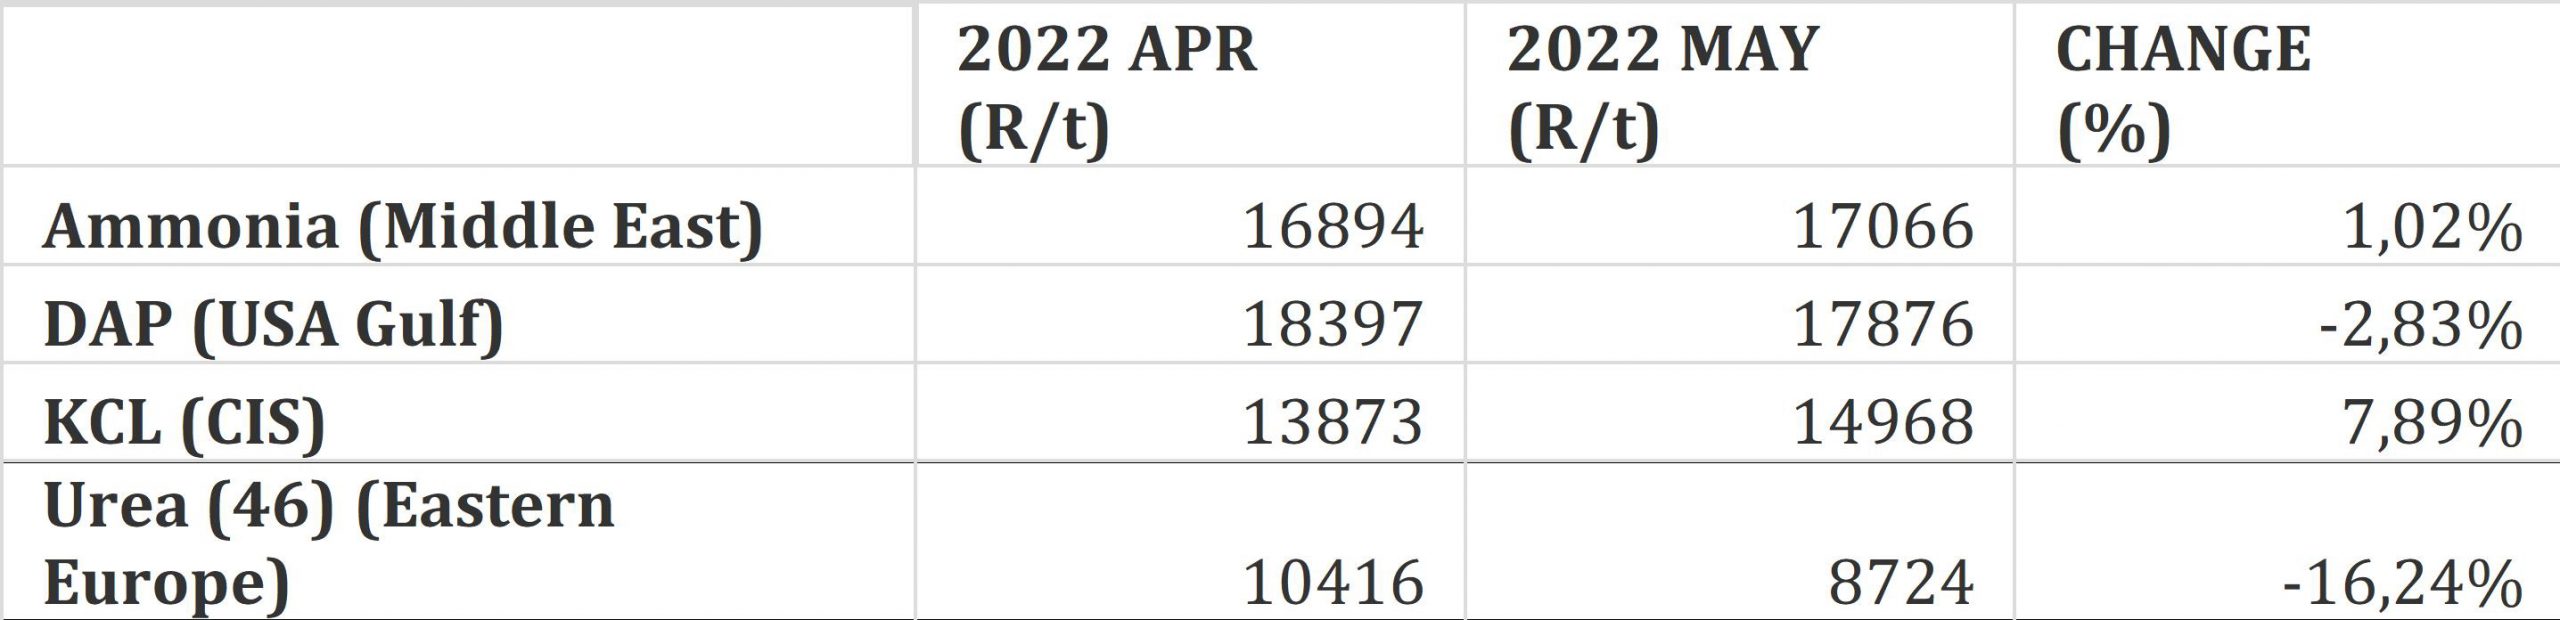
Fertiliser – month to month change (R/t): For the two months April 2022, there was an increase in the price of two products, ammonia increased by 1,02% and KCL by 7,89%. Urea and DAP have decreases of 16,24% and 2,83% respectively (Table 15).
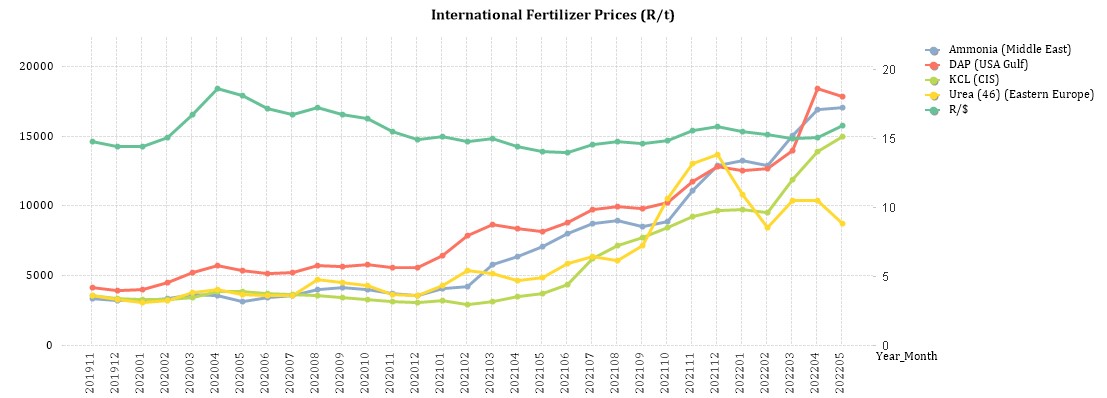
Graph 21 shows the international fertiliser prices (R/t) per product from November 2019 to May 2022 and on Graph 22 the significant increase in international fertiliser prices can be seen as of May 2022.
- Economic impact of the Russia-Ukraine war
Impact on the broader economy: Despite South Africa’s special role with Russia via the BRICs (Brazil, Russia, India, China, and South Africa) grouping of middle-income countries, the South African government took a stronger stance, calling for Russia to withdraw its forces.
The invasion of Ukraine by Russia has a ripple effect on the world economy. Various countries will feel the short and long term effects of this war. Not all is however negative as a few possibilities arise in the short term.
For one, Ukraine is the biggest exporter of sunflower oil followed by Russia. Russia also ranks first in the world for holding 24% of the world’s total natural gas reserves. Europe receives 30% to 40% of its total gas from Russia and it is going to be difficult to wean itself from Russia to loosen Vladimir Putin’s grip on European countries. Evidentially the price of sunflower oil and natural gasses increased as exports from Russia and Ukraine are backed-up. Brent crude oil recently reached $130 per barrel and analysts predict even further increases. European natural gas also jumped 62%. Despite this several other countries who are also suppliers of sunflower oil and natural gasses may benefit from this war as countries will have to look elsewhere for their usual imported resources.
International sanctions placed on Russia could place a growing demand on palladium as Russia is the world’s biggest producer of palladium with South Africa second. Palladium is a critical component in the manufacturing of automobiles and electronics. Similarly, Russia and South Africa are major exporters of gold and the South African rand has been strengthening as a result of rising global prices for the precious metal.
Despite these possibilities the attack on Ukraine could pose hardships for households, the agricultural sector and food security. The rising price of oil is causing fuel prices to increase and consequently lead to transport being a luxury. In fact, South Africa’s automobile association (SAA) predicts record-high fuel prices for March. On 6 March City Press reported that fuel prices may even hit R40/litre. Ridiculously high fuel prices and fertiliser prices (see Highlights in the agrochemical sector) will shake the economy and consumers hard.
Source: Business Tech
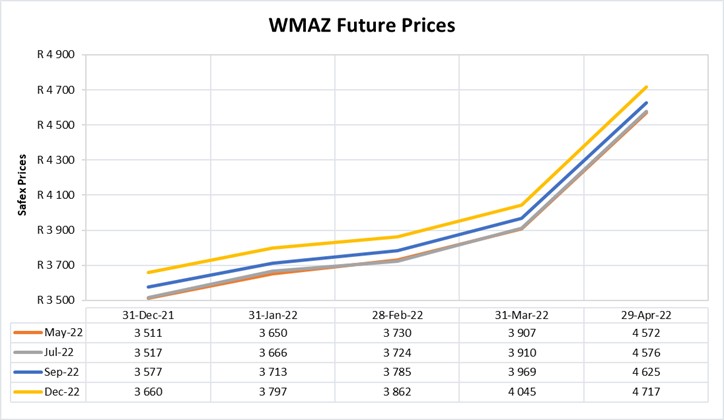
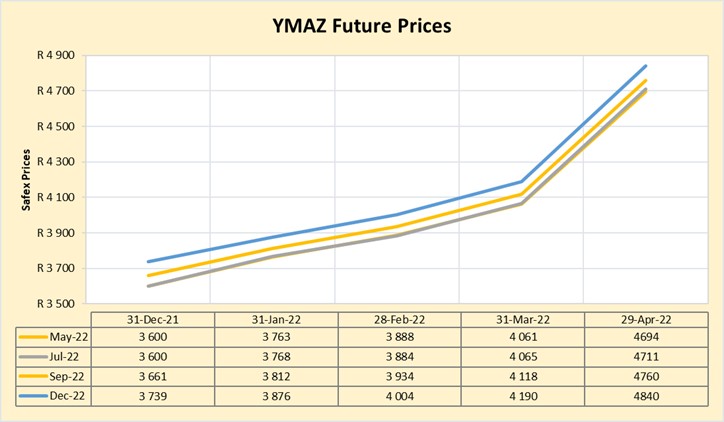
- Future prices
Graphs 23 and 24 illustrate the market sentiment for maize, in the form of future contracts, for the upcoming contract months. The market sentiment is the expectation of supply and demand fundamentals relating to white and yellow maize in South Africa.
Source: Sagis
Source: Sagis
INTEREST RATE RISK
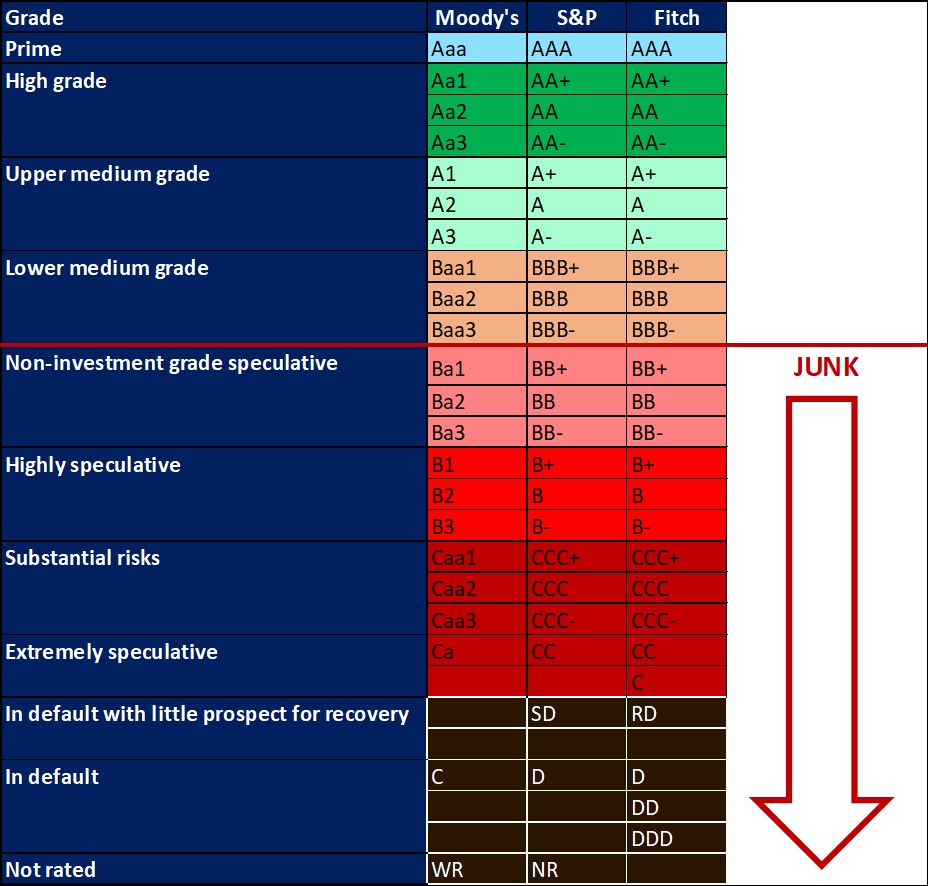
On 27 March 2020, Moody’s downgraded South Africa’s sovereign credit rating to sub-investment grade and placed a negative outlook on the rating. The key drivers for this downgrade include weak economic growth, continuing deterioration in fiscal strength, and slow progress on structural economic reforms. It is now the first time in post-apartheid South Africa where all major rating agencies, that is, Moody’s, Fitch and S&P, have South Africa’s credit ratings in sub-investment grade territory.
The COVID-19 pandemic forced the South African Reserve Bank to make a number of interest rate cuts to bring relief to the economy, but as from November 2021 the prime interest rate experienced four increases. This is the highest interest rate increase since the beginning of 2016. Interest rate movement:
-
- 20 March 2020: 8,75%
- 15 April 2020: 7,75%
- 22 May 2020: 7,25%
- 23 July 2020: 7,00%
- 18 November 2021: 7,25%
- 27 January 2022: 7,50%
- 24 March 2022: 7,75%
- 19 May 2022: 8,25%
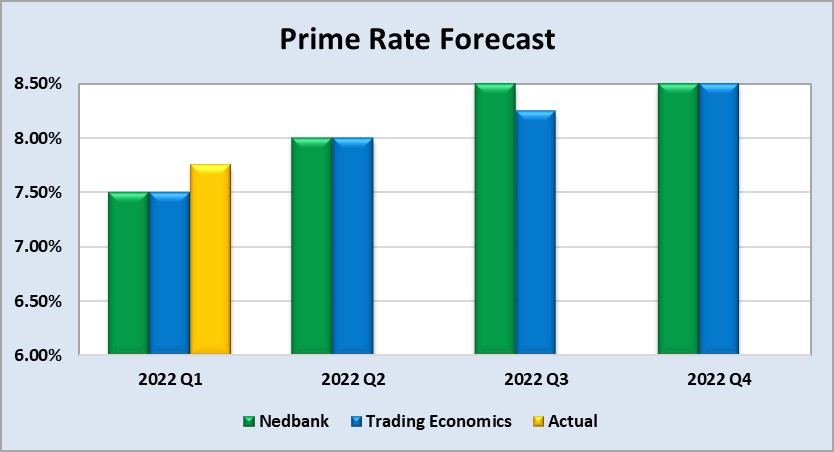
Graph 25 shows the prime rate forecast for 2022 Q1 to 2022 Q4. Nedbank as well as Trading Economics’ forecast that the prime interest rate will increase with 50 basis points for 2022 Q2. The forecast realised on 24 March 2022 when MPC increased the prime interest rate with a further 25 basis points. The next MPC meeting date was 19 May 2022.
Fraud risk
FRAUD AWARENESS
Sources of fraud can be internal and external. Internal fraud is usually in the form of employee theft such as lost inventory, unethical accounting practices and the theft of actual financial assets. Whereas, external fraud is much more wide-ranging. Customer fraud are actions such as paying with counterfeit bills, giving bad cheques and stolen credit cards. Computer hacking and information theft from outside sources are external fraud as well.
One method to prevent fraud in the company is to educate the employees and management on the possible fraud threats the company may face and encounter as well as how to treat such threats and how to prevent these threats. Precautionary measures such as regular password changes are important for personal and company security. Clear company fraud policies are needed to ensure that employees are aware of what constitutes fraudulent behaviour.
Employees may not realise that taking a few pens home or taking an unused laptop home are both considered fraudulent behaviour. This often happens when there is a strong culture of “borrowing” from the office in the workplace. Detailed and accurate record keeping is important as to know what money is coming in and what goes out as well as what suppliers are paid and what is actually delivered.
Background checks on new employees and suppliers are important. Reviewing references is a critical part of identifying potential fraudsters. Therefore, having whistle blowing measures in place which allows employees to anonymously report fraudulent behaviour are essential to control and eradicate fraud in the company. Lastly, despite all precautionary measures the company may still become a victim of fraud and having insurance will help cover some of the losses.


