
The NWK Limited external factors report provides an overview of the main external factors that NWK and its clients are exposed to at a specific point in time. This report opts to aid in a timely basis to foresee external market and other factors that may have an impact on any business and clients. The main focus of this document is to have a closer look at external factors that can affect any business and our customers.
Executive summary
External factors that can affect any business and its customers include various economic factors. This report will focus on monthly or quarterly changes of these economic factors.
The inflation rate decreased to 2,8% in October 2024, the lowest in three years. Retail trade increased to 0,9% in September 2024. The unemployment rate fell to 32,1% in the third quarter of 2024. The GDP growth for the third quarter contracted with 0,3%, following a revised 0,3% rise in Q2. The Policy Uncertainty Index although still in negative territory, eased substantially to 53,5 in Q3 2024 from 68,3 in Q2 2024.
An external factor that are of great concern to any agricultural business is the weather and climate outlooks. These factors include long term climate risks, such as drought and heat stress, as well as the current status of the El Niño and La Niña climate phenomenon. The El Niño Southern Oscillation (ENSO) is currently neutral however; some models show preference for a summer 2025 La Niña.
The National Agricultural Marketing Council (NAMC) projected the ending stock for 30 April 2025 of total maize to be less than the 2023/2024 season. The projected soya ending stock for February 2025 is 134 477 t, that is less than the final for the 2023/2024 season of 320 637 t. The projected sunflower ending stock for February 2025 is 45 894 t, that is less than the final for the 2023/2024 season of 127 144 t.
During the previous Monetary Policy Committee (MPC) meeting held on 21 November the committee once again decided that interest rates will remain unchanged. The repo rate is currently 7,75% and the prime rate 11,25%.
Business climate: Key risk drivers
According to Trading Economics, South Africa’s annual inflation rate decreased to 2,8% in October from 3,8% in September 2024. The inflation rate is expected to be 4,6% by the end of this quarter. In the long-term, the South Africa Inflation Rate is projected to trend around 4% in 2025 and 4,4% in 2026, according to Trading Economics.
Brent crude oil monthly average prices increased by $1,69 per barrel from September to October. The Iron ore prices decreased by $3,44 per metric ton on a monthly average from October to November.
South Africa’s retail trade climbed with 0,9% over a year ago in September 2024, following a upwardly revised 3,3% the prior month. According to Statistics SA, South Africa’s unemployment rate fell slightly to 32,1% in Q3.
The GDP growth rate decreased by 0,3% in the third quarter in 2024. Four of the ten industries experienced a decrease. The Finance industry was the largest positive contributor, increasing by 1,3%.
The Safex maize prices traded at new highs in November, with Safex white maize prices breaching the R6 000 per ton mark in mid-November. Safex white maize prices have increased by 9,2% and yellow maize by 8,1% compared to a month ago. Local production prospects for 2024/25 improved as most production areas received some rainfall over the past weeks.
Adverse weather patterns can reduce yields and also affect the Safex price (high regional demand poses an upside price risk). The El Niño–Southern Oscillation (ENSO) is currently in a neutral phase and is expected to remain neutral until the end of 2024. The Bureau’s ENSO Outlook is at La Niña Watch due to early signs that an event may form in the Pacific Ocean later in 2024. From October 2022 to November 2024 the actual sunspot numbers were higher than the predicted values.
The Policy Uncertainty Index although still in negative territory, eased substantially to 53,5 in Q3 from 68,3 in Q2 2024. In addition to the well-known global risks and uncertainties the 2024 election outcome also weighed on investors and the markets. The PUI is the net outcome of positive and negative factors influencing the calibration of policy uncertainty over the relevant period. It is seen to have important implications for business confidence and the investment climate in the country.
Sources
https://tradingeconomics.com/south-africa/inflation-cpi
https://tradingeconomics.com/commodity/brent-crude-oil
https://tradingeconomics.com/south-africa/unemployment-rate
https://www.statssa.gov.za/?page_id=737&id=1
https://tradingeconomics.com/south-africa/gdp-growth
https://agrink.co.za/downloads/ABSA%20Agri%20Trends%20Grains%20and%20Veggies.pdf
https://tradingeconomics.com/commodity/iron-ore
PUI_2024Q3.pdf
Agribusiness Confidence Index (ACI), Q3 2024
The Agricultural Business Chamber (Agbiz) conducts a quarterly survey to compile the Agribusiness Confidence Index (ACI), reflecting the views of at least 25 decision-makers in the agricultural sector. Released on June 24, 2024, the latest index evaluates ten critical factors impacting agribusiness: turnover, net operating income, market share, employment, capital investment, export volumes, economic growth, general agricultural conditions, debtor provisions for bad debt, and financing costs.
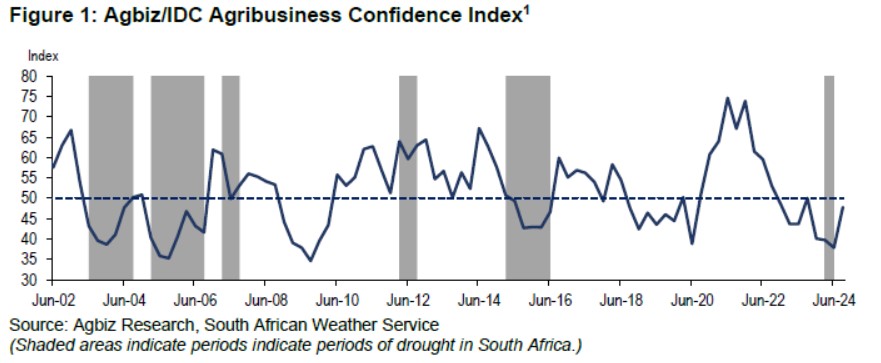
After a sharp drop in Q2 2024, reaching its lowest point since the 2009 global financial crisis, the Agbiz/IDC Agribusiness Confidence Index (ACI) rebounded by 10 points to 48 in Q3. The earlier extreme pessimism was partly driven by uncertainty around the elections, but the formation of the Government of National Unity (GNU) seems to have eased these concerns. Focus has now shifted back to core agricultural issues.
While the improvement in the ACI is a positive sign, it’s still below the neutral mark of 50, indicating that South African agribusinesses remain cautious about current business conditions. Ongoing issues such as the 2023/2024 summer crop drought, deteriorating road infrastructure, poor municipal services, recurring animal diseases, and rising geopolitical tensions are major concerns for the sector.
Additionally, while organised agriculture continues to foster a productive relationship with Transnet, there’s still room for improving port efficiency. This survey was conducted in the first week of September and covered businesses across all agricultural subsectors in South Africa.
DISCUSSION OF THE SUBINDICES
The ACI is made up of ten subindices, six of which improved in Q3 2024, while the others saw slight declines. Here is the detailed view of the subindices:
- The turnover subindex rose by 19 points to 50, driven mainly by optimism in the winter crop and financial services sectors. However, businesses in red meat and summer grains remain somewhat pessimistic due to the mid-summer drought and ongoing animal diseases. The machinery supply industry’s outlook was largely unchanged. Similarly, the net operating income subindex increased by 12 points to 46.
- The employment subindex improved by 8 points from Q2 2024 to 64, which was unexpected considering that agricultural employment had dropped by 5% quarter-on-quarter to 896 000 in Q2, as businesses faced financial strain from the drought and animal diseases. The increased optimism regarding jobs may be tied to anticipated improvements in production conditions for the upcoming season.
- The capital investments subindex increased by 11 points to 57, possibly linked to the anticipation of lower interest rates, which could enable farmers to access more affordable capital. However, ongoing weak tractor and combine harvester sales suggest it’s unclear whether this sentiment will translate into real investment changes.
- The general economic conditions subindex gained 4 points, rising to 43. The slight improvement could be attributed to a reduction in load-shedding and and aligns with more optimistic GDP forecasts from various market analysts.
- The general agricultural conditions subindex rose by 4 points to 50 in Q3 2024, reflecting optimism driven by the anticipated La Niña weather pattern for the 2024/2025 summer season, beginning in October. This weather event is expected to bring essential rainfall for summer crops and other agricultural activities. Additionally, the ongoing winter crop season is benefiting from relatively favourable production conditions.
Declining subindices:
- The volume of exports subindex dropped by 7 points to 14, indicating concerns over lower export volumes due to a challenging summer season drought. Agricultural exports were already down by 0,1% in Q2 2024 compared to 2023. The export figure for Q3 is expected to show a further decline.
- The market share subindex decreased slightly by 1 point to 64, though most respondents maintained an overall neutral stance.
- The subindices for debtor provision for bad debt and financing costs are assessed differently from the other indices. A decrease is seen as positive, while an increase indicates rising financial pressure. In Q3 2024, the debtor provision for bad debt rose by 19 points to 50, a negative sign that suggests tough financial conditions for some farming businesses, likely due to the recent drought and animal disease outbreaks. Additionally, the financing costs subindex increased by 23 points to 46, which is unexpected given the anticipated easing of interest rates.
CONCLUDING REMARKS
The Q3 2024 ACI results show a modest improvement in sentiment within the sector. However, the long-standing challenges that existed before the elections remain a key concern. ‘Although we are moving towards a promising summer season, and that may bring increased positive activity in the South African farming sector, the long-term growth prospects of the sector, which would also deliver jobs, hinges on the GNU’s ability to resolve the challenges of the network industries, improve the functioning of the municipalities and open new export markets,’ Wandile Sihlobo, chief economist of the Agricultural Business Chamber of South Africa (Agbiz), concluded.
Source: www.agbiz.co.za, Issued by: Wandile Sihlobo, Chief Economist (AgbizMarch 2024)
Fact of the month
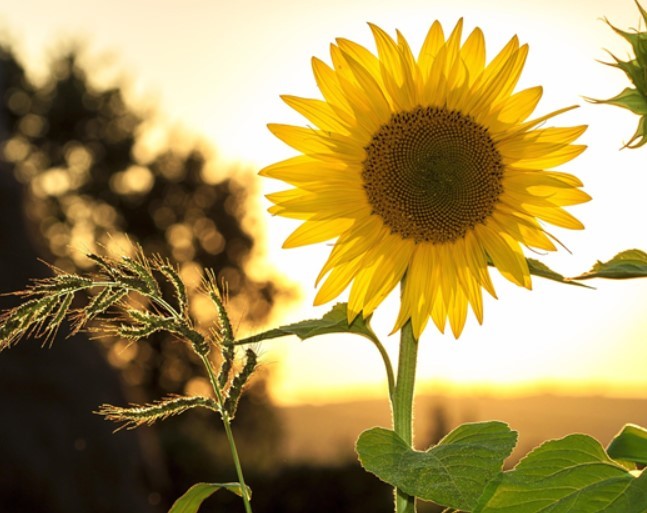
Sunflowers can absorb toxins from radioactive disasters. After an earthquake caused a radiation leak at a nuclear plant, in Fukushima, millions of sunflowers were planted to soak up radiation from the soil. Less than a mile away from Chernobyl, Ukraine, huge sunflower fields were plated to help remove radioactive elements from the water and soil after the nuclear disaster. These attributes classify sunflowers as a hyperaccumulator.
https://leaaverygear.com/blogs/other-outdoorsy-things/33-fun-facts-about-sunflowers-to-brighten-your-curiosity
Weather and climate
NATIONAL ASSESSMENT
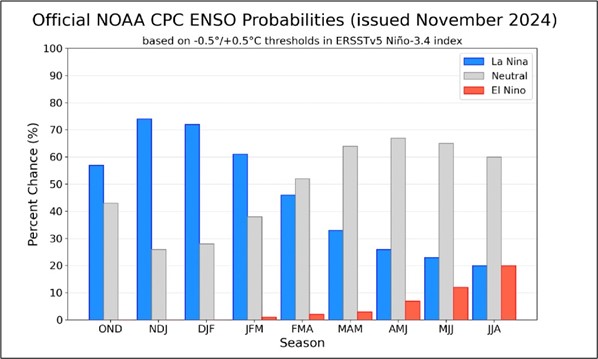
As of Mid-November 2024, the ENSO neutral conditions persist in the equatorial Pacific and both oceanic and atmospheric indicators remain in an ENSO-neutral state. In September, October, and early November, 2024, observations showed a sustained weakening of the trade winds tending to hamper the ongoing development of La Nina conditions. ENSO-neutral conditions are likely to continue during the boreal winter, spring and summer of the 2025.
The most recent official CPC ENSO Outlook (issued on November 14, 2024), the La Nina onset is forecasted in Oct-Dec 2024, with 57% chances; however, the objective IRI model-based ENSO outlook forecasts indicate the continuation of ENSO-neutral conditions for Nov-Jan, 2025. The CPC ENSO Outlook predicts a clear preference for La Niña during the winter of 2025, followed by a return to ENSO-neutral state during boreal spring of 2025.
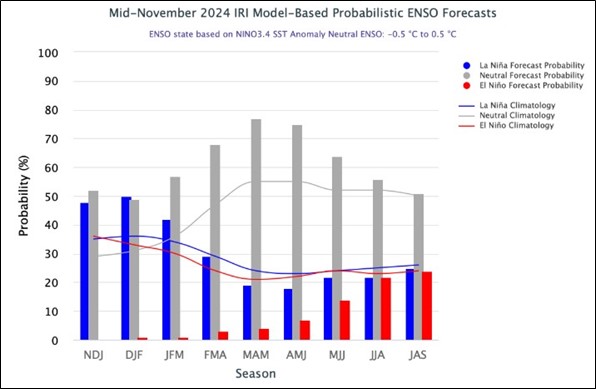
Source: https://iri.columbia.edu/our-expertise/climate/forecasts/enso/current/?enso_tab=enso-iri_plume
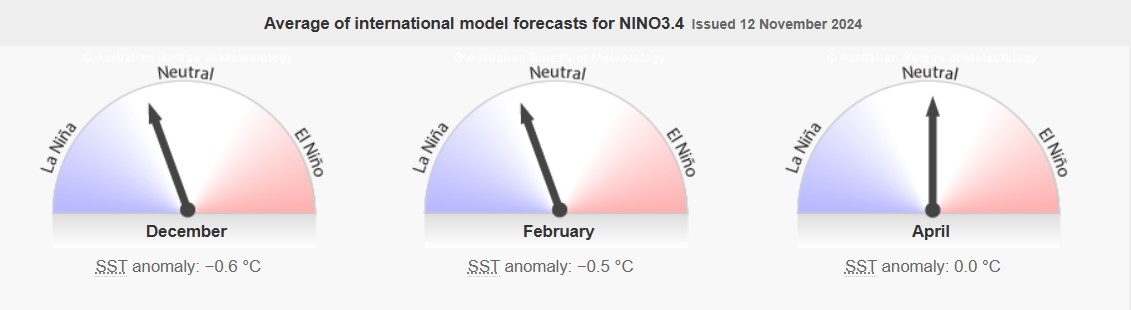
The Bureau of Meteorology’s model suggest SSTs are likely to remain within the ENSO-neutral range (-0,8 °C to +0,8 °C) throughout the forecast period to April 2025.
The graph below reflects the current neutral conditions and the ocean temperatures that are starting to get cooler. The graph supports the prediction of an ENSO-neutral state throughout the forecast period to April 2025.
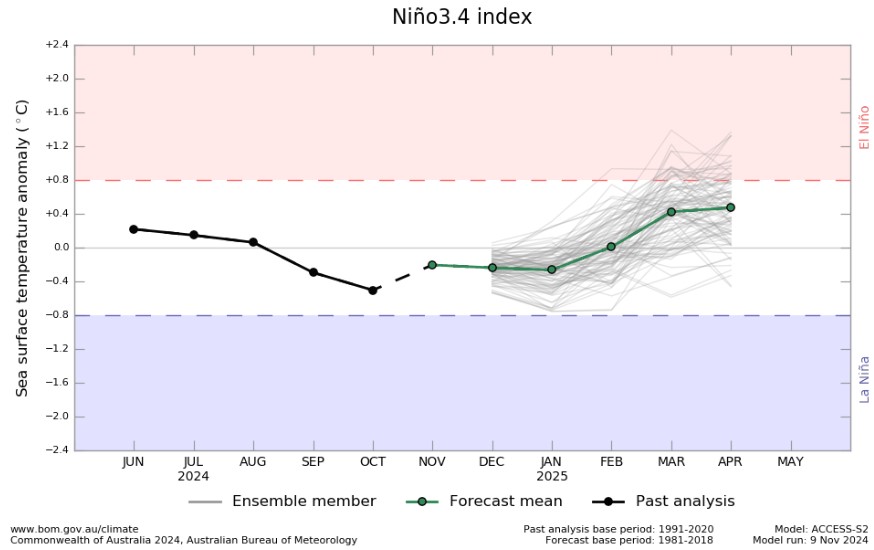
http://www.bom.gov.au/climate/model-summary/#tabs=Bureau-model®ion=NINO34
The latest Climate Watch issued by the SA Weather Service (04 October 2024) predicts above-normal rainfall is forecasted for the central parts and the south-eastern coastal areas of the country during early and mid-summer seasons.
This above-normal rainfall forecast for these summer rainfall regions will likely have a positive impact on crop and livestock production. However, below normal rainfall is expected over most parts of the north-eastern areas of the country including Limpopo, Mpumalanga, and northern parts of KwaZulu-Natal Province. Therefore, it is recommended that the relevant decision-makers advise farmers in these regions to implement soil and water conservation measures, proper water harvesting and storage techniques, establish effective drainage systems, and adopt other appropriate farming practices.
The critical period for rainfall for South Africa’s summer grains and oilseed is between October and the end of February the following year. This is a period between planting and pollination of the crop. The months after are essential, but the crop could still have decent yields even if there is less rain after the pollination.
Minimum and maximum temperatures are expected to be mostly above-normal countrywide for the forecast period.
Source: https://www.weathersa.co.za/Documents/SeasonalForecast/SCOLF202407_01082024095021.pdf
SUNSPOTS
Sunspots are darker, cooler areas on the surface of the sun that arise due to disturbances in the sun’s magnetic field. Every eleven years, the number of spots dotting the surface of the sun increases and decreases and forms the solar cycle.
Sources:
https://www.sciencedirect.com/science/article/abs/pii/S136468262200116X#:~:text=It%20was%20observed%20that%20rainfall,an%20increasing%20effect%20on%20rainfall
https://www.space.com/solar-cycle-frequency-prediction-facts May 27,2022.
https://eos.org/articles/why-did-sunspots-disappear-for-70-years-nearby-star-holds-clues 10 June, 2022.
According to science direct the rainfall rate is directly related to the sunspot number, but shows different characteristics during solar maximum years. Though a lag correlation exists between sunspot number and rainfall, sunspots have an increasing effect on rainfall. Studies show that the more sunspots are present the higher the rainfall and the less sunspots the lower the rainfall.
ENSO occurs at irregular intervals between three and seven years causing global climate system variation. Considering this event occurs periodically, it might be triggered by the eleven-year solar cycle as an energy source.
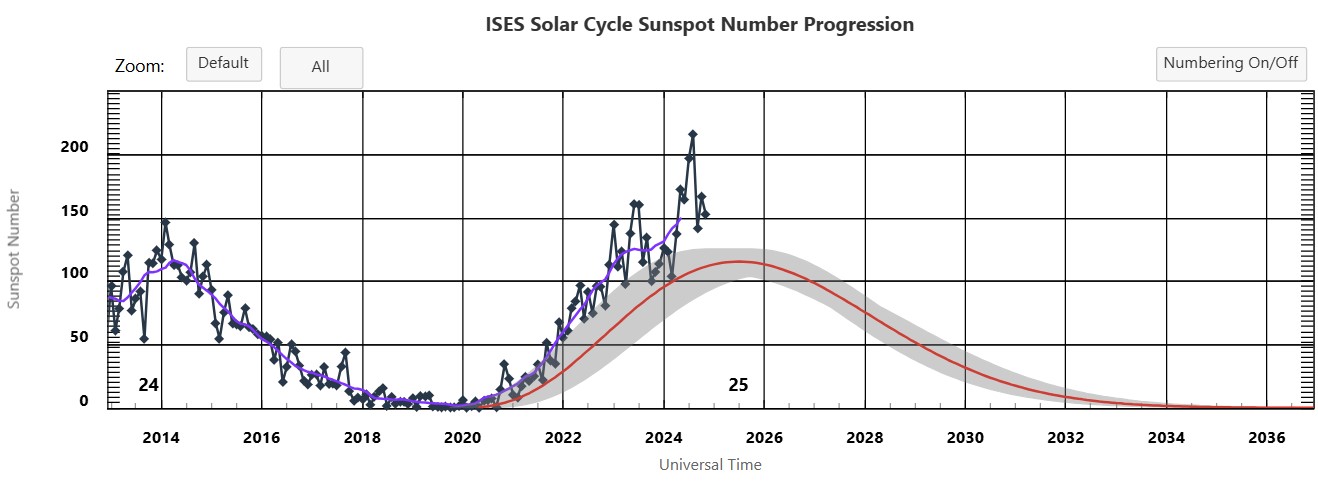
The graph below shows the eleven-year solar cycles since before the 2000s. As the graph is in an upward trajectory higher rainfall can be expected – La Niña. As the graph reaches its turning point and moves in a downward trajectory less rainfall is expected characteristic of an El Niño.
ENSO indicators are currently at neutral and a La Niña is expected to form during summer. Since October 2020 to November 2024 the actual sunspot numbers were higher than the predicted values. The monthly sunspot values for November 2024 were 152,5.
The conclusion can be made that the sunspots are not yet at their downward turning point. When the sunspots are in an increasing phase it means more rainfall and when in a decreasing phase it usually means less rainfall.
https://www.spaceweatherlive.com/en/solar-activity/solar-cycle.html
https://www.swpc.noaa.gov/products/solar-cycle-progression
Market risk
GRAIN MARKET ANALYSIS
• Ending stock – National
Ending stock data is gathered from the NAMC. The estimates are reassessed and reported by the Grain and Oilseeds supply and demand estimates committee. The following is the projected ending stock for April 2025 in tonnages for the 2024/2025 season:
- White maize => 395 884 t
- Yellow maize => 537 848 t
The following is a summary of September 2025 ending stock projections for the 2024/2025 season:
- Wheat => 698 717t
The following is a summary of February 2025 projected ending stock for the 2024/2025 season:
- Sunflower => 45 894 t
- Soybeans => 134 477 t
- Sorghum => 67 560 t
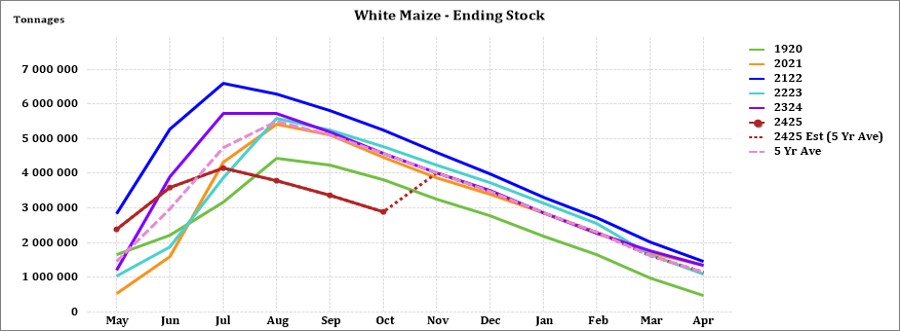
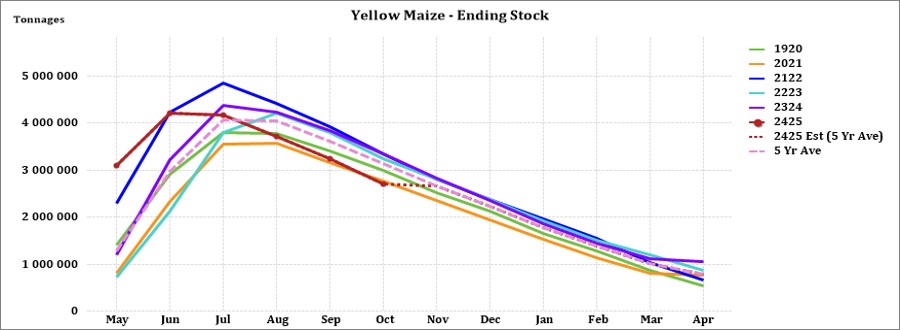
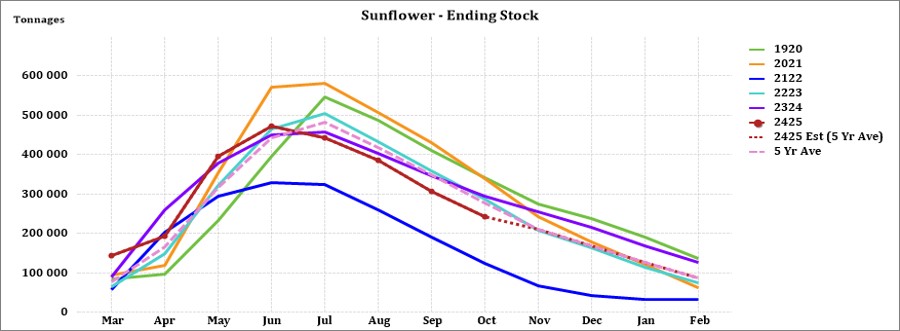
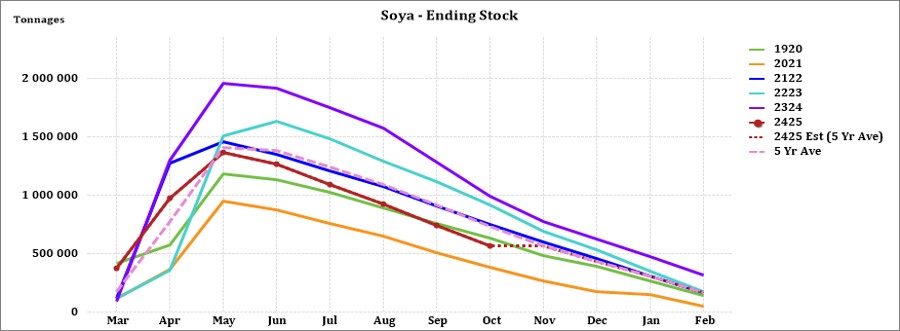
The graphs below show the predicted ending stock for the different commodities according to SAGIS data. A five-year average has been calculated to determine the estimated ending stock for the current season.
The predicted five-year average white maize in April 2025, is 202 082 t less than the final for the 2023/2024 season. Yellow maize shows a 282 419 t decrease in ending stock compared to the previous season.
The predicted five-year average sunflower ending stock for the 2024/2025 season is 41 396 t less than the previous season ending stock.
The predicted five-year average soybean ending stock for 2024/2025 is 151 551 t less than the previous season ending stock.
Crop estimations
According to the Crop Estimate Committee (CEC) final production forecast for 2024, the total area estimate for maize in South Africa is 2,636 million ha, which is 1,94% more than the actual 2,586 million ha planted for the previous season. The total forecasted tons for white maize and yellow maize remains unchanged at 12, 724 million tons from the ninth forecast.
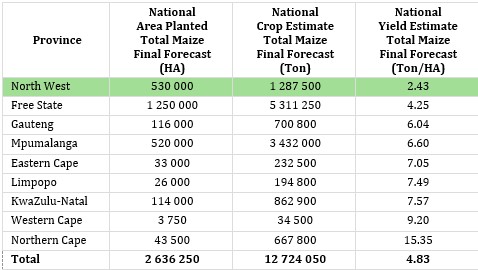
Source: CEC (Crop Estimates Committee)
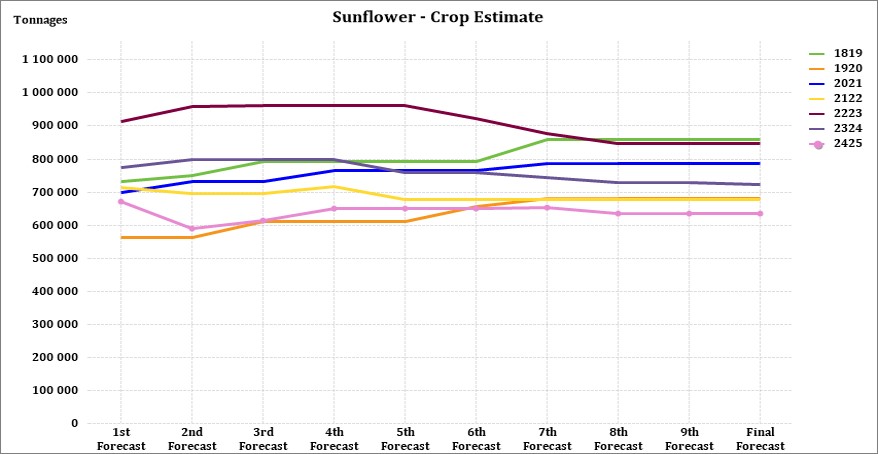
The production forecast for sunflower seed remained unchanged at 635 750 t. The area estimate for sunflower seed is 529 000 ha while the expected yield is 1,20 t/ha.
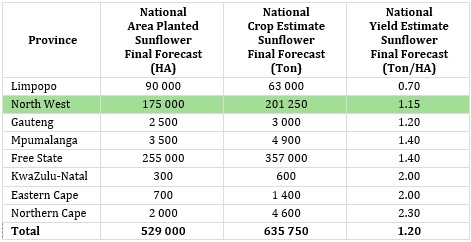
Source: CEC (Crop Estimates Committee)
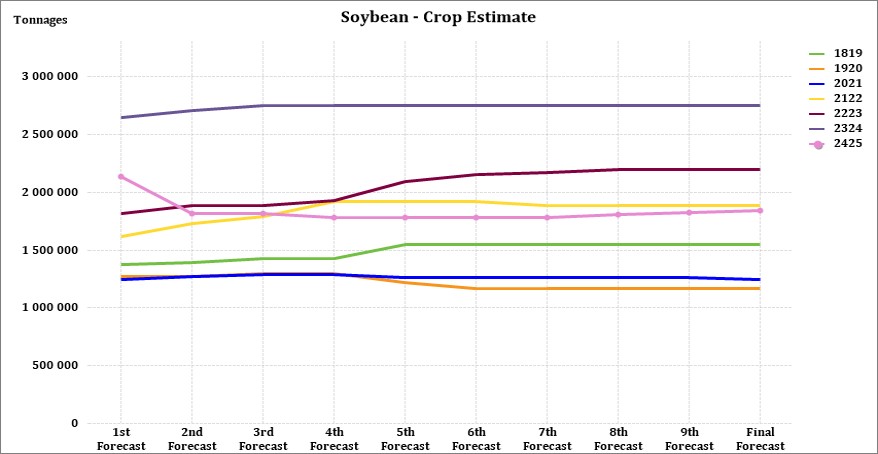
The production forecast for soybeans is 1,840 million tons, 0,61% more than the previous season. The estimated area for soybeans is is 1,151 million ha with an expected yield of 1,60 t/ha.
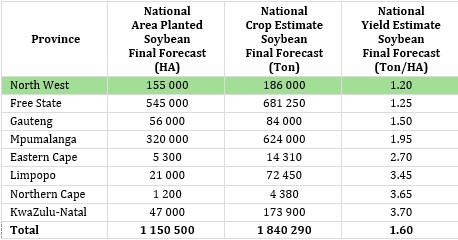
Source: CEC (Crop Estimates Committee)
• Imports and exports – National
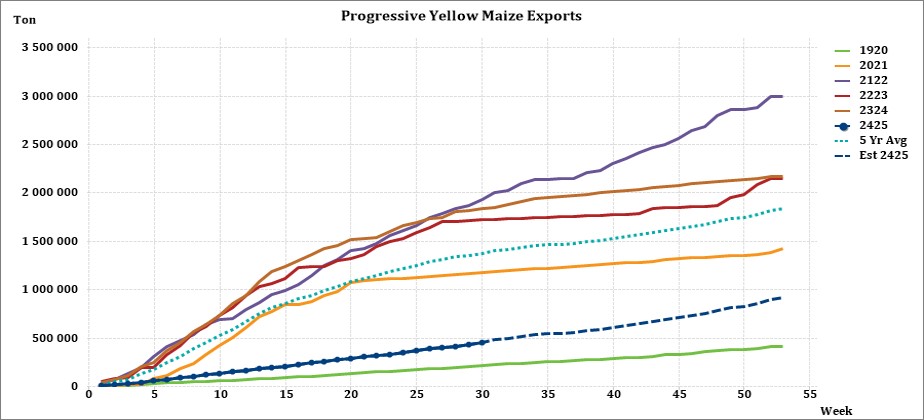
For the production season ending April 2025, 739 153 t of white maize and 383 823 t of yellow maize have been exported to date (week 30 of 52) as seen in the graphs below.
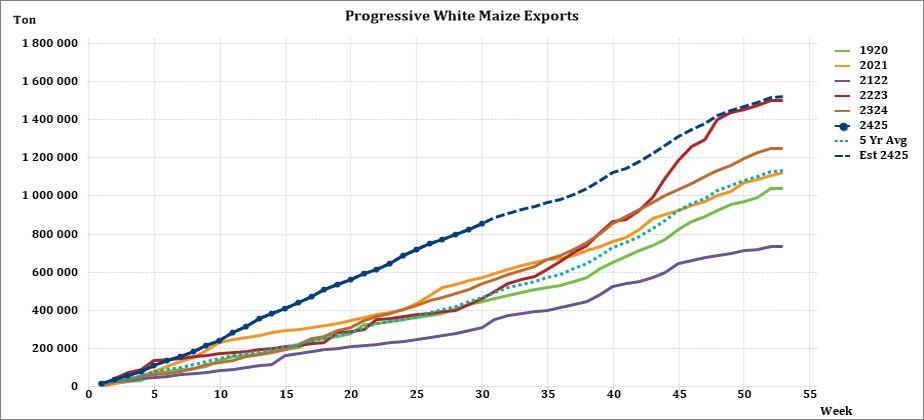
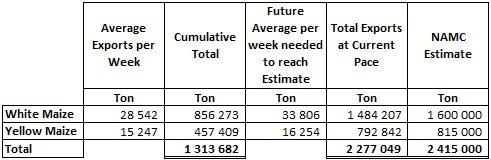
As seen in the table above, the average white maize exports per week is currently 28 542 t. If theoretically, white maize exports remain at the current average per week then there would be 115 2793 t less white maize exports than anticipated.
The average yellow maize exports per week are currently 15 247 t. If theoretically, yellow maize exports remain at the current average per week then there would be 22 158 t less yellow maize exports than anticipated.
• Parity prices
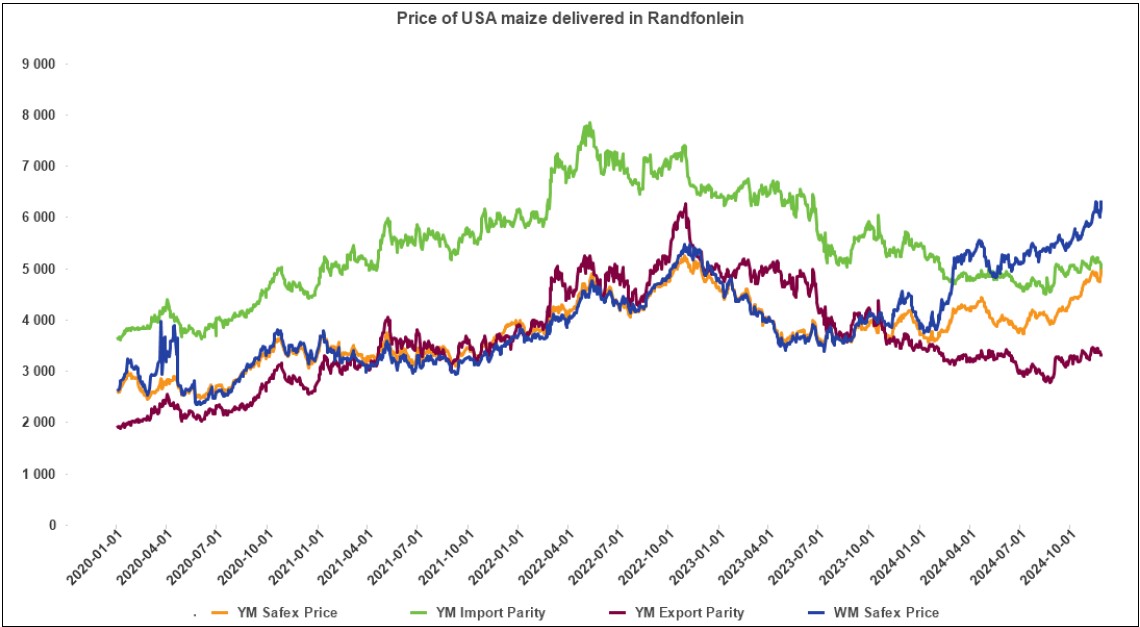
South Africa is a small producer compared to other countries and is thus a price taker (meaning that we cannot influence world prices). Because of this, our local prices are normally between import and export parity, which is illustrated in the figure below. An import parity price is defined as the price which a buyer will pay to buy the product on the world market. This price will include all the costs incurred to get the product delivered to the buyer’s destination.
An export parity price is defined as the price that a local seller could receive by selling his product on the world market e.g., excluding the export costs. The price which the seller obtains is based on the condition that he delivers the product at the nearest export point (usually a harbour) at his own expense.
The graph below reflects the Safex price, import parity and export parity of yellow maize as well as the Safex price of white maize. The import and export parity prices for white maize is not released by Grain SA for this period.
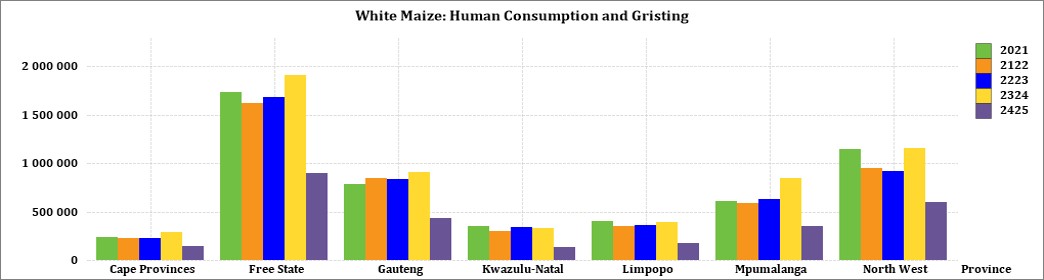
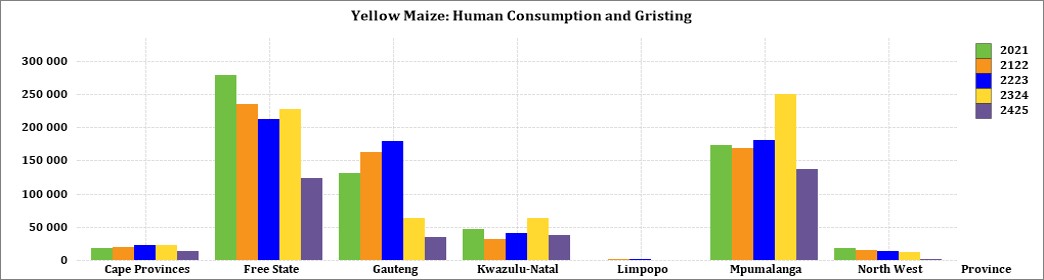
• Grain processing per province
For the marketing year which is May to April (2024/2025), the Free State province dominates the white maize that is used for human consumption and gristing. North West consumed the second most white maize produced for human consumption for the marketing year, 2024/2025.
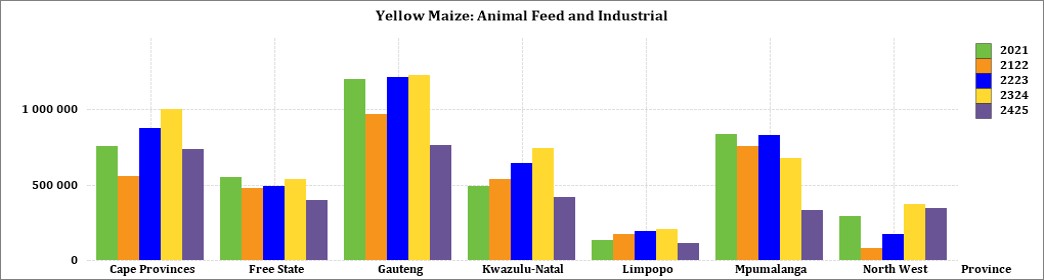
Gauteng used the most white maize for animal feed and industrial usage with the Free Sate using the second most.
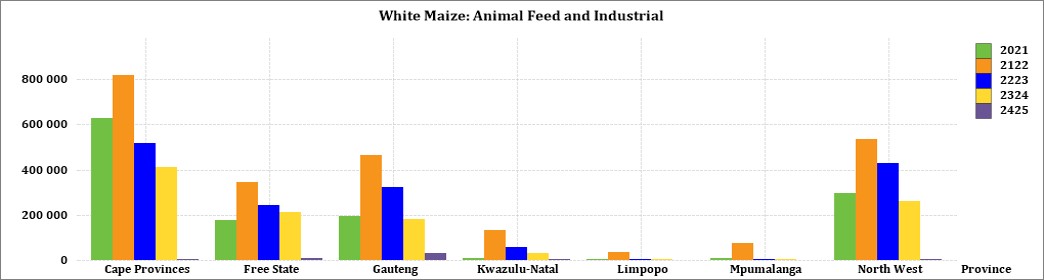
Mpumalanga processed the most yellow maize for consumption and gristing and Gauteng processed the most yellow maize for animal feed and industrial purposes.
• Exchange rate
NWK Group is exposed to foreign exchange rate risk in various business areas, such as commodity prices and trade imports, etc.
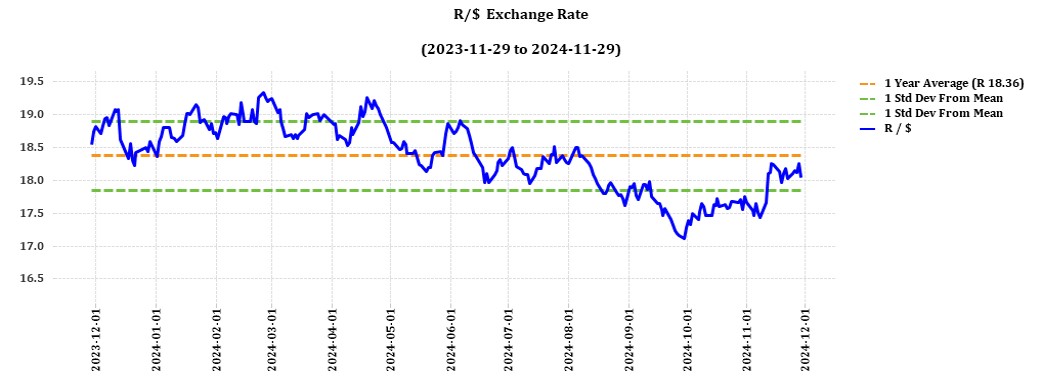
The rand traded at a monthly average of R17,56 against the dollar for the month of October. This is better than a year earlier. On 6 November the rand plummeted after the US election results were announced and traded at R17,81. On 25 November the rand traded at R18,10 against the dollar.
Source: Trading Economics
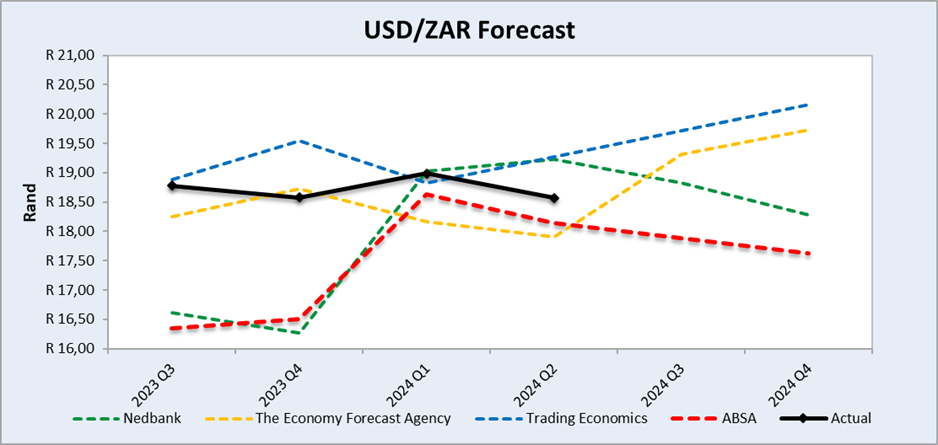
Source: Nedbank CIB; The Economic Forecast Agency; Trading Economics
The graph above shows the actual USD/ZAR for 2023 Quarter 3 (Q3) to 2024 Quarter 4 (Q4) against the forecasted figures.
• Interest rate risk
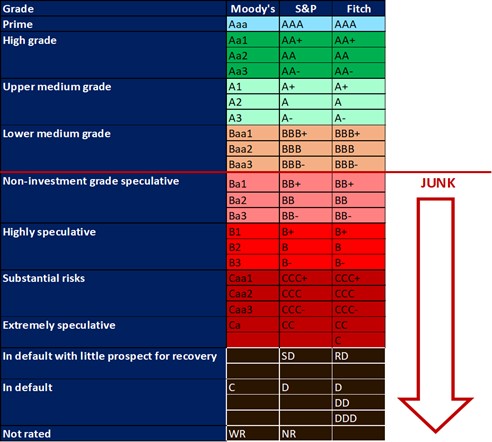
On 27 March 2020, Moody’s downgraded South Africa’s sovereign credit rating to sub-investment grade and placed a negative outlook on the rating. The key drivers for this downgrade include weak economic growth, continuous deterioration in fiscal strength, and slow progress on structural economic reforms. It is now the first time in post-apartheid South Africa that all major rating agencies, i.e., Moody’s, Fitch, and S&P, have South Africa’s credit ratings in sub-investment grade territory. More than a year later and our Moody’s rating remains the same.
During the previous Monetary Policy Committee (MPC) meeting held on 21 November the committee decided interest rates will decrease with 25-basis points. The repo rate is currently 7,75% and the prime rate is 11,25%. The South African Reserve Bank made several interest rates cuts to bring relief to the economy after Covid-19, but since November 2021 borrowing costs rose again by a cumulative 475 bps.
Interest rate movement:
26th January 2023 – 10,75%
30th March 2023 – 11,25%
25th May 2023 – 11,75%
20th July 2023 – 11,75%
21th September 2023 – 11,75%
23rd November 2023 – 11,75%
27th March 2024 – 11,75%
30th May 2024 – 11,75%
18th July 2024 – 11,75%
19th September 2024 – 11,50%
21st November 2024 – 11,25%
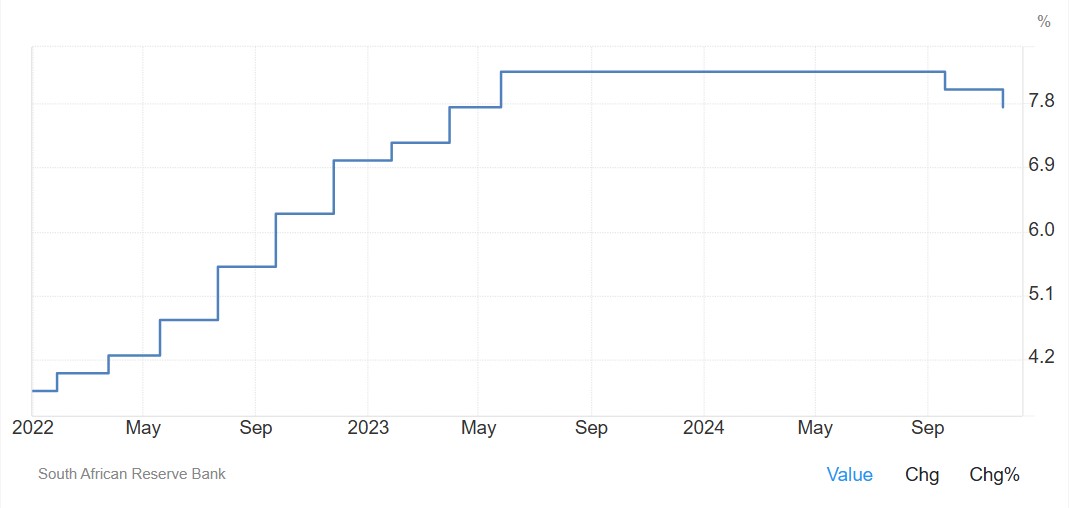
The South African Reserve Bank reduced its key interest rate by 25 basis points to 7,75% on 21 November 2024, as anticipated, bringing borrowing costs to their lowest level since April 2023. Policymakers stressed that while inflation is well-contained in the short term, the medium-term outlook carries significant uncertainties and potential for upside risks.
Source: South African Reserve Bank
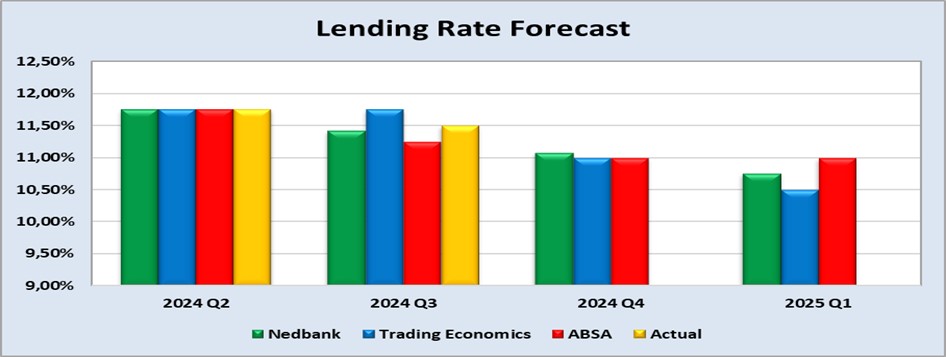
Interest rate (lending rate) forecast.
The benchmark interest rate in South Africa was last recorded at 8%. Interest rate in South Africa is expected to be 7,75% by the end of this quarter, according to Trading Economics global macro models and analysts’ expectations. In the long-term, the South Africa interest rate is projected to trend around 6,75% in 2025 and 5,5% in 2026, according to our econometric models.
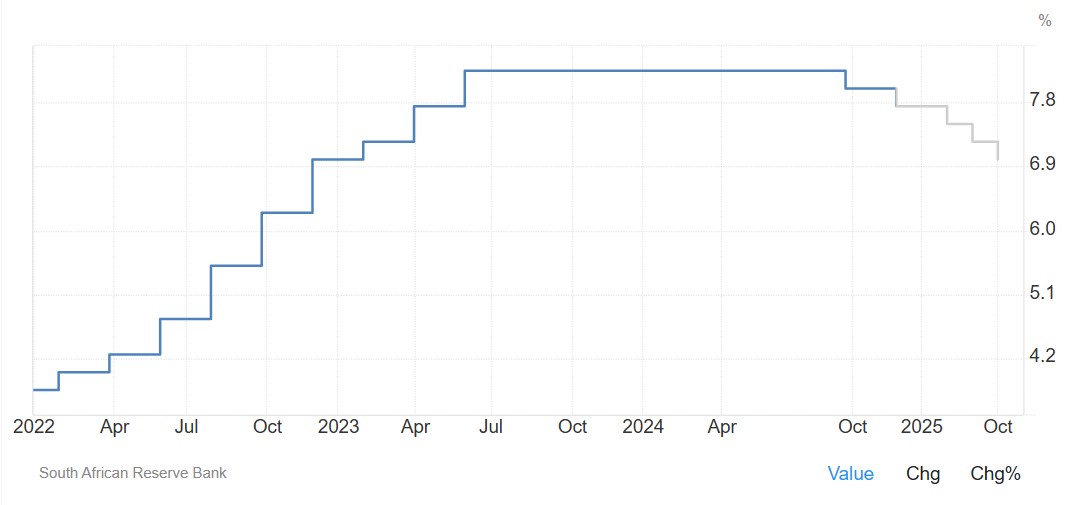
The following graph shows the prime rate forecast for 2024 Quarter 2 to 2025 Quarter 1.
• Inflation rate
As the inflation rate is a driver for increases and decreases in interest rates the current rate and forecast have to be assessed to foresee further increases in the interest rate.
Current: South Africa’s annual inflation rate fell for the fifth straight month in October, hitting an over four-year low of 2.8%, down from 3.8% in the prior month.
Falling fuel prices remain the primary factor behind the slowdown. Petrol and diesel prices declined by 5,3% between September and October, taking the annual rate for fuel to -19,1%.
Additionally, prices moderated for some CPI items, including restaurants and hotels (5,9% vs 7,4% in September); food and non-alcoholic beverages (3,6% vs 4,7%), alcoholic beverages & tobacco (4,5% vs 4,7%) and health (4,8% vs 5,1%).
The core inflation rate, which excludes volatile items such as food, non-alcoholic beverages, fuels, and energy, eased to 3,9% in October, the lowest since April 2022, down from 4,1% in each of the previous two months. On a monthly basis, consumer prices edged down by 0,1% in October, marking the first decrease in almost a year, following a 0,1% increase in September.
Source: Statistics South Africa
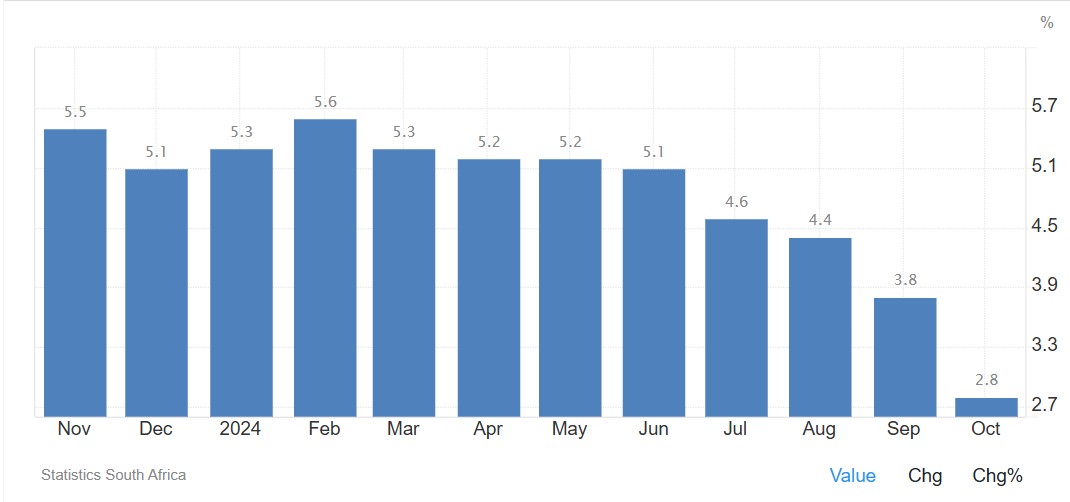

Inflation rate in South Africa decreased to 2,8% in October from 3,8% in September of 2024. Inflation rate in South Africa is expected to be 4,6% by the end of this quarter, according to Trading Economics global macro models and analysts’ expectations. In the long-term, the South Africa inflation rate is projected to trend around 4% in 2025 and 4,4% in 2026, according to our econometric models.Source: https://tradingeconomics.com/south-africa/inflation-cpi
• Highlights in the agrochemical sector
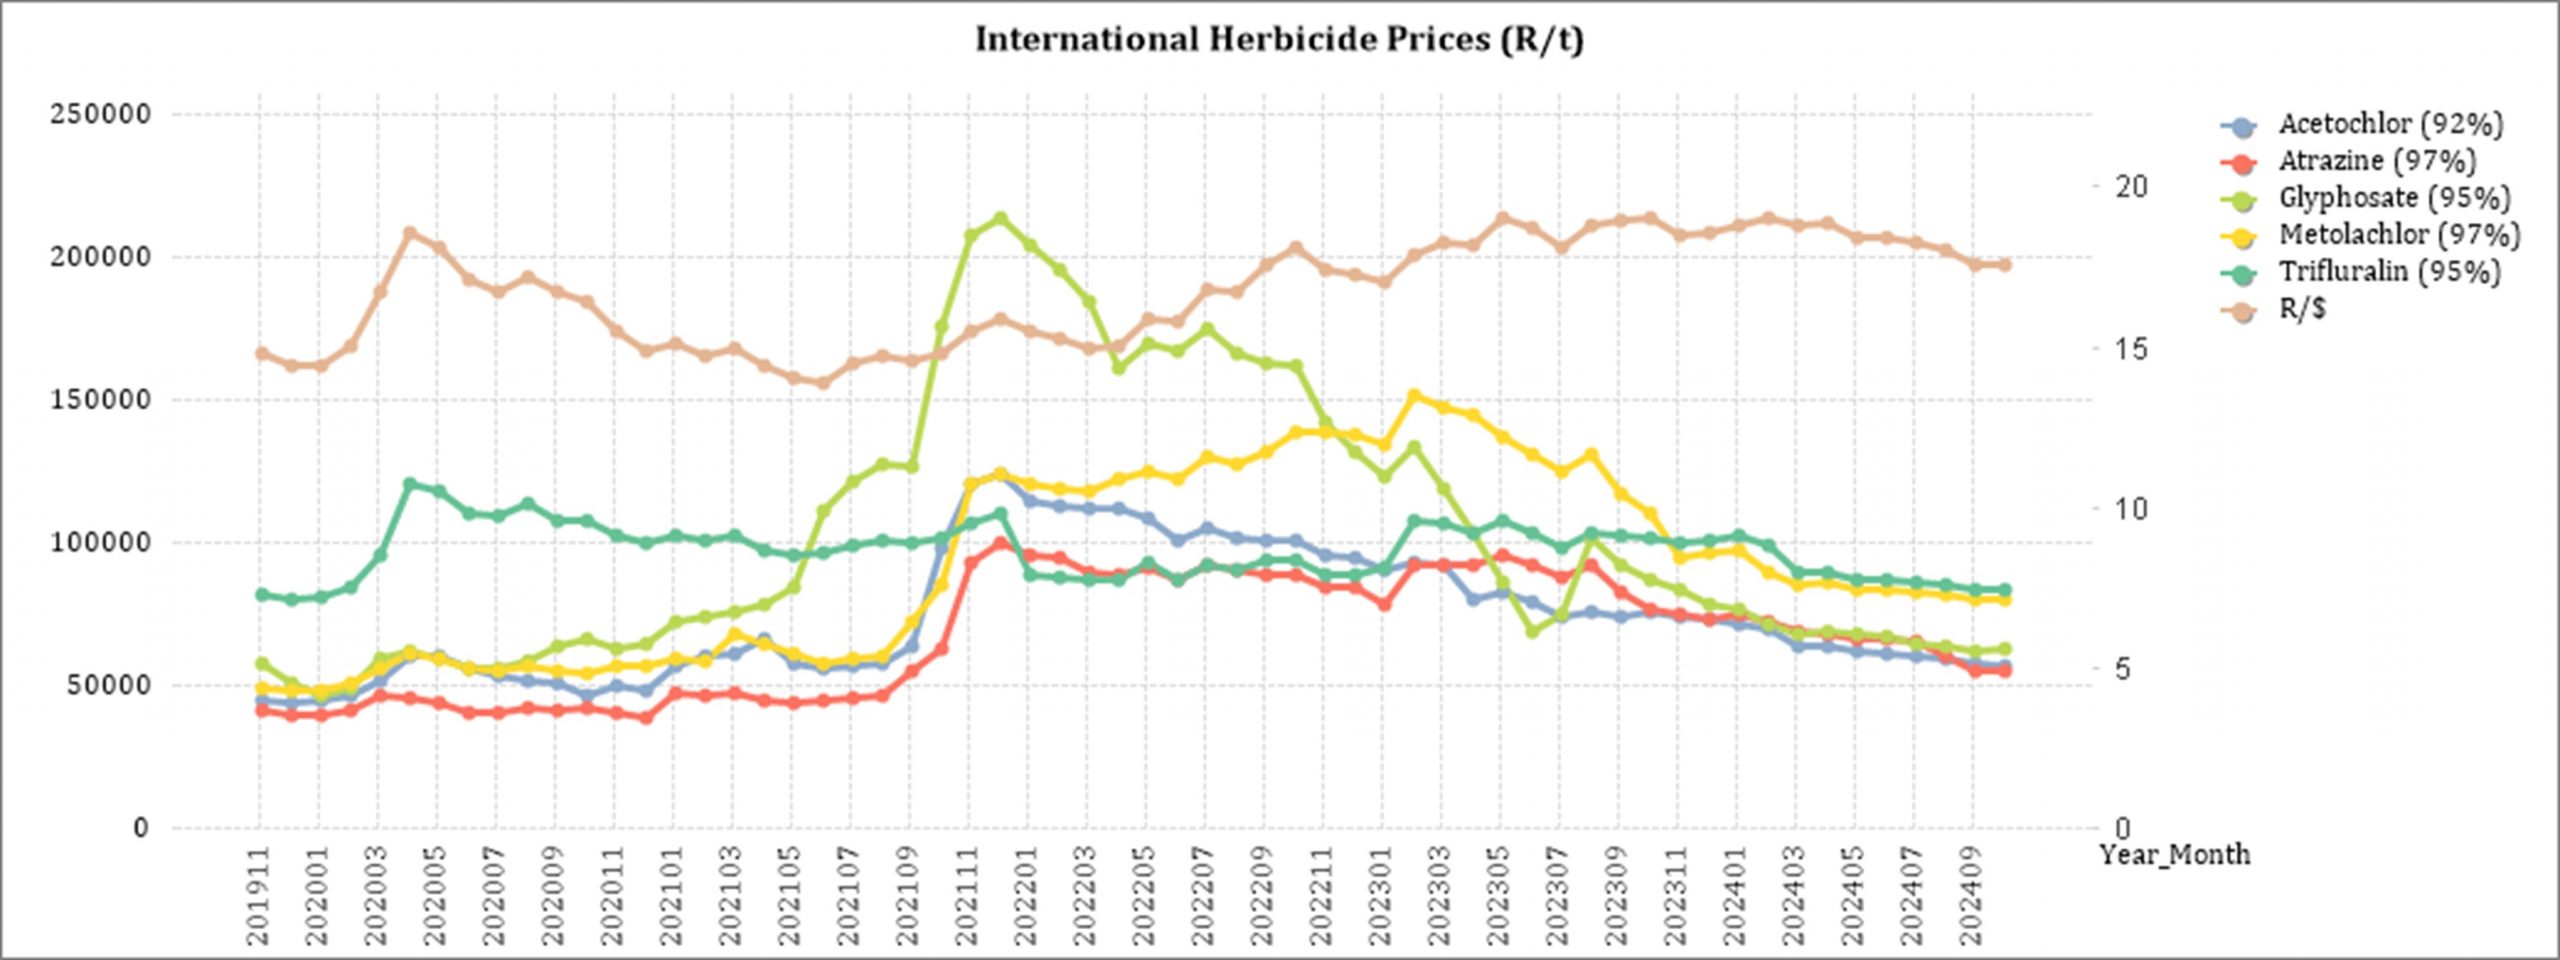
International herbicide prices, including glyphosate, have decreased compared to the previous year and month. This could potentially impact the cost of crop production for South African farmers.
The South African agrochemicals market size is estimated at USD 1,27 billion in 2024 and is expected to reach USD 1,53 billion by 2029, growing at a CAGR of 3,9% during the forecast period.
There is a rising trend in the adoption of bio-based agrochemicals, such as fertilisers and biopesticides, especially for crops targeting export markets. This shift is encouraged by stricter environmental regulations and the demand for residue-free produce.
Civil society organisations continue to lobby for the banning of highly hazardous active ingredients. The industry is under pressure to reduce usage of hazardous chemicals, but demand for chemical pesticides remains strong. Some farmers are reluctant to change due to the efficiency of synthetic chemicals and fear that it will affect the stability of their yields.
Source: Cnchemicals
Herbicides
The following products are the main products regarding herbicides that may have an impact on input costs for producers.
Glyphosate (95%)
Acetochlor (92%)
Atrazine (97%)
Metolachlor (97%)
Trifluralin (95%)
The following comparison is from the November 2024 Grain SA report which reports the previous month’s prices.
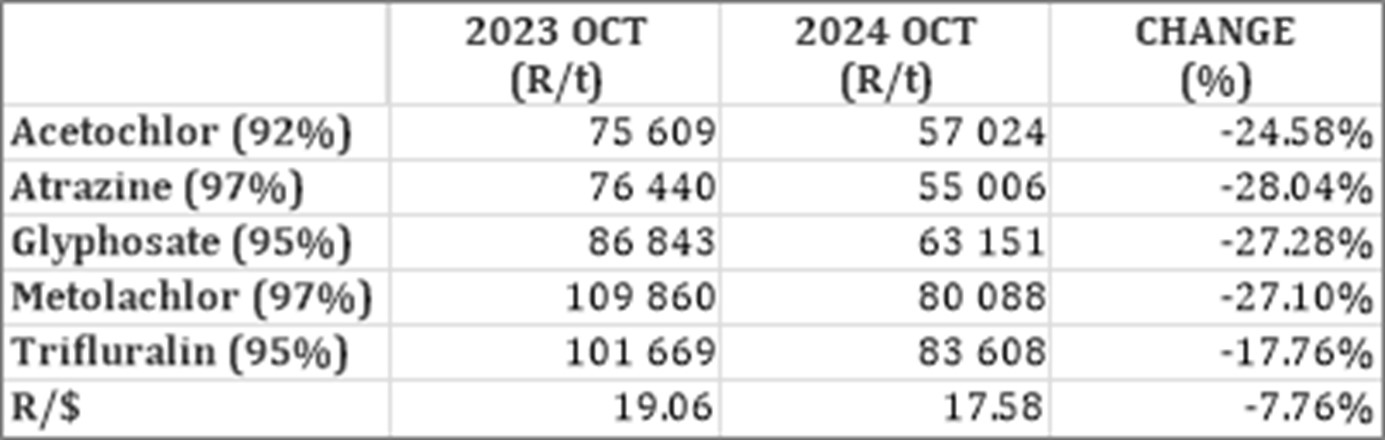
In comparison with the previous year’s prices, all of the products experienced a price decrease. Atrazine had the biggest decrease of 28,04%.
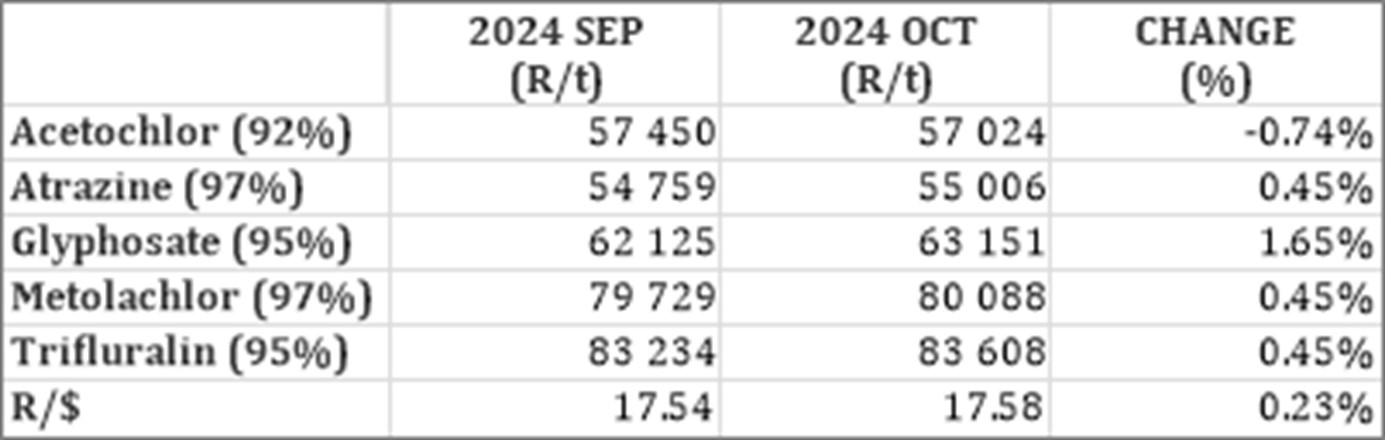
For the two months compared most of the products experienced a slight price increase. Acetochlor experienced the only price decrease of 0.74%.
For the two months compared most of the products experienced a slight price increase. Acetochlor experienced the only price decrease of 0,74%.
The graph below shows the international herbicides prices (R/t) per product from November 2019 to date.
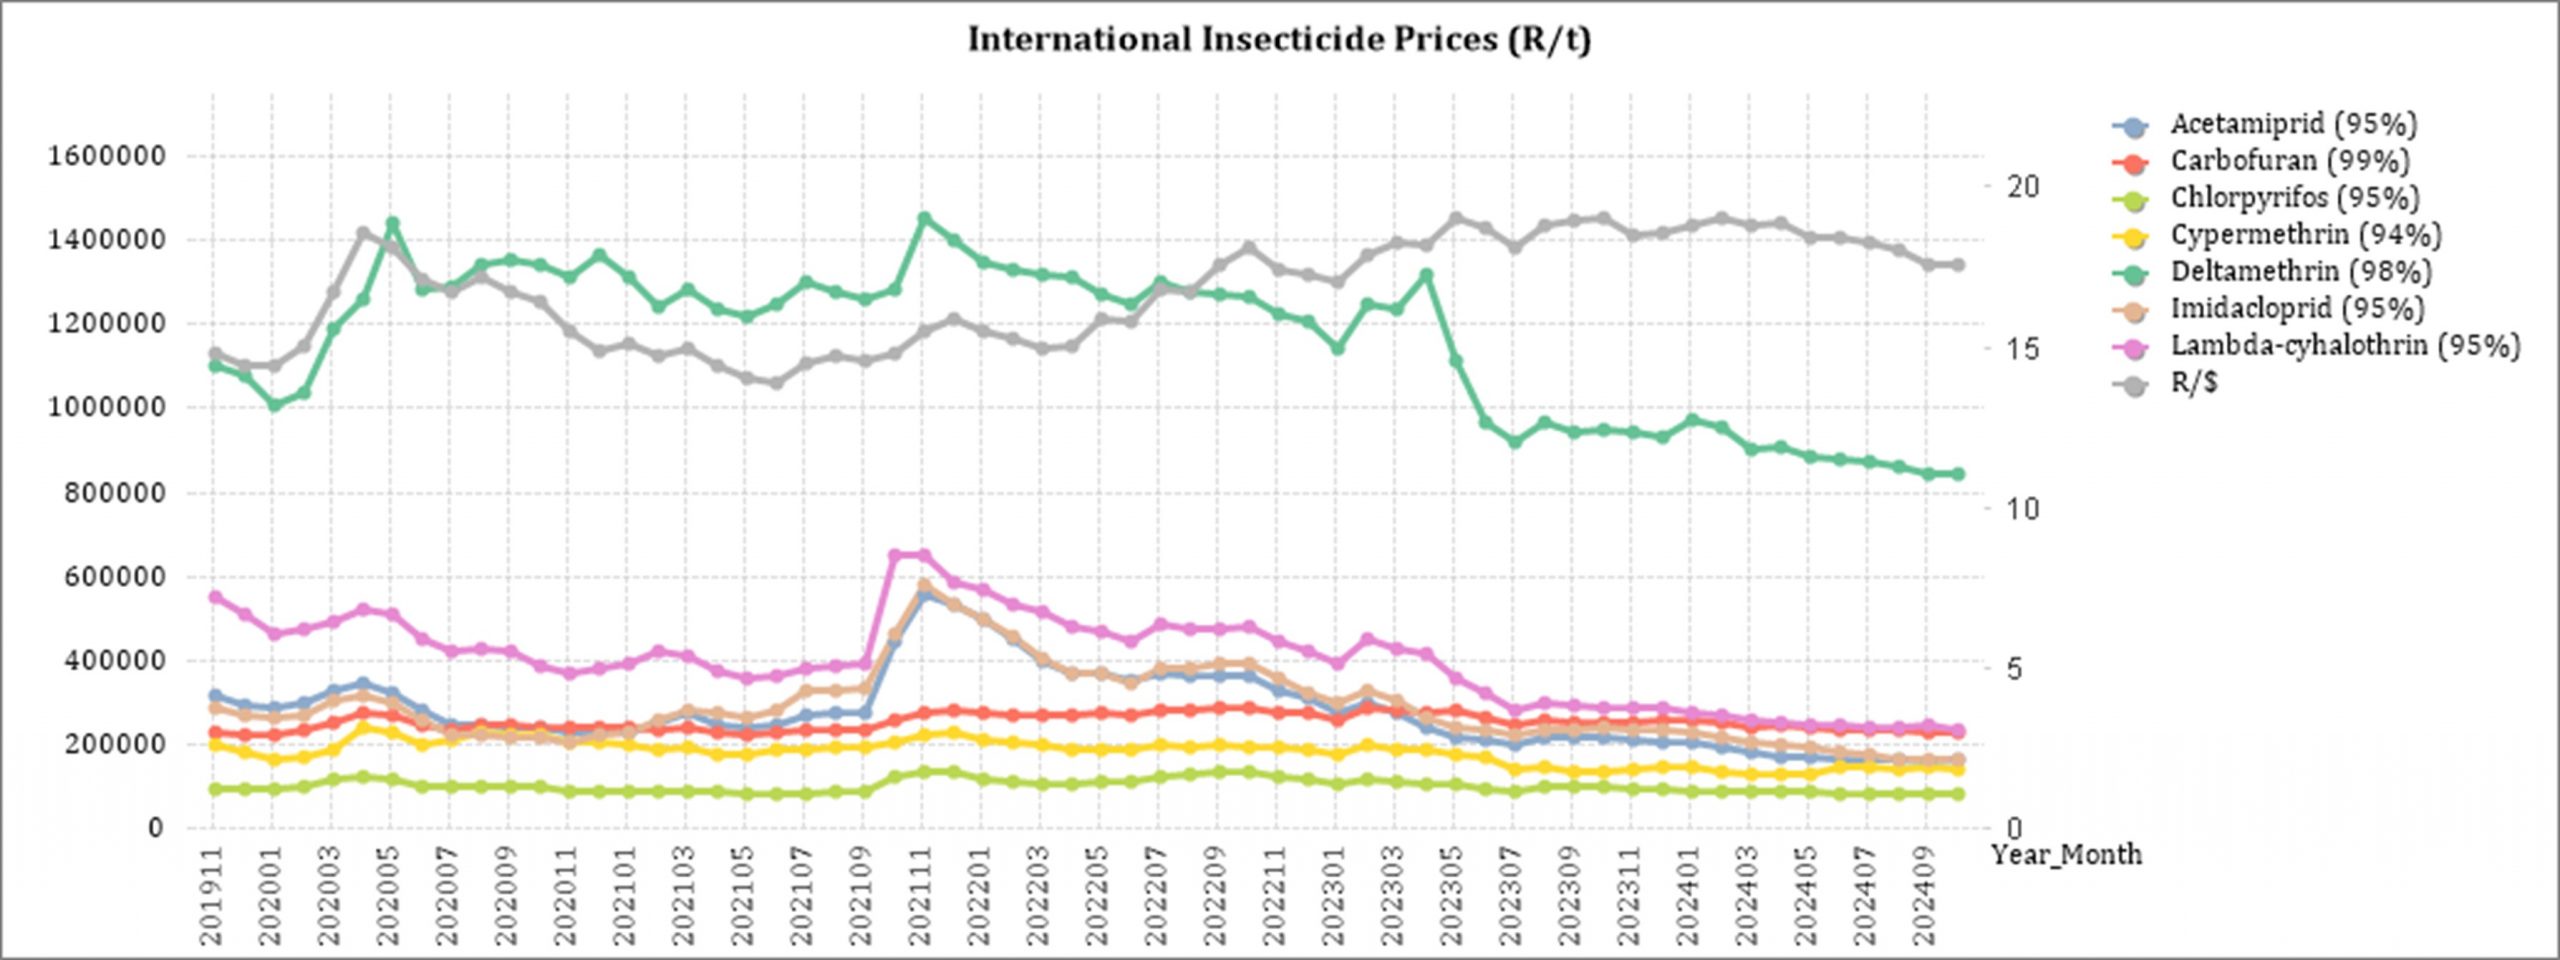
Insecticides
The following products are the main products regarding insecticides that may have an impact on input costs for producers.
Imidacloprid (95%)
Lambda-cyhalothrin (95%)
Carbofuran (99%)
Deltamethrin (98%)
Acetamiprid (95%)
Chlorpyrifos (95%)
Cypermethrin (94%)
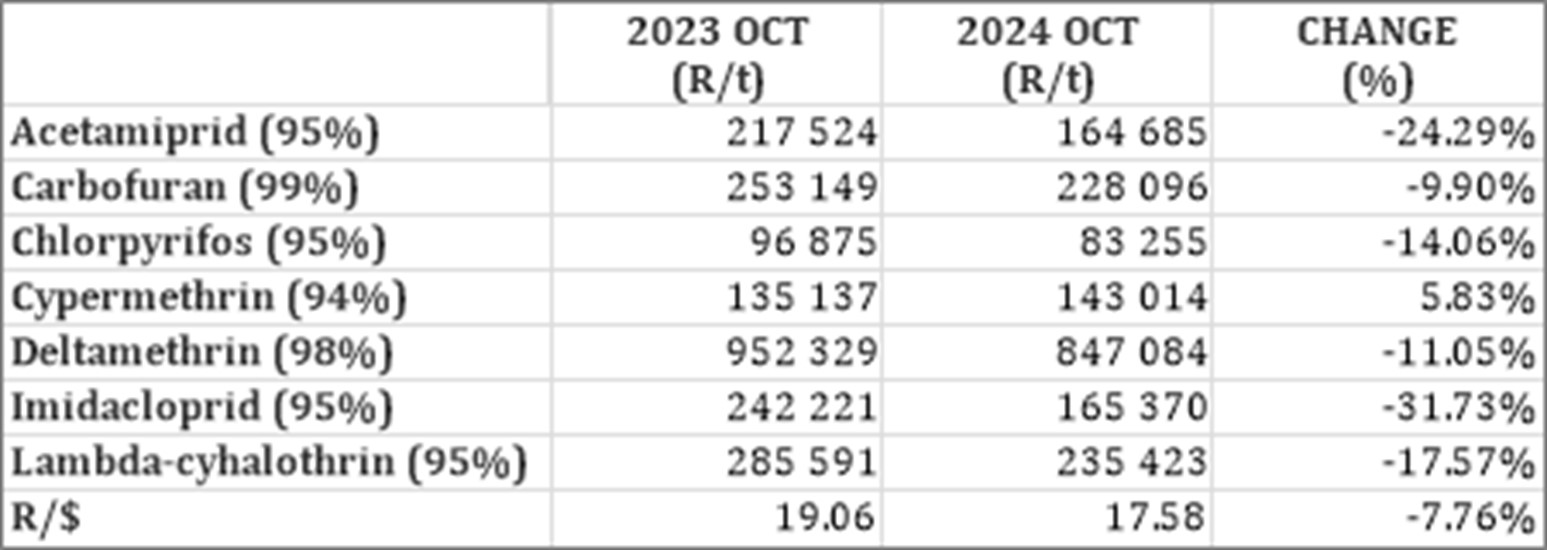
In comparison with the previous year’s prices, most of the products experienced a price decrease. Cypermethrin experienced the only price increase of 5,83%
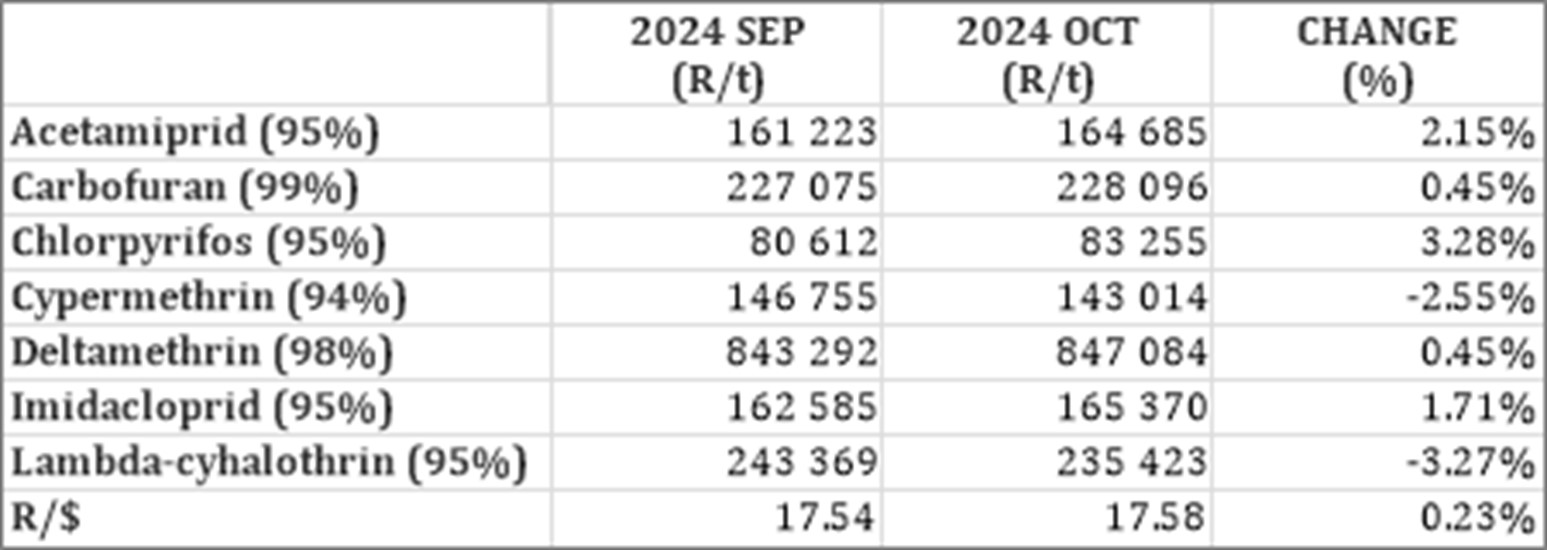
For the two months compared most of the products experienced a price decrease. The rest of the product prices increased, Chlorpyrifos experienced the highest increased with 3,28%.
The graph below shows the international insecticide prices (R/t) per product from November 2019 to date.
Fertiliser
The following fertiliser products are being analysed:
Ammonia (Middle East)
Urea (46%) (Eastern Europe)
DAP (USA Gulf)
KCL (CIS)
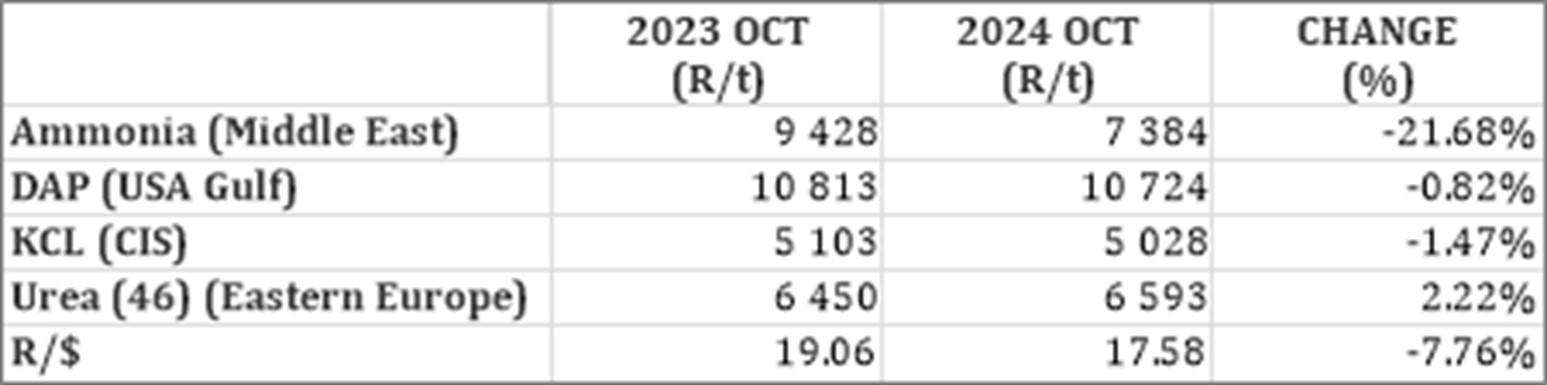
In comparison with the previous year’s prices, most of the products experienced a price decrease. Urea experienced te only price increase of 2,22%.
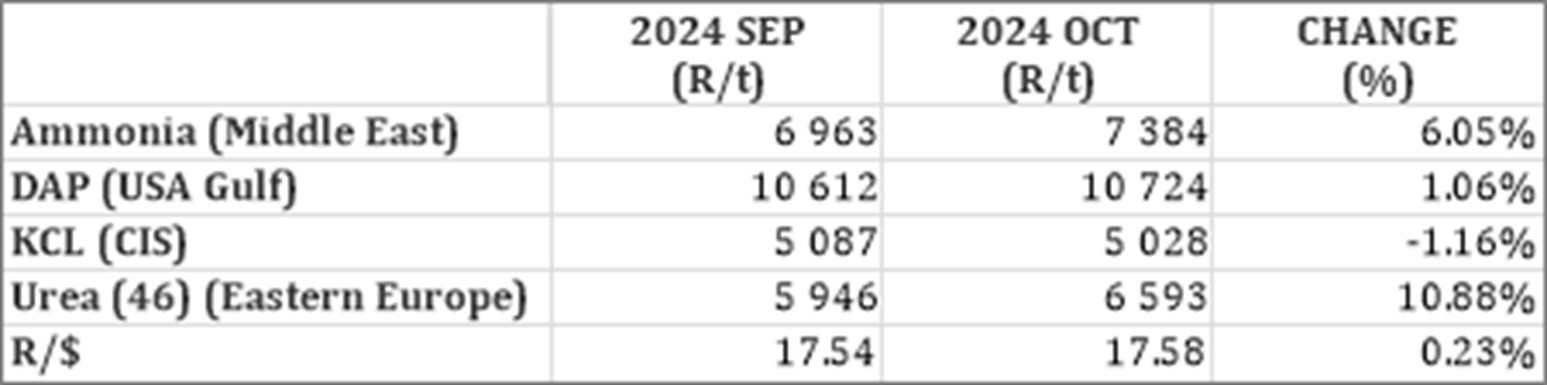
In comparison with the previous month’s prices, most of the products experienced a price increase. Urea increased with 10,88%.
The graph below shows the international fertiliser prices (R/t) per product from November 2019 to date.
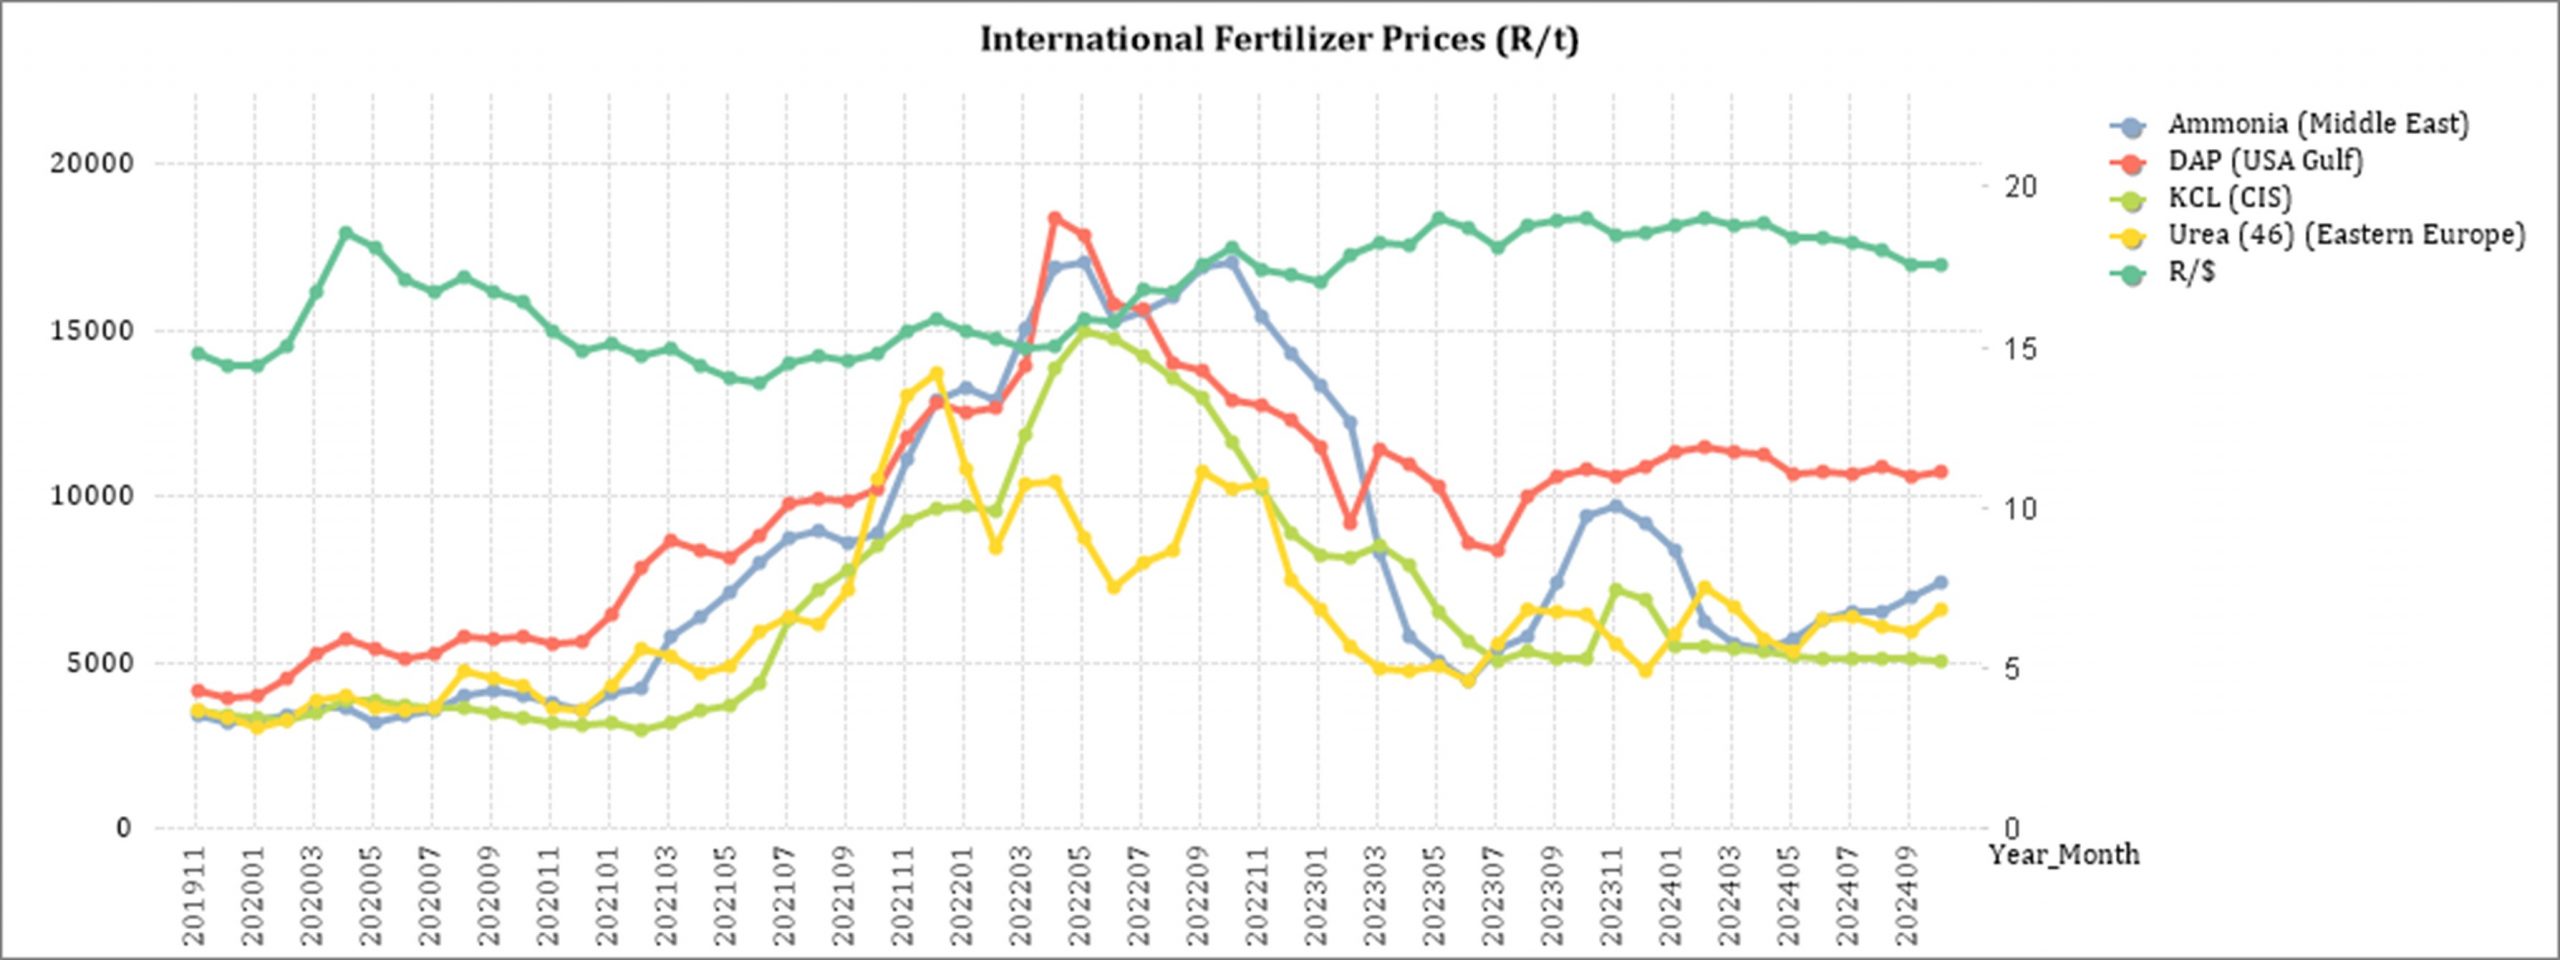
Urea: India recently purchased over 1 million tons of urea, mainly sourced from the Middle East and Russia, with prices from Egypt, Malaysia, and Nigeria at $362 per ton CFR (cost and freight) to India, which corresponds to a low FOB (free on board) price in the $340s for the Middle East.
Despite this substantial purchase, the market remains oversupplied due to slow sales, leading to a continued decline in prices. The Middle East urea price has further decreased to around $340 per ton and is expected to fall further until demand picks up.
In the local market, many importers have significant stockpiles of urea and other grades. Delays in South African rains have led to slow deliveries from Durban. Although neighbouring countries have experienced better rainfall, wet weather has disrupted port operations, creating a backlog of fertiliser shipments waiting to dock.
Ammonia: In Europe, imported nitrogen fertiliser is cheaper than European produced ammonia as the cost of producing natural gas is so high. This raises prices and negatively impacts demand. In Asian markets the ammonia prices are starting to decrease.
Phosphate: Trade in the phosphates sector is slower than usual for this time of year. The small volume of deals that were concluded this week pointed to lower prices but the limited liquidity prevented prices from falling too far. In Southern and East African markets, phosphate availability is good, with both MAP and DAP available at the main import centres.
Potash: Even though prices are expected to rise, the current prices remain stable. Consumption in China and India remain decent and the annual contracts that set prices expire at the end of December. Potash producers are thus targeting increases for early 2025.
*CFR: Cost and Freight terms
Sources: FCurve /F Curve Insight
https://www.grainsa.co.za/upload/report_files/Chemical-and-Fertilizer-Report-Aug-2024.pdf
Monthly wholesale fuel price
According to the Automobile Association (AA) the diesel and illuminating paraffin prices are expected to increase slightly in December. The petrol price, however, is expected to decrease slightly.
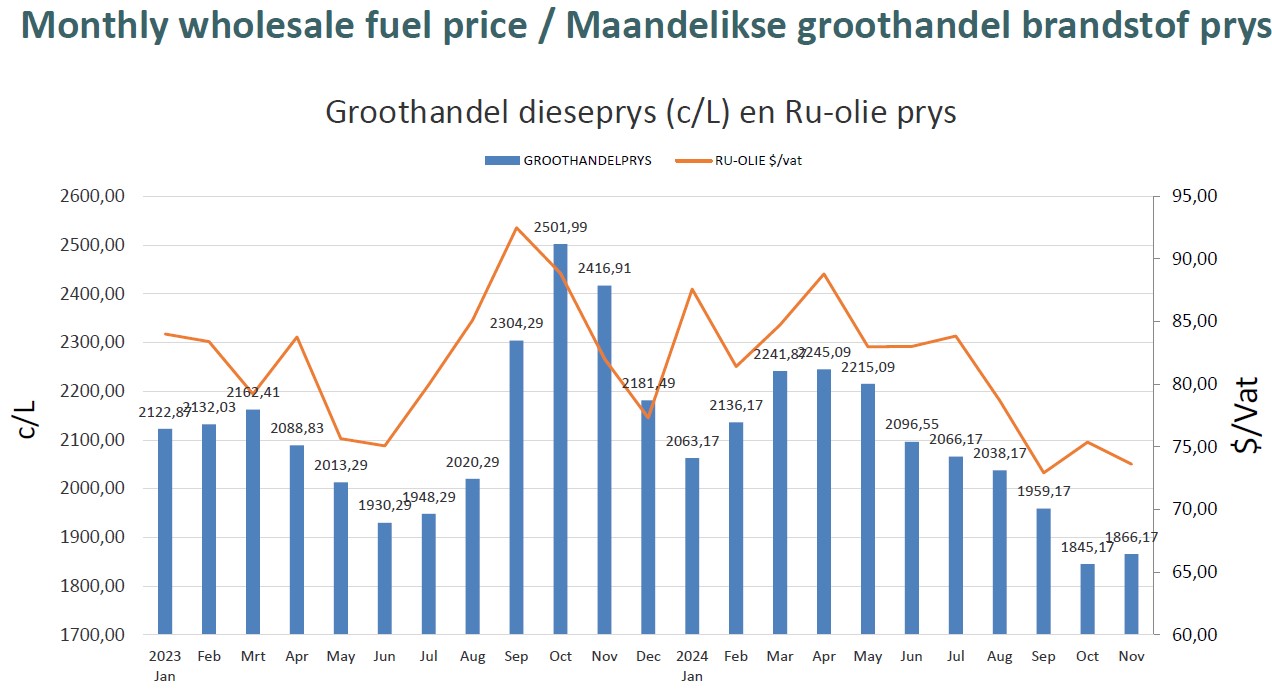
Source: Grain SA
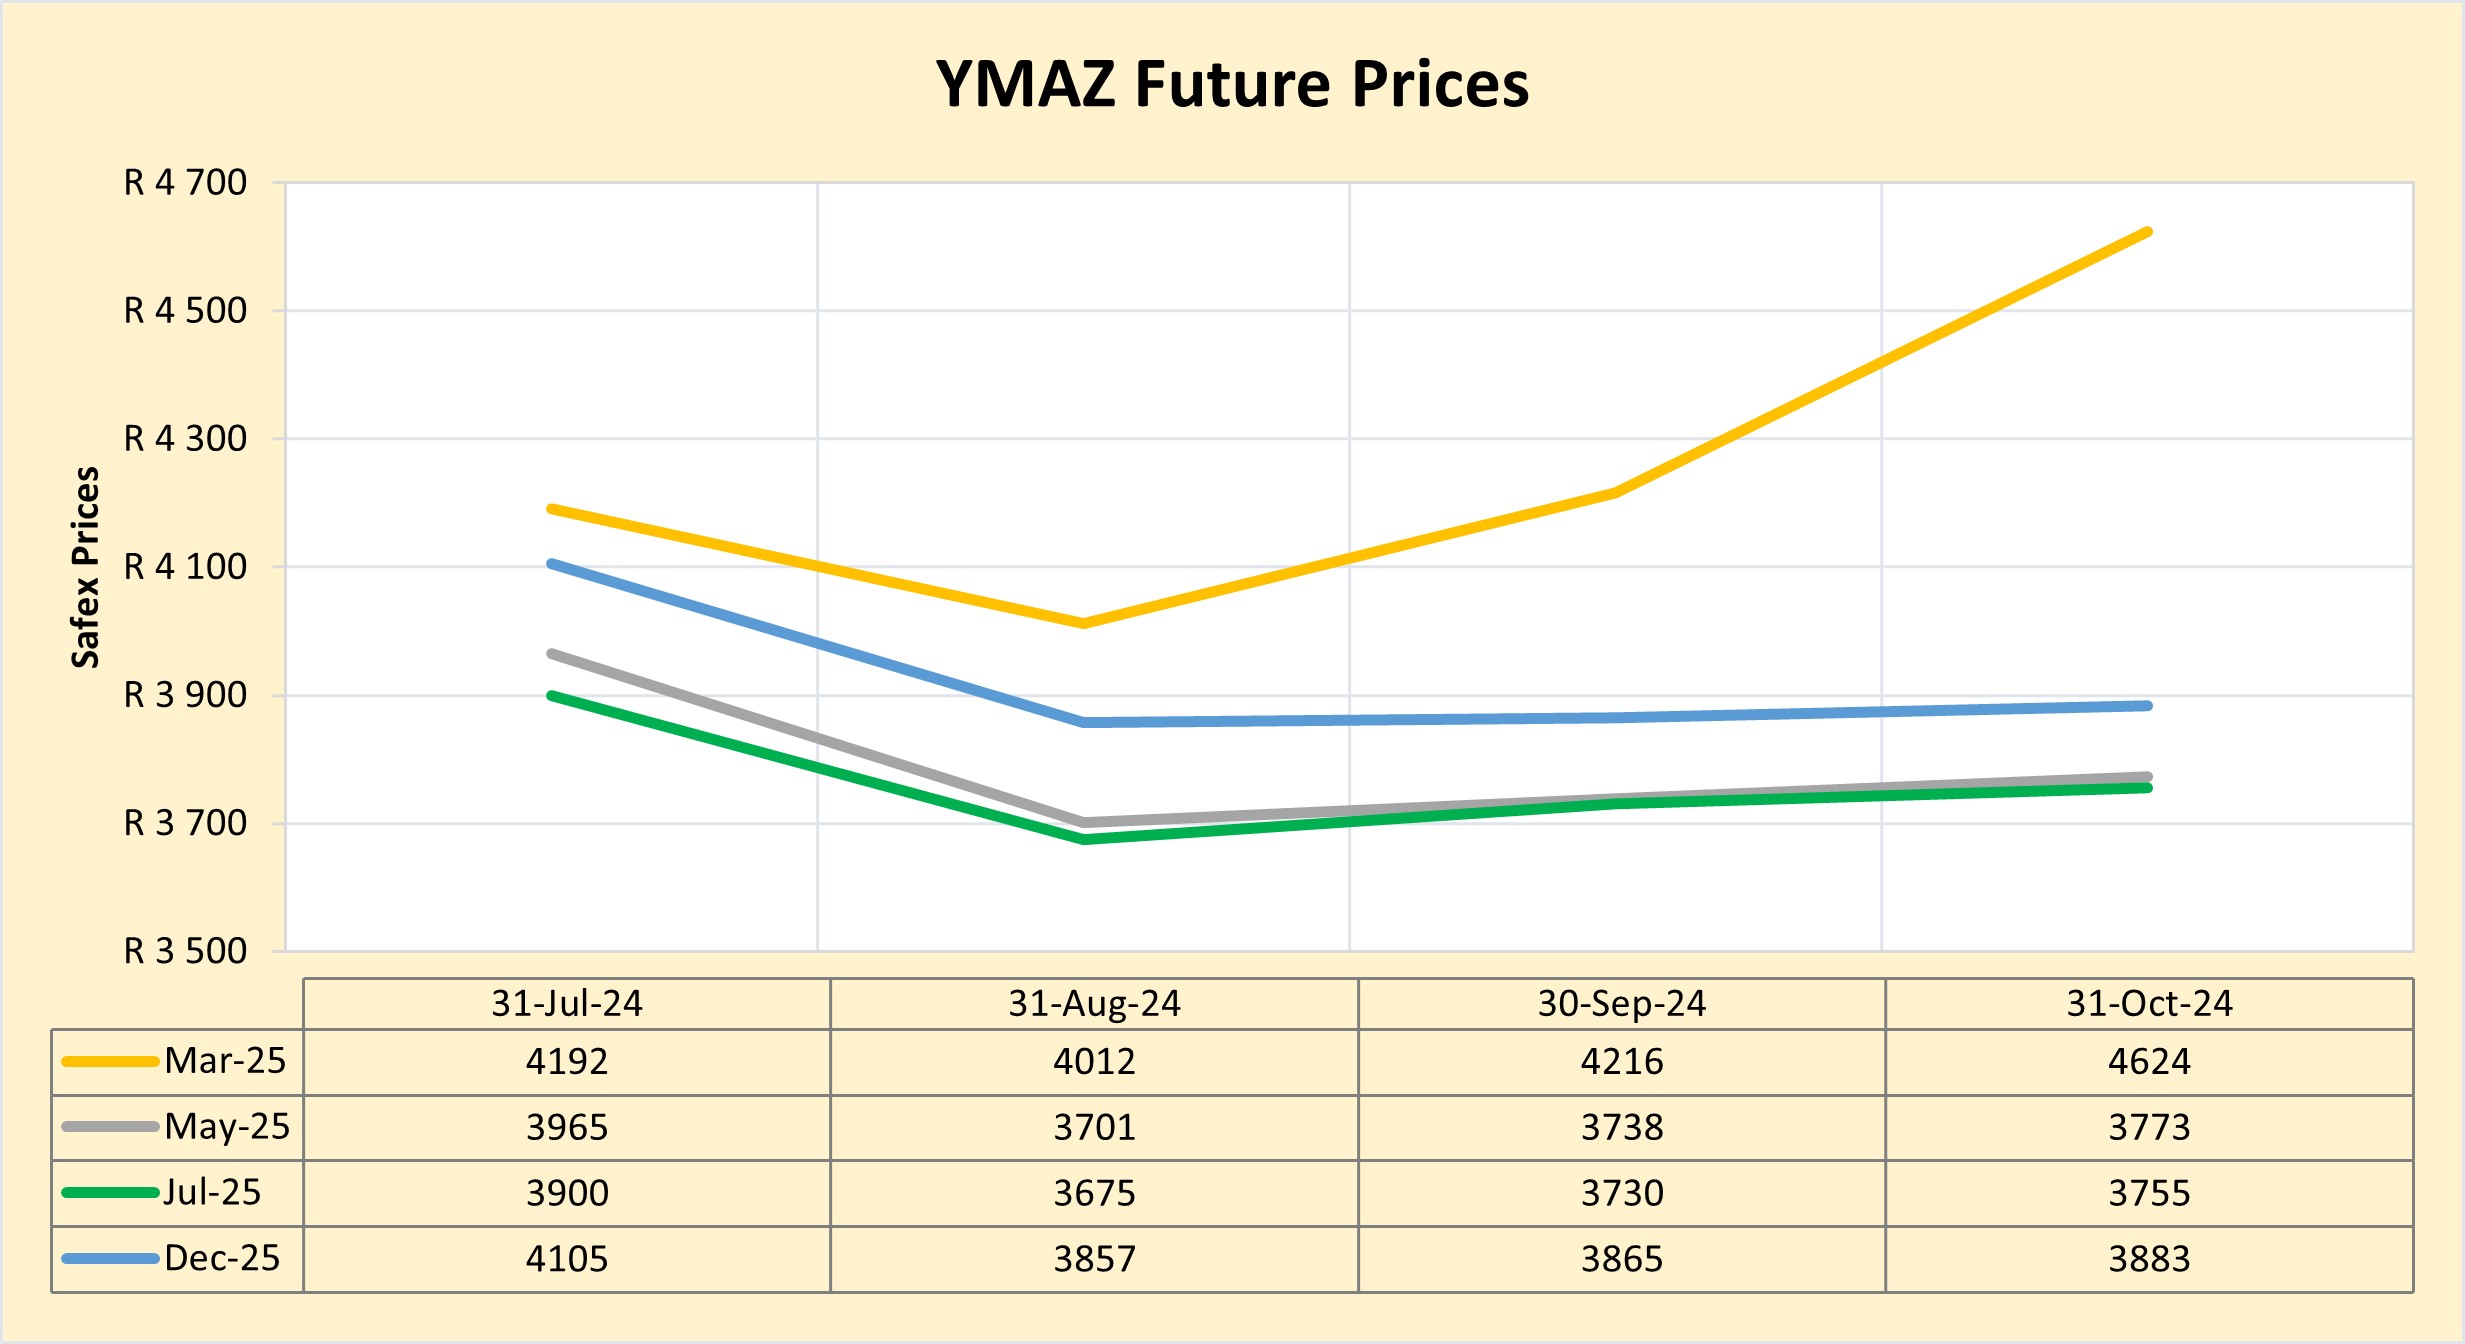
Future prices
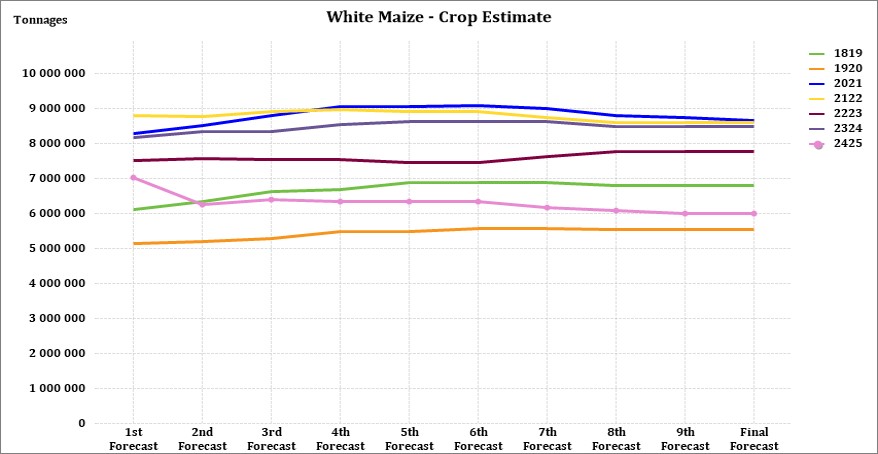
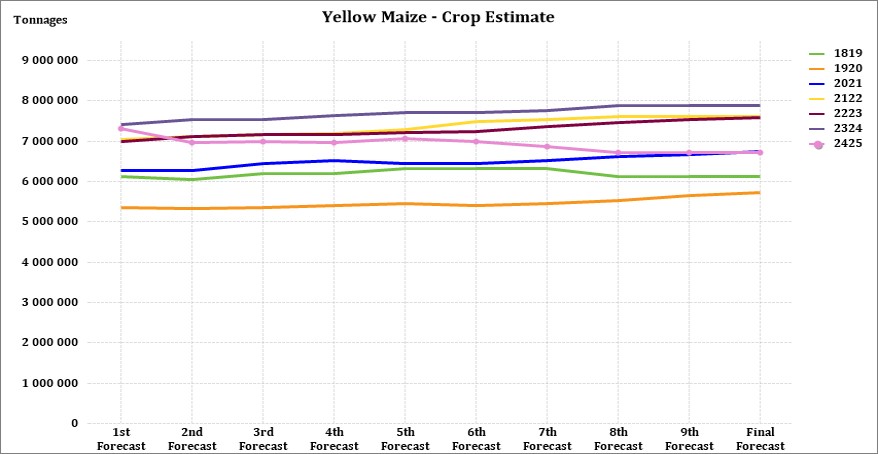
The graphs below illustrate the market sentiment for maize, in the form of future contracts, for the upcoming contract months. The market sentiment is the expectation of supply and demand fundamentals relating to white and yellow maize in South Africa.
Source: Sagis/JSE
DOMESTIC MARKET OVERVIEW
In short, the market is currently trading at an import parity level for the YMAZ due to the higher demand and lower supply in the current season resulting from a weak harvest. Because there is enough market information available regarding the current season, the price level in the spot market can be easily understood, but this is not the case with the new season contracts or price levels.
Basically, a shortage of information pertaining to the new season is present, thus the new season price levels are uncertain about the market conditions yet to develop. This means the new season contracts are trading between import and export parity without certainty of which way the market will move. As more information regarding the new season develops, regarding precipitation quantity and hectares planted are confirmed, the prices will adjust accordingly. The WMAZ price level is linked to the YMAZ price level, but regarding the import and export parity we refer to YMAZ.
The current season which delivered a weak harvest tends to result in the price moving to import parity levels, while a good harvest usually causes the market to move toward export parity levels.
Sources: SAGIS/CEC/Senwes/Victor Esterhuizen, Junior Grain Trader, Grain Trading
Fraud risk
FRAUD AWARENESS
Fraud comes in many shapes and sizes, but the hassle to reclaim what was stolen remains the same. For the next few months, this section will be identifying several types of cyber fraud with an example and a few tips on prevention strategies that might come in handy one day.
Type of cyber fraud
Phishing attacks. This is a cunning strategy in which cybercriminals create deceptive emails, messages or websites that imitate legitimate organisations to steal sensitive information. These attacks exploit human vulnerability, counting on individuals to click on harmful links or share confidential details, mistakenly believing they are dealing with a trustworthy source.
Cyber fraud example: Email phishing is the most common phishing form. Attackers send fraudulent emails that seem to come from legitimate sources. These emails often include links to fake websites or malicious attachments intended to steal sensitive information. In some instances, attackers impersonate companies or executives, targeting employees or potential job candidates.
Prevention strategies
Be wary of unexpected communications. Approach unsolicited emails, messages or calls with caution, particularly if they ask for sensitive information. Always verify the authenticity of the communication through official channels before responding.


