
The NWK Limited external factors report provides an overview of the main external factors that NWK and its clients are exposed to at a specific point in time. This report opts to aid in a timely basis to foresee external market and other factors that may have an impact on any business and clients. The main focus of this document is to have a closer look at external factors that can affect any business and our customers.
Executive summary
External factors that can affect any business and its customers include various economic factors. This report will focus on monthly or quarterly changes of these economic factors.
The inflation rate held steady at 2,8% in May 2025, matching April’s five-year low. Retail trade rose sharply 5,1% in April 2025. The unemployment rate rose to 32,9% in the first quarter of 2025. The GDP growth for the first quarter of 2025 expanded with 0,1%, following a revised 0,4% contraction in Q4 of 2024. The Policy Uncertainty Index went much further into negative territory to 78,6 in Q1 2025 compared to 65,7 in Q4 2024.
External factors of great concern to any agricultural business are the weather and climate outlooks. These factors include long term climate risks, such as drought and heat stress, as well as the current status of the El Niño and La Niña climate phenomenon. The El Niño Southern Oscillation (ENSO) is currently ENSO neutral, neutral conditions are expected to persists until spring.
The National Agricultural Marketing Council (NAMC) projected the ending stock for 30 April 2026 for white and yellow maize to be more than that of the 2024/2025 marketing season. The projected soybean ending stock for February 2026 is 219 779 t, that is more than the final for the 2024/2025 season of 140 704 t. The projected sunflower ending stock for February 2026 is 65 229 t, that is less than the final for the 2024/2025 season of 72 789 t.
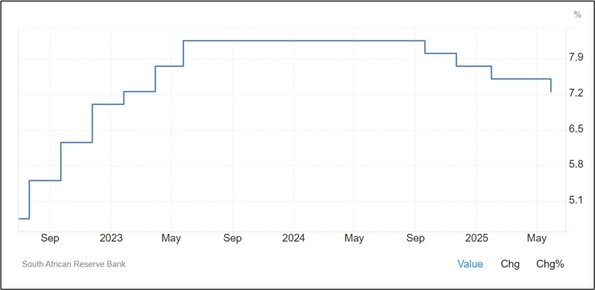
During the previous Monetary Policy Committee (MPC) meeting held on 29 May the committee decided that interest rates will remain the same. The repo rate is currently 7,25% and the prime rate 10,75%.
Business climate: Key risk drivers
A few highlights regarding certain risk drivers are mentioned below.
According to Trading Economics, South Africa’s annual inflation rate remained steady at 2,8% in May 2025. The inflation rate is expected to be 2,6% by the end of this quarter. In the long-term, the South Africa Inflation Rate is projected to trend around 4,2% in 2026 and 4,4% in 2027, according to Trading Economics.
Brent crude oil monthly average prices decreased by $3,75 per barrel. Iron ore decreased by $1,18 per metric ton on a monthly average.
South Africa’s retail trade increased to 5,1% compared to over a year ago in April 2024, following a 1,2% decrease the month prior. According to Statistics SA, South Africa’s unemployment rate fell slightly to 32,9% in Q1 2025.
The GDP growth rate increased by 0,1% in the first quarter of 2025. Four of the ten industries experienced an increase. The agriculture sector was the largest positive contributor, increasing by 15,2%.
The Safex maize prices decreased month-on-month by about 9%, undermined by the expected production recoveries for the 2024/2025 production season. Prices are expected to show a slight downward trend in the coming months, with declines likely to accelerate as maize deliveries begin.
The El Niño–Southern Oscillation (ENSO) is currently ENSO Neutral. As of mid-May 2025, the equatorial Pacific is in an ENSO-neutral state. Neutral conditions are predicted to persist until at least November 2025. The solar cycle is in an upward trend for the current eleven-year cycle which means possible more rain for the following season to come. The turning point is predicted to be in 2025.
The Policy Uncertainty Index (PUI) eased to 75,9 in Q2 2025 compared to its record high of 78,6 in Q1 2025. Externally, while the global outlook is highly uncertain, in the trade front there has been partial respite as the US administration has suspended most, but not all, tariff hikes until July 9, pending further negotiations. Internally, although there have been some positive developments, they were outweighed by negative factors.
Sources: https://tradingeconomics.com/south-africa/inflation-cpi
https://tradingeconomics.com/commodity/brent-crude-oil
https://tradingeconomics.com/south-africa/unemployment-rate
https://www.statssa.gov.za/?page_id=737&id=1
https://tradingeconomics.com/south-africa/gdp-growth
https://agrink.co.za/downloads/ABSA%20Agri%20Trends%20Grains%20and%20Veggies.pdf
https://tradingeconomics.com/commodity/iron-ore
PUI_2025Q2.pdf
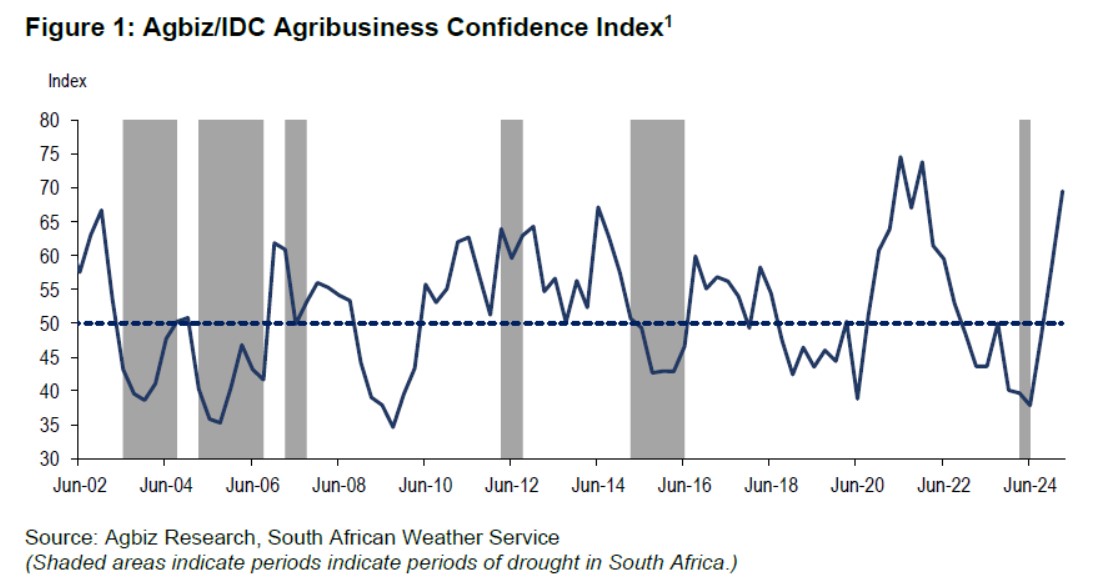
Agribusiness Confidence Index (ACI), Q3 2024
The Agricultural Business Chamber (Agbiz) conducts a quarterly survey to compile the Agribusiness Confidence Index (ACI), reflecting the views of at least 25 decision-makers in the agricultural sector. Released on 17 March 2025, the latest index evaluates ten critical factors impacting agribusiness: turnover, net operating income, market share, employment, capital investment, export volumes, economic growth, general agricultural conditions, debtor provisions for bad debt, and financing costs.
After a notable uptick in Q1 2025, the Agbiz/IDC Agribusiness Confidence Index (ACI) fell by five points in Q2 2025 to 65. Most respondents pointed to the uncertain global trade environment, lingering geopolitical tensions, and the domestic animal disease challenge as some of the key factors constraining the sector.
Despite the slight decline, the current level of the ACI, implies that South African agribusinesses remain optimistic about business conditions in the country. The better summer rains and improvements at the ports which have enabled exports with minimal interruptions, are some of the positives. This survey was conducted in the second week of June, covering various agribusinesses operating in all agricultural subsectors across South Africa.
DISCUSSION OF THE SUBINDICES
The ACI comprises ten subindices; six of them declined in Q2 2025, while the rest remained unchanged. Here is the detailed view of the subindices:
The turnover subindex confidence is down by 5 points to 55 in Q2 2025. We observed a deterioration in sentiment among agribusinesses operating in the red meat sector, while others maintained a roughly unchanged view from the previous quarter. Similarly, the net operating income subindex fell by 5 points to 65 points in Q2 2025. The drivers were the same as the turnover.
The sub-index measuring export sentiment volume fell by 40 points to 60 in Q2 2025. This is still a relatively favourable level. For example, in Q1 2025, South Africa’s agricultural exports totalled US$3,36 billion, up 10% from the same period a year ago, according to data from Trade Map. Thus, the decline in sentiment in Q2 is a normalisation.
The general economic conditions subindex fell by 15 points to 50 in Q2 2025. This indicates concerns about growth prospects this year due to both domestic and global constraints.
The market share of the agribusiness subindex fell by 5 to 65 points in Q2 2025. Most respondents maintained an essentially unchanged view, which enabled the high base to lead to a mild decline in sentiment.
Unchanged view
The employment subindex remained flat from the previous quarter at 55 points in Q2 2025. The generally favourable sentiment reflects the upbeat production conditions in field crops and horticulture.
The capital investments subindex was unchanged from Q1 2025 at 75 points. This is unsurprising, as high-frequency data, such as tractor and combine harvester sales, have remained strong in the first five months of this year.
The general agricultural conditions subindex was unchanged from Q1 2025 at 75 points. This is unsurprising, as high-frequency data, such as tractor and combine harvester sales, have remained strong in the first five months of this year.
Changes in interpretation
The subindices of the debtor provision for bad debt and financing costs are interpreted differently from the abovementioned indices. A decline is viewed as a favourable development, while an increase signals growing financial strain.
In Q2 2025, the financing costs indices increased by 10 points to 85. This came as a surprise, as the easing interest rates in the country would have made the financing environment better.
However, the debtor provision for bad debt was unchanged from Q1 2025 at 50. The subindex remaining at this level suggests that some farmers may still face financial pressures from the previous season, and there will likely be more from the livestock industry, which is currently struggling with foot-and-mouth disease.
Concluding remarks
The Q2 2025 ACI results show continued optimism in South Africa’s agricultural sector, though recovery is expected to be uneven due to animal disease in some subsectors. Geopolitical concerns highlight the sector’s reliance on exports and the need to diversify into markets like China, India, Saudi Arabia, and Egypt, while maintaining access to existing ones in the EU, UK, Africa, Asia, the Middle East, and the Americas.
Agbiz chief economist Wandile Sihlobo emphasizes the importance of public-private collaboration to address biosecurity, improve infrastructure and municipal management, and implement the Agriculture and Agro-processing Master Plan for long-term growth.
ISSUED BY:
Wandile Sihlobo
Chief Economist, Agricultural Business Chamber of South Africa (Agbiz)
E-mail: wandile@agbiz.co.za
Source: https://agbiz.co.za/content/economic-research?page=agribusiness-confidence
Fact of the month
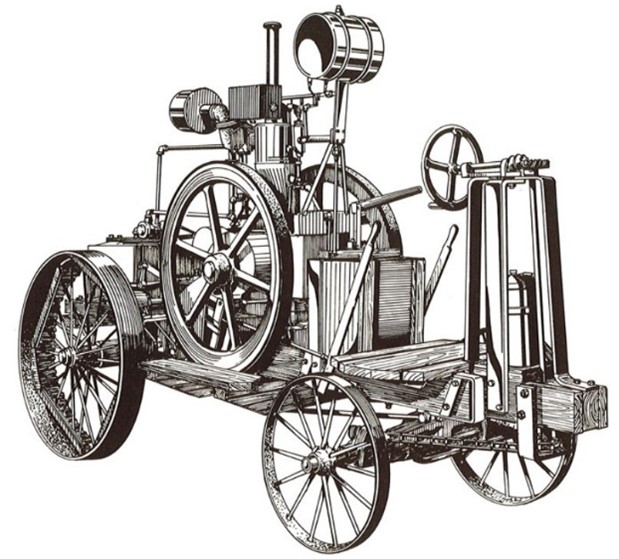
In 1892, Froelich achieved a significant breakthrough: He developed a petrol-powered tractor that was functional and reliable. This machine combined a petrol engine with a traction drive, making it more mobile and efficient than its steam-powered predecessors, the petrol-powered tractor could be driven both backward and forward. The word tractor is short for traction motion.
Source: https://www.brightmaize.com/john-froelich-evolution-of-tractor/
https://www.farm-equipment.com/articles/4269-timeline-of-ag-equipment-firsts
https://agriculture.basf.com/global/en/media/public-government-affairs/did-you-know/stories/The-word-tractor-comes-from-traction-motor
Weather and climate
NATIONAL ASSESSMENT
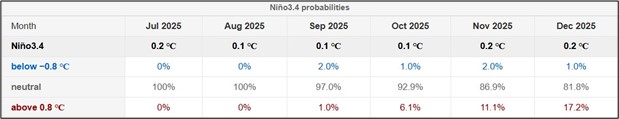
As of mid-June 2025, the equatorial Pacific remains in an ENSO-neutral state, with sea surface temperatures in the Niño 3.4 region close to average. The IRI ENSO plume forecast indicates a high probability (84%) of ENSO-neutral conditions for Jun to Aug 2025. These neutral conditions are expected to persist through the end of the forecast period. For later seasons (Oct to Dec and Nov to Jan), the probabilities for ENSO-neutral decrease slightly to 49% and 48%, respectively, but remain higher than those for either La Niña or El Niño.
Looking ahead to the 2025/2026 period, ENSO-neutral once again becomes the dominant category, with probabilities of 50% for Dec to Feb, 55% for Jan to Mar, and 66% for Feb to Apr 2026, compared to La Niña and El Niño.
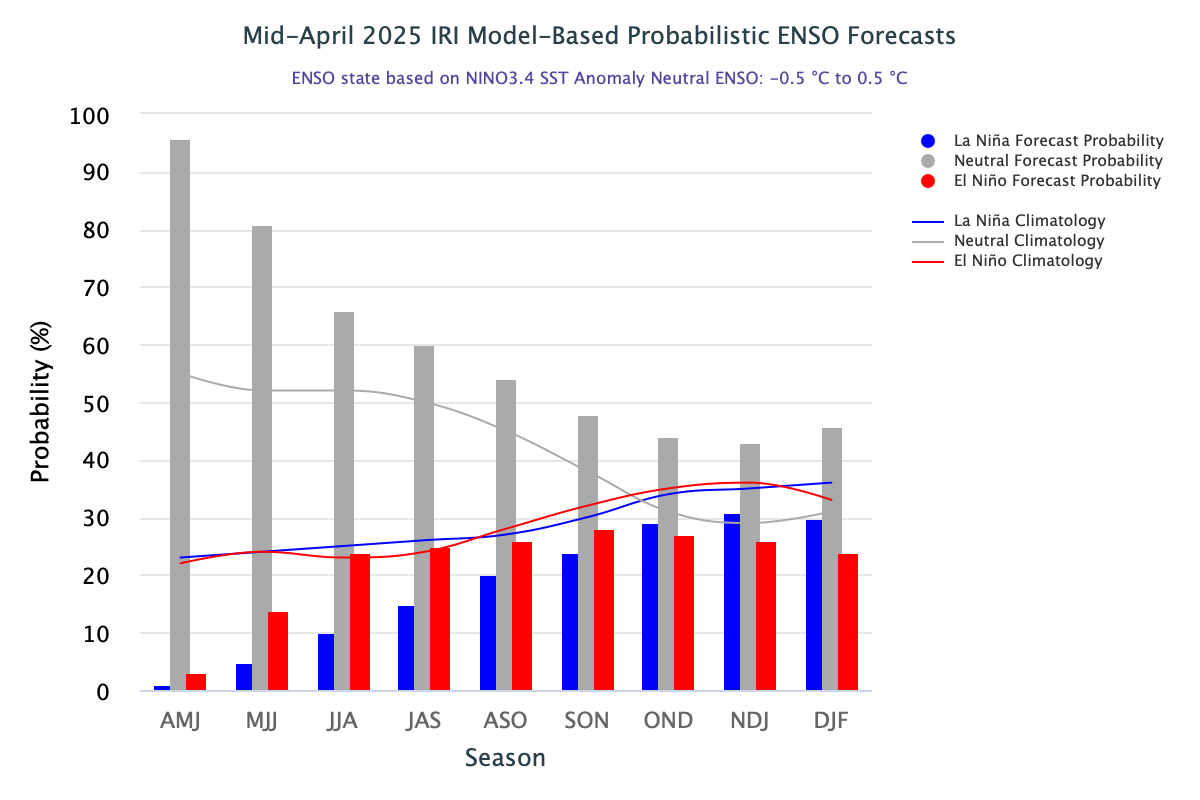
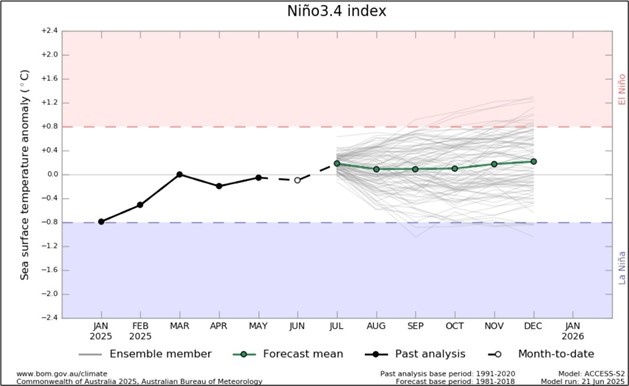
The Bureau of Meteorology’s model suggest SSTs are likely to remain within the ENSO-neutral range (−0.8 °C to +0.8 °C) throughout the forecast period to December 2025.
The graph below reflects the current neutral conditions and the ocean temperatures that are substantially above average, but still within the ENSO neutral range. The graph supports the prediction of an ENSO-neutral state throughout the forecast period to December 2025.
The latest Climate Watch issued by the SA Weather Service (04 June 2025) states that above-normal rainfall is predicted for the southwest and eastern coastal regions of the country during mid-winter, which will likely have a positive impact on crop and livestock production. However, below normal rainfall is expected for the south-western part in late-winter and early spring, which could have a negative impact on agriculture. Therefore, the relevant decision-makers are encouraged to advise farmers in these regions to practice soil and water conservation, proper water harvesting and storage, and other appropriate farming practices.
Minimum and maximum temperatures are largely expected to be above-normal for the most parts during the winter season, with the notable exception of the southern coastal areas that are expected to see parts of it be below-normal.
Source: https://www.weathersa.co.za/Documents/SeasonalForecast/SCOLF202503_31032025122337.pdf
SUNSPOTS
Sunspots are darker, cooler areas on the sun’s surface that arise due to disturbances in the sun’s magnetic field. Sunspots vary in numbers throughout the 11-year solar cycle.
According to a study published on Science Direct the rainfall rate can be directly related to the sunspot number, but shows different characteristics during solar maximum (the peak of the sun’s 11-year solar cycle) years. Though a lag correlation exists between sunspot number and rainfall, sunspots have an increasing effect on rainfall. Studies show that the more sunspots are present the higher the rainfall and the less sunspots the lower the rainfall.
ENSO (El Niño Southern Oscillation) occurs at irregular intervals between three and seven years causing global climate system variation. Considering this event occurs periodically, it might be triggered by the 11-year solar cycle as an energy source.
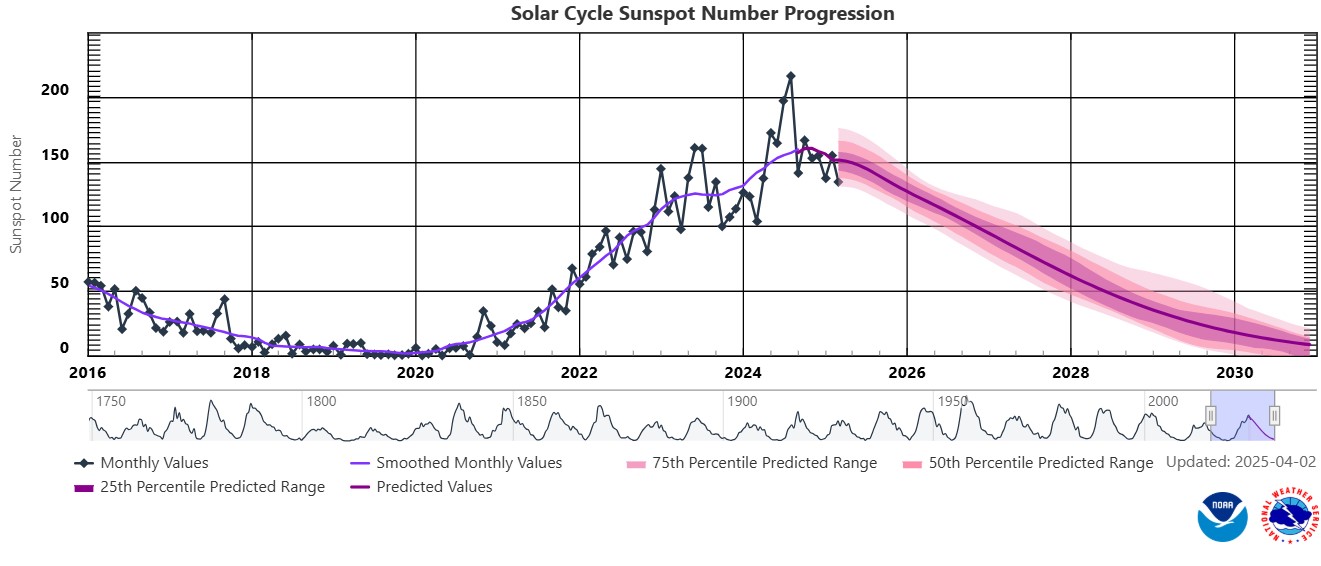
The graph below shows the latest 11-year solar cycle. An upward trajectory suggests that higher rainfall can be expected, characteristic of a La Niña. A downward trajectory suggests that lower rainfall can be expected, characteristic of an El Niña.
Since October 2020 to February 2025 the actual sunspot numbers were higher than the predicted values. May 2025 falls outside of the predicted range, with a monthly mean sunspot value for May 2025 is 79,2.
Sources:https://www.spaceweatherlive.com/en/solar-activity/solar-cycle.html https://www.sciencedirect.com/science/article/abs/pii/S136468262200116X#:~:text=It%20was%20observed%20that%20rainfall,an%20increasing%20effect%20on%20rainfall
https://www.space.com/solar-cycle-frequency-prediction-facts
https://eos.org/articles/why-did-sunspots-disappear-for-70-years-nearby-star-holds-clues https://aip.scitation.org/doi/abs/10.1063/1.4930679?journalCode=apc#:~:text=ENSO%20occurs%20at%20irregular%20interval,cycle%20as%20an%20energy%20source
Market risk
GRAIN MARKET ANALYSIS
- Ending stock – National
Ending stock data is gathered from the NAMC. The estimates are reassessed and reported by the Grain & Oilseeds supply & demand estimates committee. The following is the projected ending stock for April 2025 in tonnages for the 2024/2025 season:
- White maize => 363 481 t
- Yellow maize => 299 731 t
The following is a summary of September 2025 ending stock projections for the 2024/2025 season:
- Wheat => 728 628 t
The following is a summary of February 2025 projected ending stock for the 2024/2025 season:
- Sunflower => 62 229 t
- Soybeans => 224 779 t
- Sorghum => 79 787 t
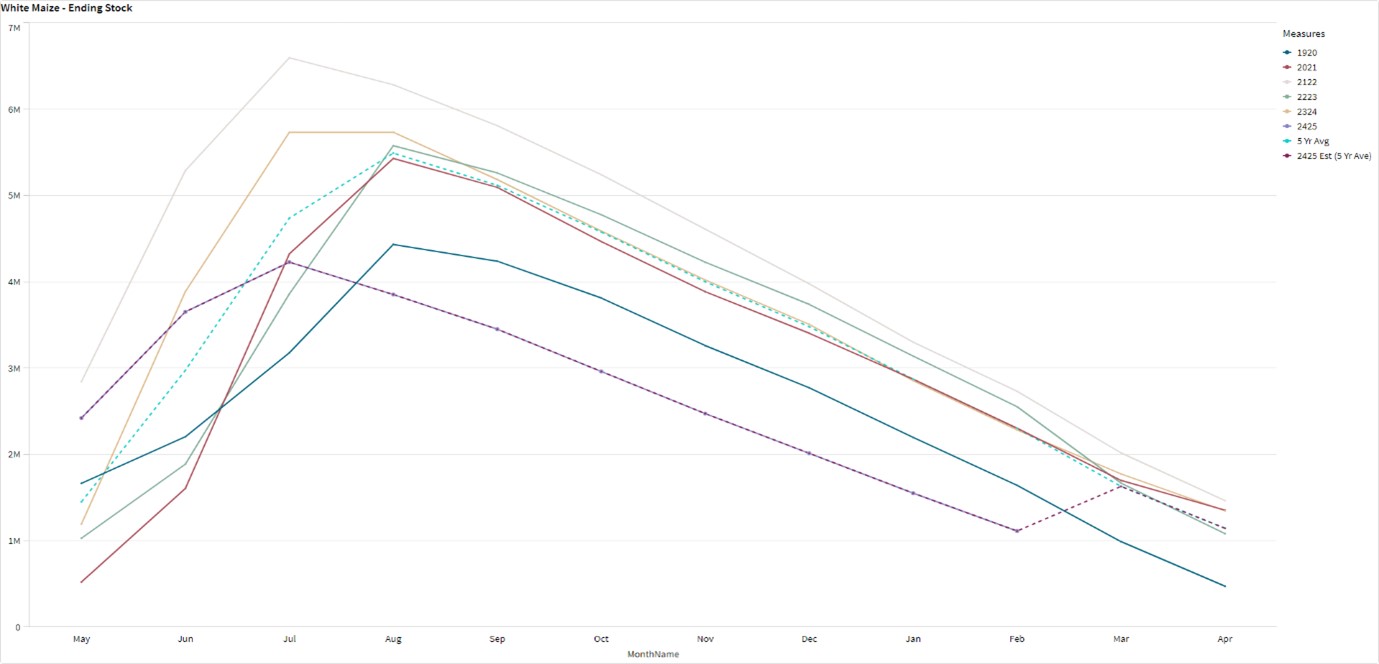
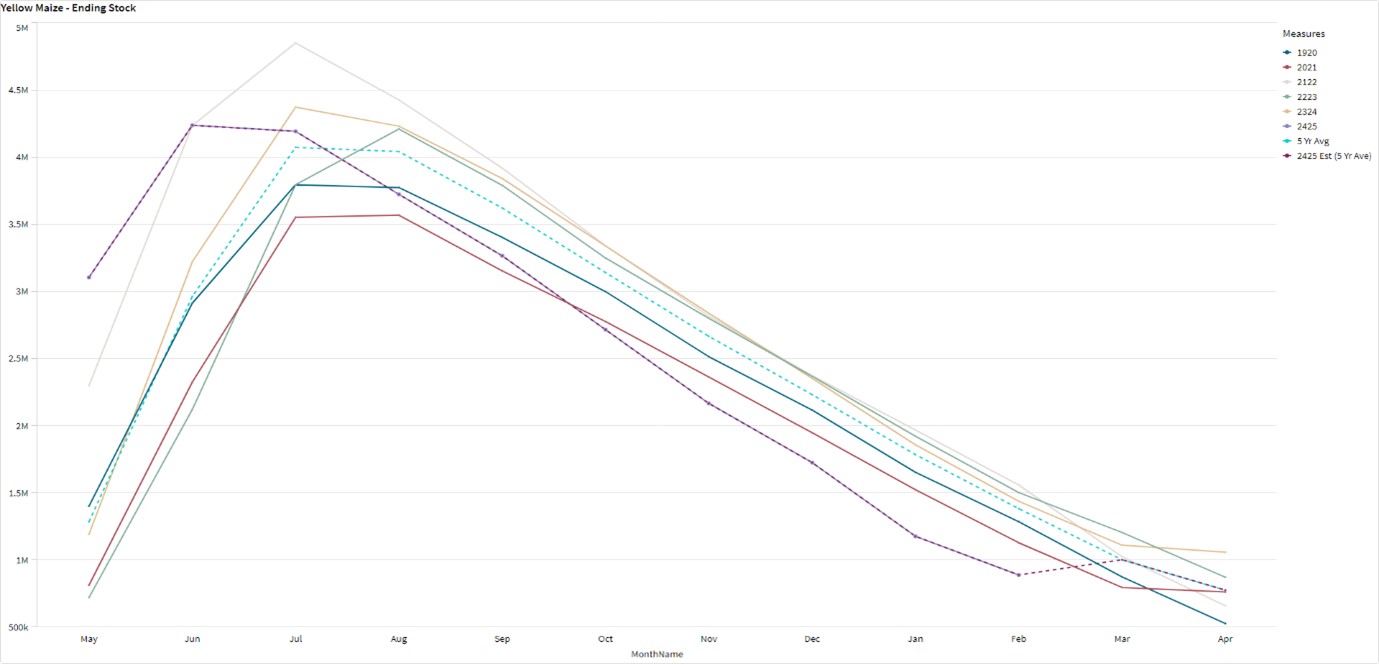
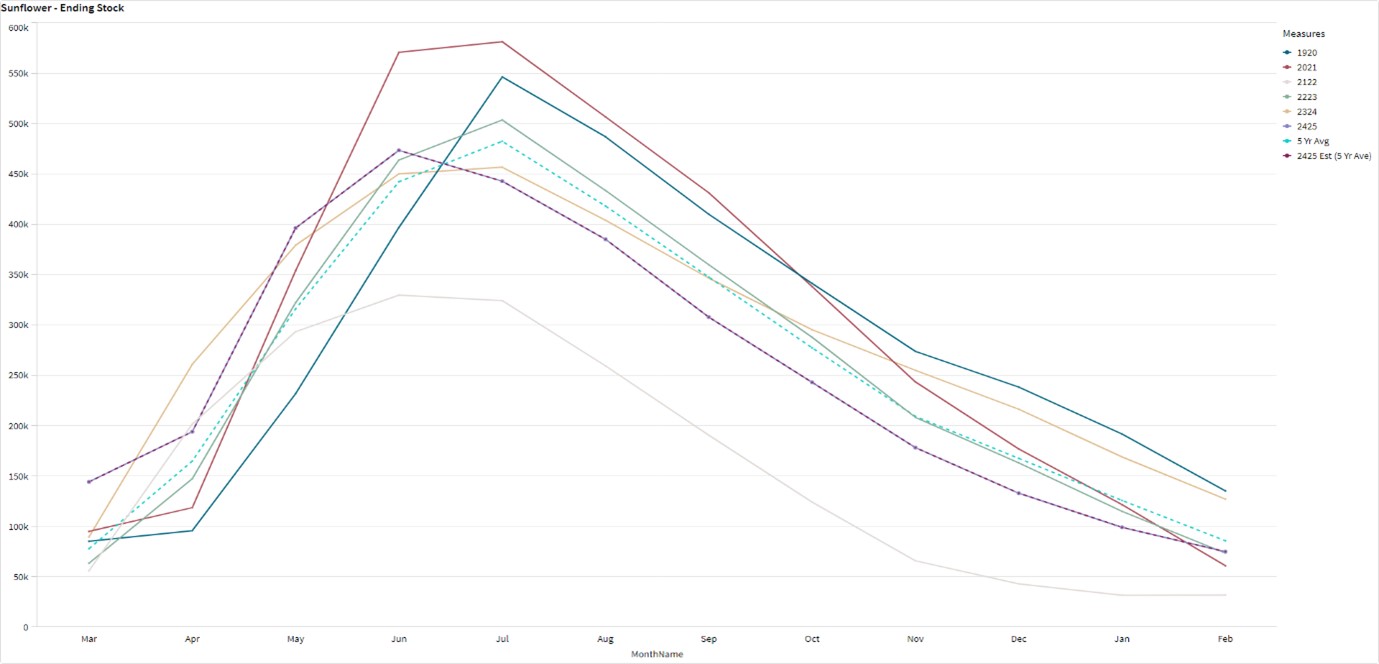
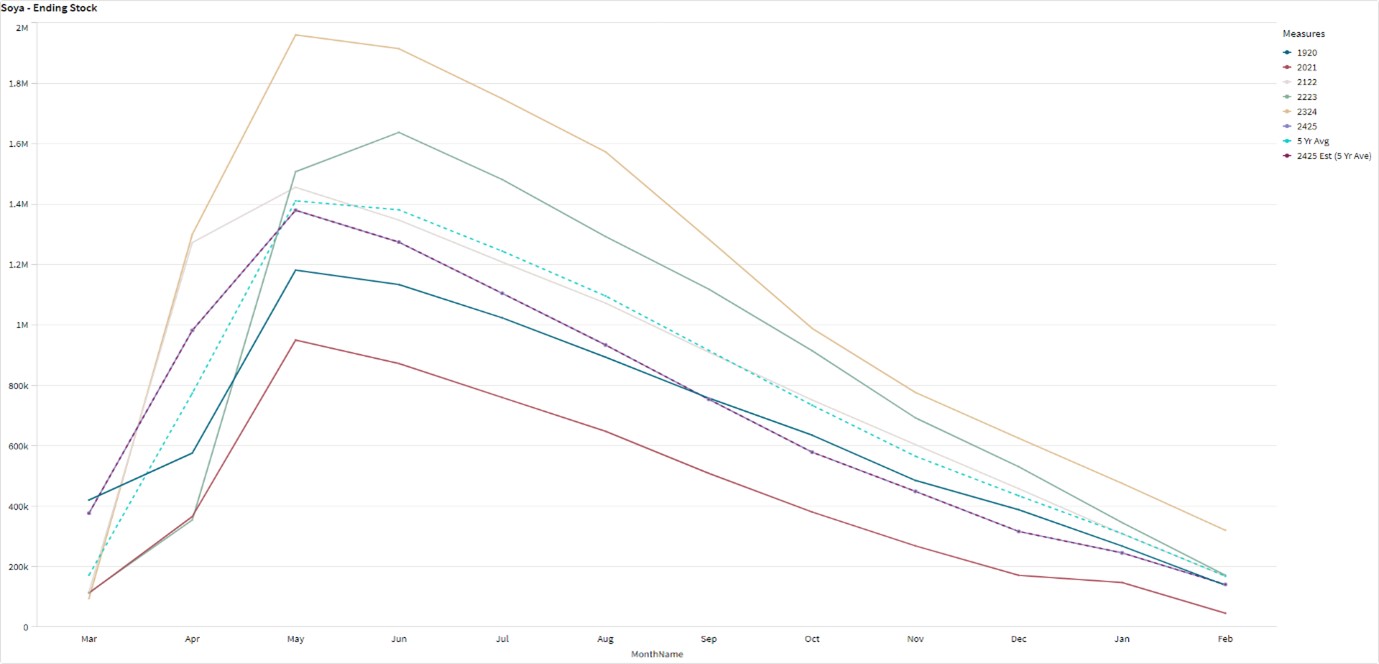
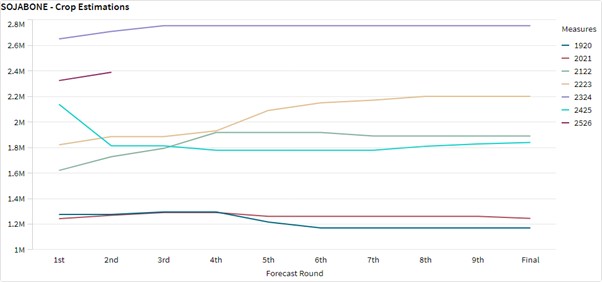
The graphs below show the predicted ending stock for the different commodities according to SAGIS data. A five-year average has been calculated to determine the estimated ending stock for the current season.
The final white maize ending stock for April 2025 is 363 481 t. That is 983 395 t less than the final ending stock for the 2023/2024 season. The final yellow maize ending stock for April 2025 is 299 731 t. That is 757 933 t less than the final ending stock for the 2023/2024 season.
The predicted five-year average sunflower ending stock for the 2025/2026 season is 452 t more than the previous season ending stock.
The predicted five-year average soybean ending stock for the 2025/2026 season is 28 832 t more than the previous season ending stock.
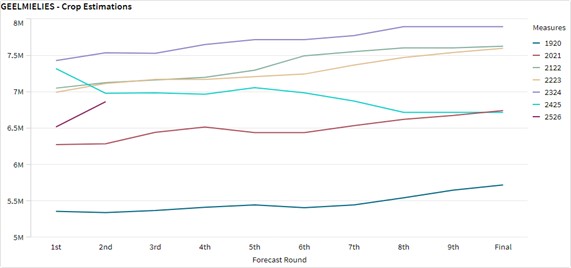
- Crop estimations
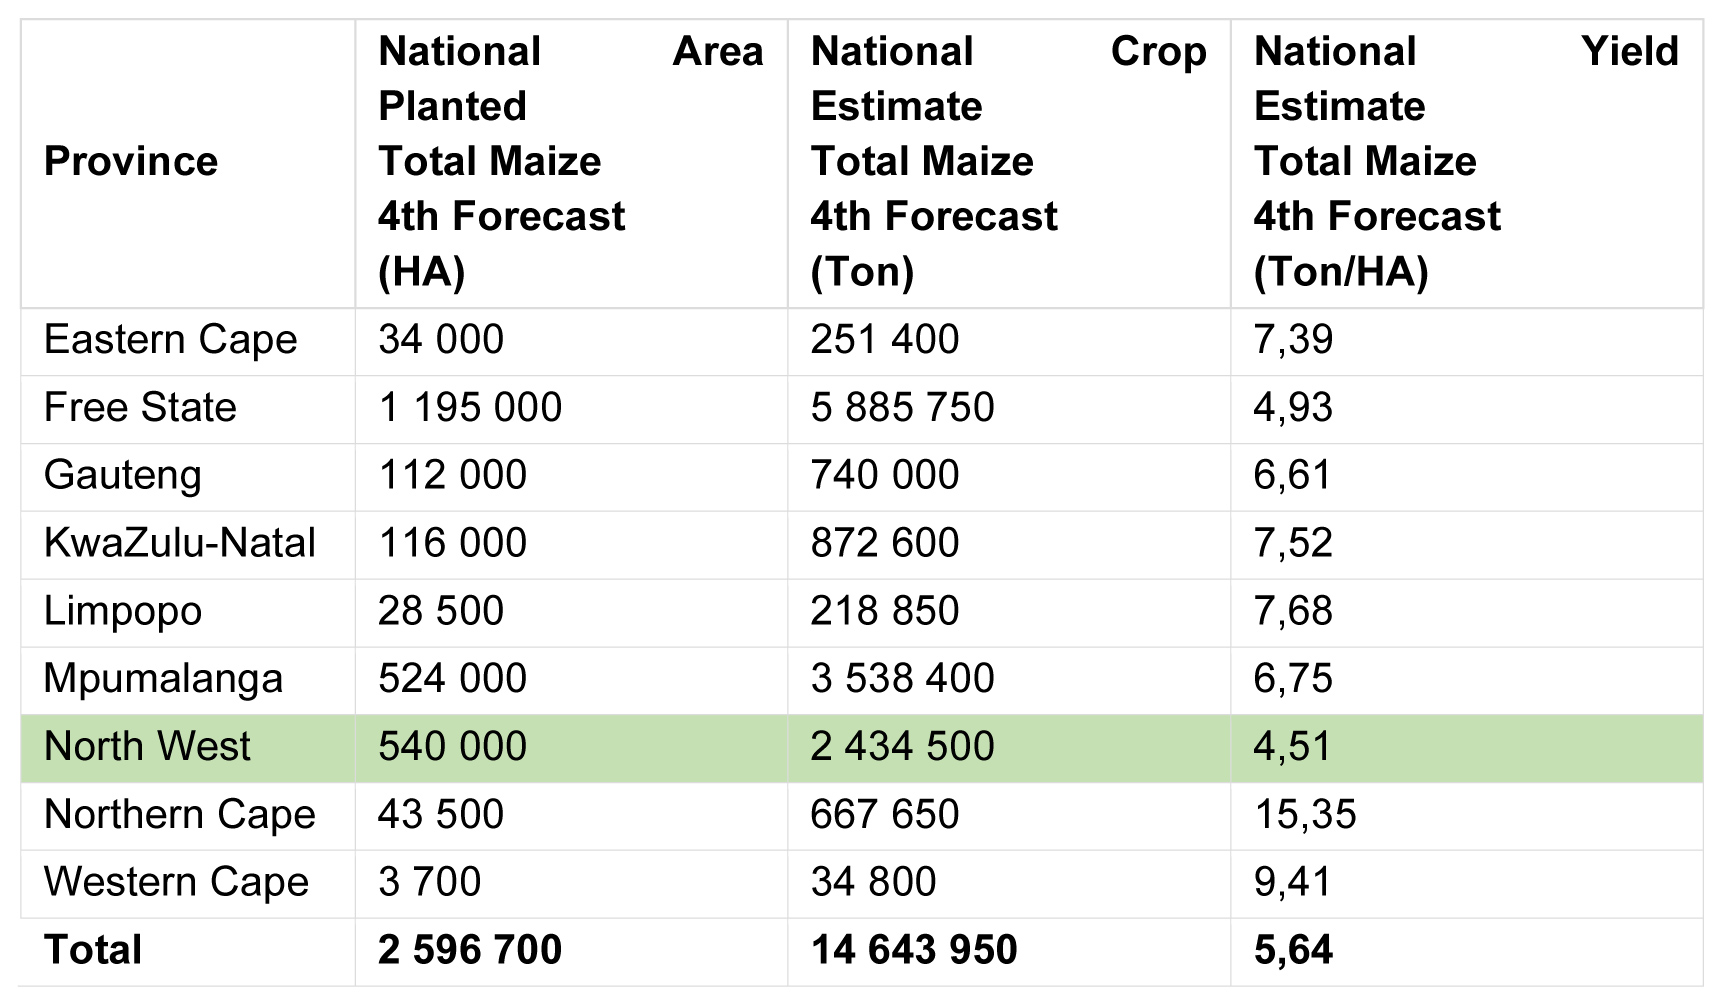
According to the Crop Estimate Committee (CEC) fourth production forecast for 2025, the total area estimate for maize in South Africa is 2,596 million ha, which is 1,5% less than the actual 2,636 million ha planted for the previous season. The total forecasted tons for white and yellow maize are 14,64 million t from the fourth forecast.
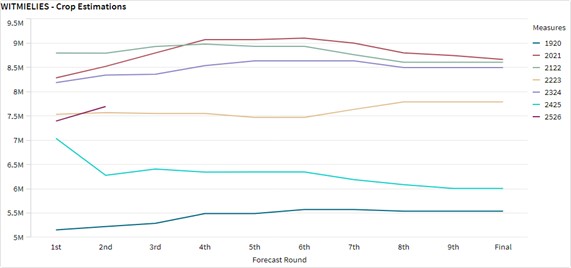
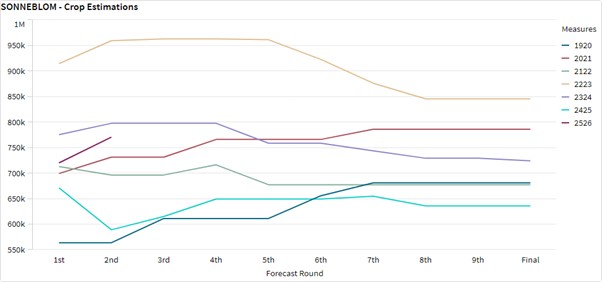
The production forecast for sunflower seed is 727 800 t. The area estimate for sunflower seed is 555 700 ha while the expected yield is 1,31 t/ha.
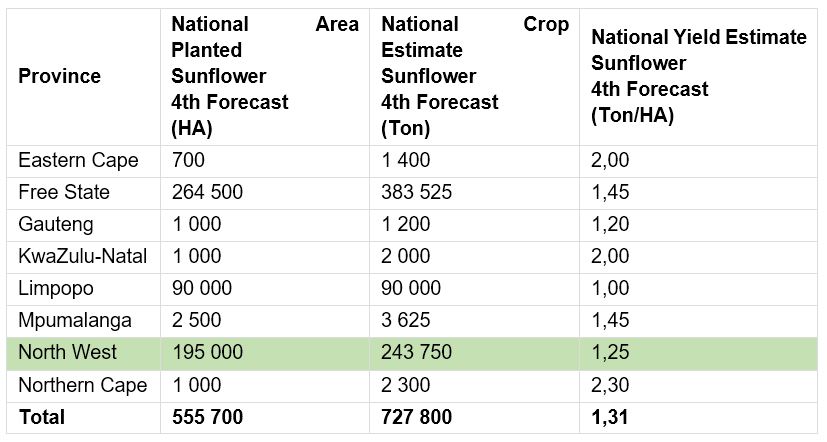
Source: CEC (Crop Estimates Committee)
The production forecast for soybeans is 2,331 million t. The estimated area for soybeans is 1,151 million ha with an expected yield of 2,03 t/ha.
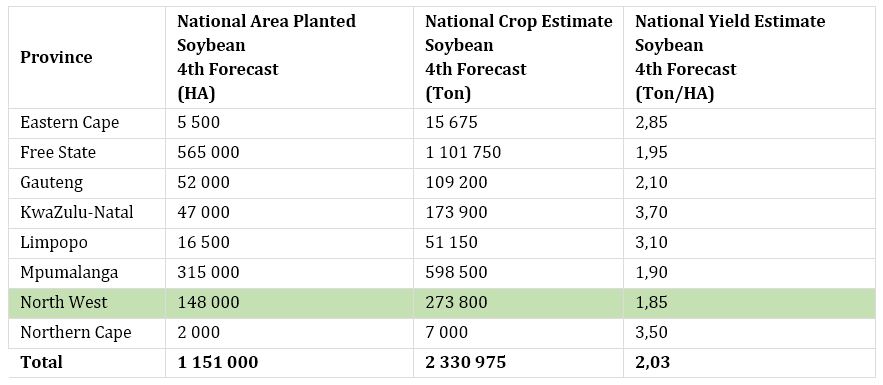
Source: CEC (Crop Estimates Committee)
- Imports and exports – National
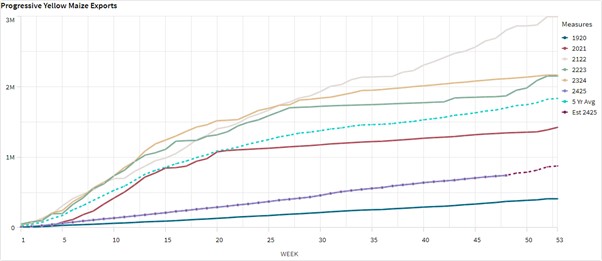
For the production season ending April 2026, 29 879 t of white maize and 35 816 t of yellow maize have been exported so far as seen in the graphs below.
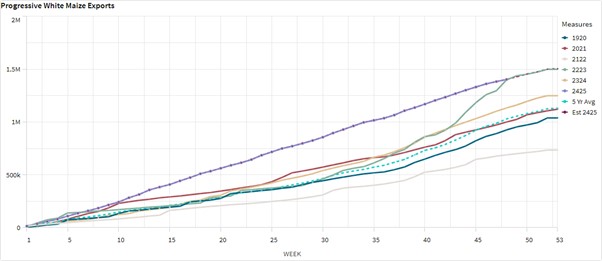
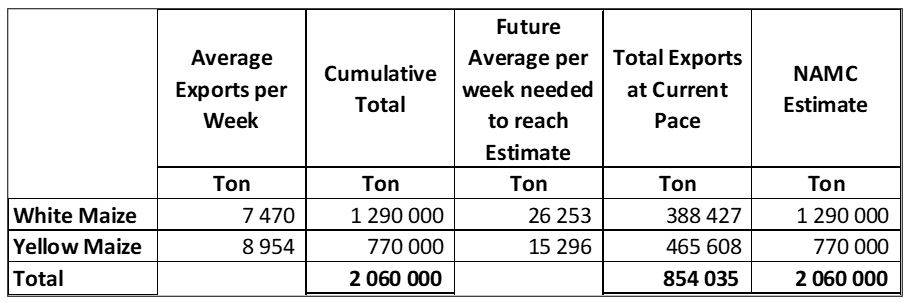
As seen in the table above, the average white maize exports per week is currently 7 470 t. Theoretically, if exports remain at the current average per week, then there would be 901 573 t less white maize exports than anticipated.
The average yellow maize exports per week are currently 8 954 t. Theoretically, if exports remain at the current average per week, then there would be 304 392 t less yellow maize exports than anticipated.
- Parity prices
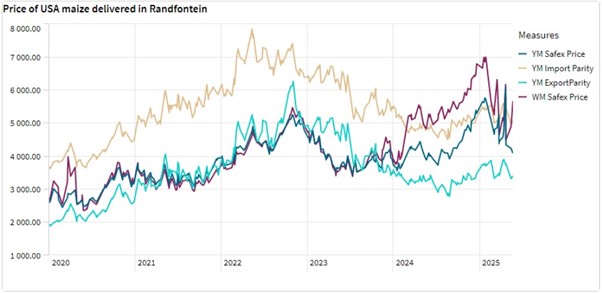
South Africa is a small producer compared to other countries and is thus a price taker (meaning that we cannot influence world prices). Because of this, our local prices are normally between import and export parity, which is illustrated in the figure below. An import parity price is defined as the price which a buyer will pay to buy the product on the world market. This price will include all the costs incurred to get the product delivered to the buyer’s destination.
An export parity price is defined as the price that a local seller could receive by selling his product on the world market e.g., excluding the export costs. The price which the seller obtains is based on the condition that he delivers the product at the nearest export point (usually a harbour) at his own expense.
The graph below reflects the Safex price, import parity and export parity of yellow maize as well as the Safex price of white maize. The import and export parity prices for white maize is not released by Grain SA for this period.
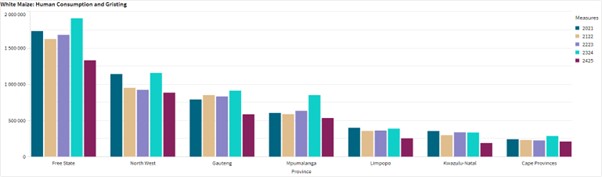
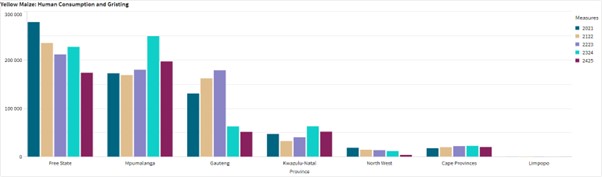
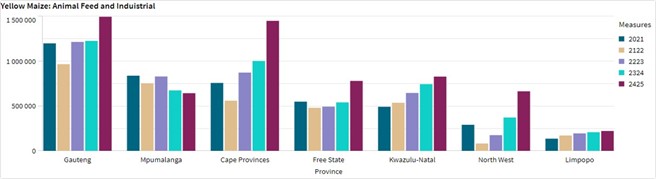
- Grain processing per province
For the marketing year 2024/2025, May 2024 to April 2025, the Free State dominates the white maize that is used for human consumption and gristing. North West consumed the second most white maize produced for human consumption for the marketing year.
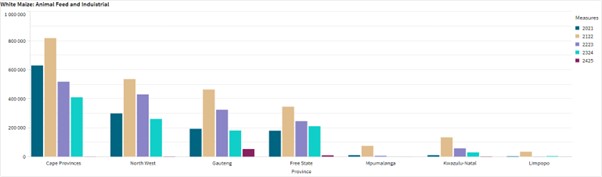
Gauteng used the most, white maize for animal feed and industrial usage with the Free State using the second most.
Mpumalanga processed the most yellow maize for consumption and gristing and Gauteng processed the most yellow maize for animal feed and industrial purposes.
NWK Group is exposed to foreign exchange rate risk in various business areas, such as commodity prices and trade imports, etc.
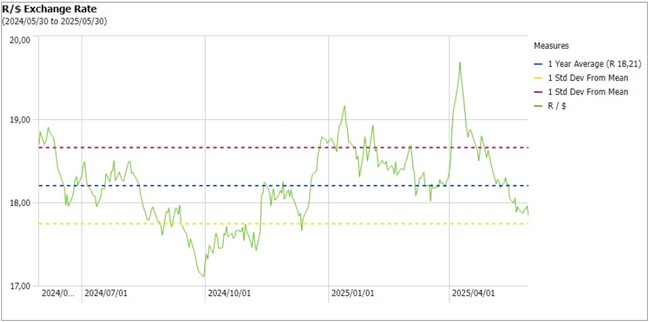
The rand traded at a monthly average of R18,09 against the dollar for the month of May, that is 0,82% better than in April. The rand touched on a five-month low of 17,75 on May 29, pressured by a firmer dollar and as prices of metal prices, particularly gold, declined. Meanwhile, traders continued to digest the South African Reserve Bank’s decision.
Source: Trading Economics.
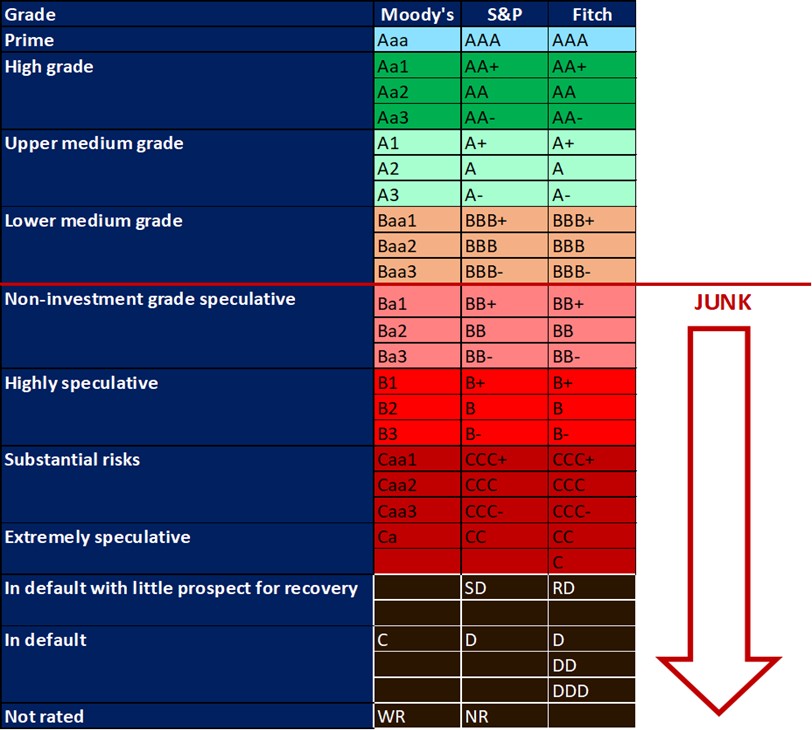
- Interest rate
On 27 March 2020, Moody’s downgraded South Africa’s sovereign credit rating to sub-investment grade and placed a negative outlook on the rating. The key drivers for this downgrade include weak economic growth, continuous deterioration in fiscal strength, and slow progress on structural economic reforms. It is now the first time in post-apartheid South Africa that all major rating agencies, i.e., Moody’s, Fitch, and S&P, have South Africa’s credit ratings in sub-investment grade territory. More than a year later and our Moody’s rating remains the same.
During the previous Monetary Policy Committee (MPC) meeting held on 29 May the committee decided that interest rates will decrease with 25-basis points. The repo rate is currently 7.25% and the prime rate is 10,75%.
Interest rate movement:
27th March 2024 – 11,75%
30th May 2024 – 11,75%
18th July 2024 – 11,75%
19th September 2024 – 11,50%
21st November 2024 – 11,25%
30th January 2025 – 11,00%
20th March 2025 – 11,00%
29th May 2025 – 10,75%
- Interest rate
The South African Reserve Bank cut its key interest rate by 25 bps to 7,25% on May 29, 2025, as widely anticipated, following a pause in March, to support a faltering economy and in response to a more favourable inflation outlook.
- Inflation rate
As the inflation rate is a driver for increases and decreases in interest rates the current rate and forecast have to be assessed to foresee further increases in the interest rate.
Current: In South Africa’s annual inflation rate held steady at 2,8% in May 2025, matching April’s five-year low. Faster price increases for food and non-alcoholic beverages (4,8% vs 4% in April), housing and utilities (4,5% vs 4,4%), and clothing and footwear (1,3% vs 1,2%) were offset by slower inflation in alcoholic beverages and tobacco (4,3% vs 4,7%), restaurants and accommodation services (1,8% vs 3%), and personal care and miscellaneous services (1,7% vs 1,6%). In contrast, transport prices declined sharply (-4,8% vs -3,9%).
Source: Statistics South Africa.
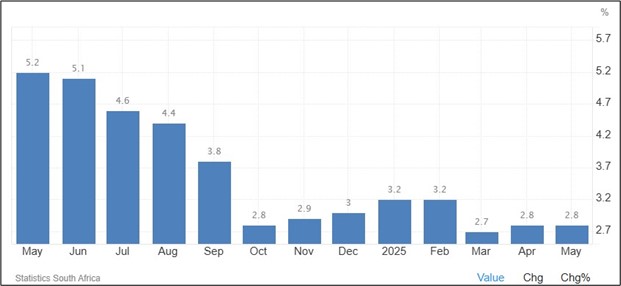
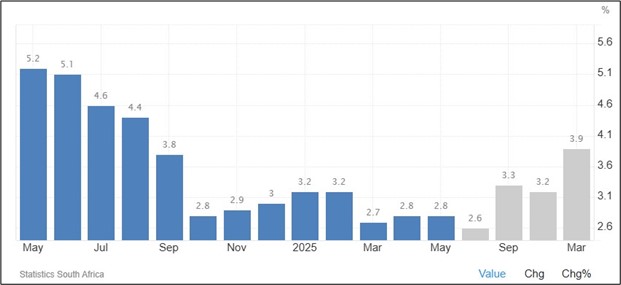
Inflation rate in South Africa remained unchanged at 2,8% in May. Inflation rate in South Africa is expected to be 2,6% by the end of this quarter, according to Trading Economics global macro models and analysts’ expectations. In the long-term, the South Africa inflation rate is projected to trend around 4,2% in 2026 and 4,4% in 2027, according to our econometric models.
Source: https://tradingeconomics.com/south-africa/inflation-cpi
Future prices
The graphs below illustrate the market sentiment for maize, in the form of future contracts, for the upcoming contract months. The market sentiment is the expectation of supply and demand fundamentals relating to white‑ and yellow maize in South Africa.
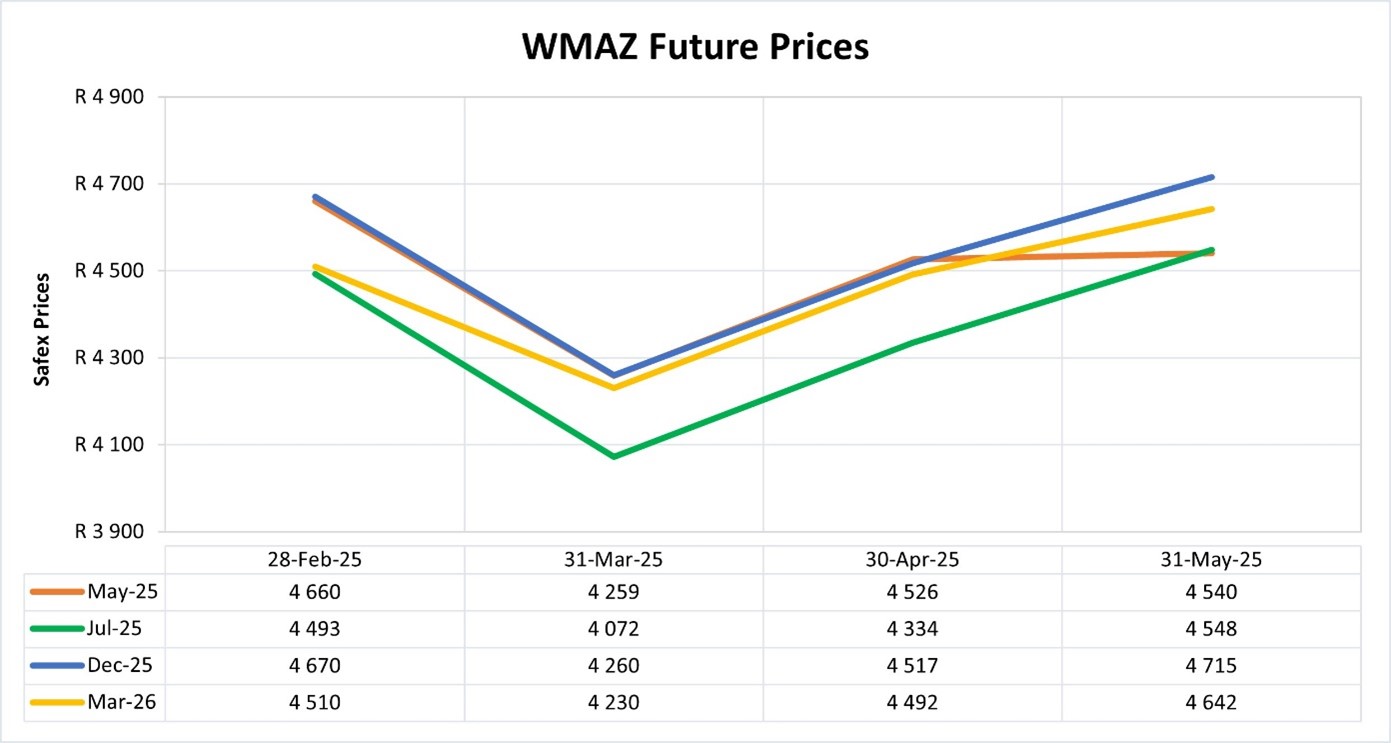
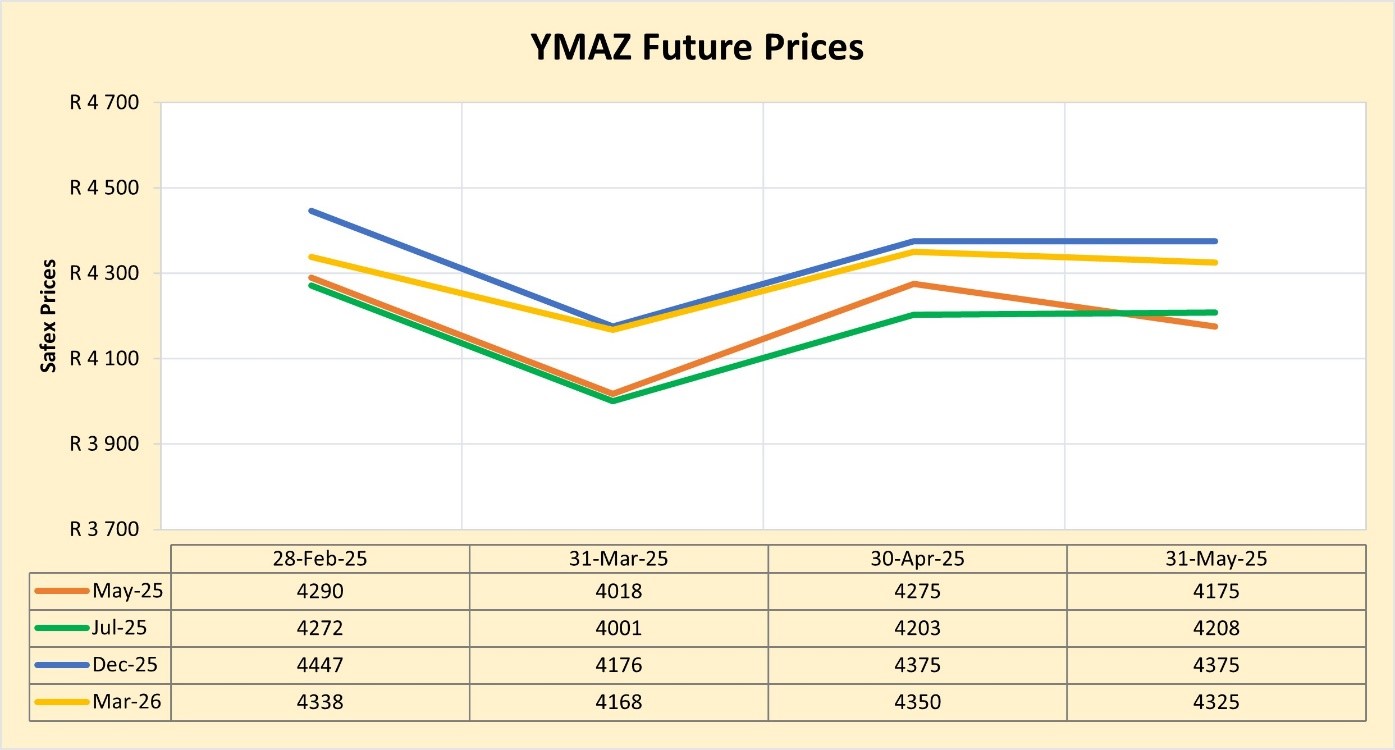
DOMESTIC MARKET OVERVIEW
Maize prices decreased in the second quarter of 2025 as production picked up. White maize prices are predicted to increase again slightly towards the end of the year with yellow maize also predicted to increase, but with less than white maize.
Fraud risk
FRAUD AWARENESS
2024 provided us with a few rare glimpses of deepfakes, voice clones and AI-generated phishing scams, some experts claim that these were merely ‘training wheels’ for fraudsters as they tested the waters. Many believe that 2025 will become the year AI scams become a dominant force with regards to draining fintech and bank accounts.
Over the next few months, we will delve into some of the AI scams believed to surge in 2025.
The second involves Pig Butchering Scams, and how scammers use AI to influence their victims.
What is a pig butchering scam? Pig butchering scams are defined as ‘an online scam that uses fake online personas to trick victims into fraudulent investments’. The term comes from the scammers’ practice of ‘fattening up’ their victims by building trust over time before ‘slaughtering’ them and stealing their money.
How pig butchering scams work:
- Scammers create a fake persona online, often posing as successful investors or attractive singles on dating apps and social media. These fake identities are carefully crafted and will use stolen or AI-generated photos and fabricated backstories to seem credible and trustworthy.
- Scammers will initiate contact through dating apps, social media and even random phone calls and texts. They make use of scripts and pre-written messages to initiate conversations and gauge receptiveness. Scammer often cast a wide net – contacting numerous potential victims hoping to find those most likely to fall for their tactics.
- Scammers spend weeks or months building trust with the victim. Engaging in frequent, friendly conversations and showing interests in the victims’ life and sharing personal stories. Sometimes scammers may send small gifts or tokens of affection.
- Once trust is established, scammer start introducing investments into the conversation, often involving cryptocurrency or alternative assets like foreign exchange. Scammers present themselves as experienced investors who want to help the victim get stared and succeed.
- Scammer prompt deposits from the victim, convincing them to download supposed investment apps or visiting fraudulent investment platforms. They walk the victim through the process of creating an account and making the initial deposit (typically small to avoid detection).
- Once the initial investment is made, they start manipulating further investments, the scammers will show manipulated data or fake reports to show huge returns on investments, encouraging the victim to invest even more money to capitalize on the supposed success.
Eventually, when the scammer has extracted as much money as possible from the victim, it becomes time to pull off the vanishing act, abruptly cutting off all contact form the victim and disappearing. The fraudulent website or app is taken offline, and the victim has no way to access their supposed investment or contact the scammer. Sometimes the scammer will use the information gained to commit identity theft or target the victim’s friends and family.
Sources
https://www.forbes.com/sites/frankmckenna/2024/12/16/5-ai-scams-set-to-surge-in-2025-what-you-need-to-know/
https://www.investopedia.com/pig-butchering-scams-8605501


