
The NWK Limited Agricultural Economic Report provides an overview of the main external factors that NWK and his clients are exposed to at a specific point in time. This report opts to aid in a timely basis to foresee external market and other factors that may have an impact on any business and clients. The main focus of this document is to have a closer look at external factors that can affect any business and our customers.
Executive summary
External factors that can affect any business and its customers include various economic factors. This report will focus on monthly or quarterly changes of these economic factors.
The inflation rate edge down to 3,6% in January 2026. Retail trade growth slowed to 2,6% in December 2025. The unemployment rate rose further to 31,4% in Q4 of 2025. The GDP growth for the third quarter of 2025 grew with 0,5%, following an upwardly revised 0,9% growth in the prior period. The Policy Uncertainty Index eased to 64,9 from its record high of 81,0 (baseline 50) in Q3 2025.
An external factor that is of great concern to any agricultural business is the weather and climate outlooks. These factors include long term climate risks, such as drought and heat stress, as well as the current status of the El Niño and La Niña climate phenomenon. The El Niño Southern Oscillation (ENSO) is currently on La Niña advisory, although there is a 4% probability of La Niña conditions forming during early autumn.
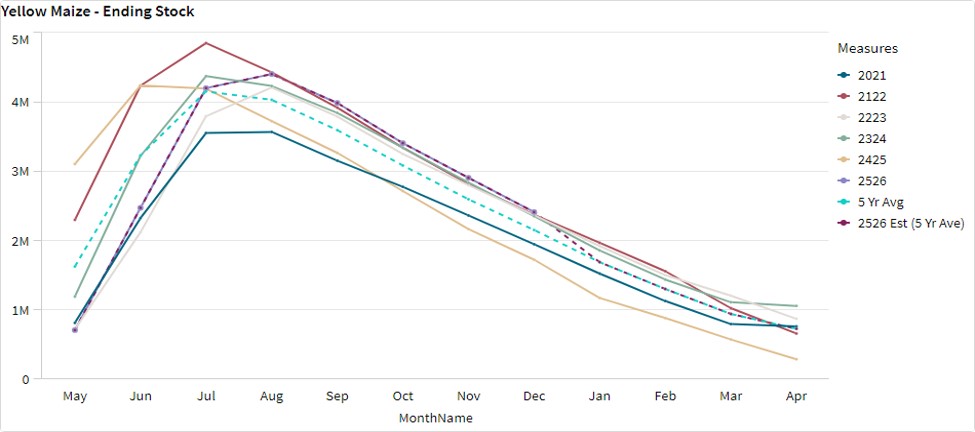
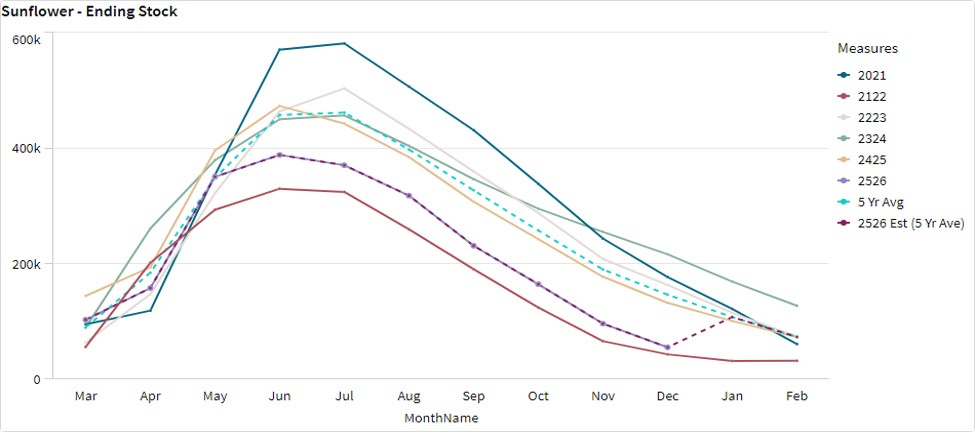
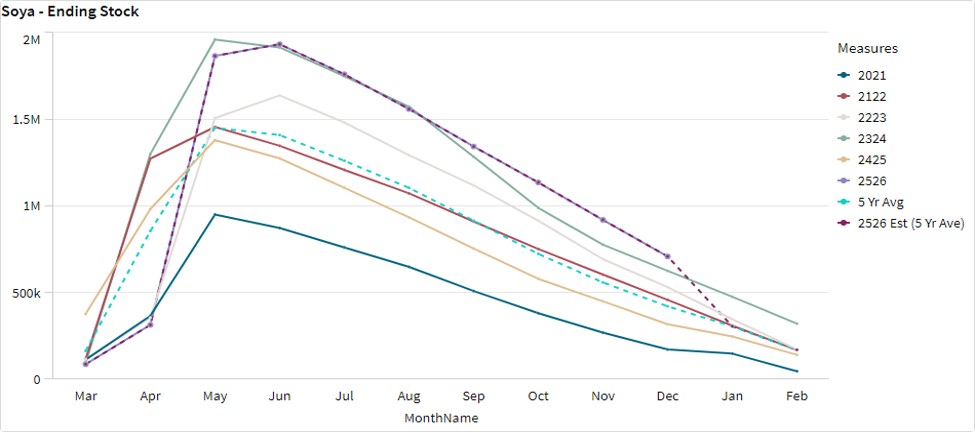
The National Agricultural Marketing Council (NAMC) projected the ending stock for 30 April 2026 for white and yellow maize to be more than that of the 2024/2025 marketing season. The projected soya ending stock for February 2026 is 368 259 t, which is more than the final for the 2024/2025 season of 140 704 t. The projected sunflower ending stock for February 2026 is 53 839 t, that is less than the final for the 2024/2025 season of 72 789 t.
During the previous Monetary Policy Committee (MPC) meeting held on 29 January the committee decided that interest rates will remain the same. The repo rate is currently 6,75% and the prime rate 10,25%.
Business climate – key risk drivers
A few highlights regarding certain risk drivers are mentioned below.
According to Trading Economics, South Africa’s annual inflation rate edged down to 3,4% in January 2026. The inflation rate is expected to be 3,6% by the end of this quarter. In the long-term, the South Africa Inflation Rate is projected to trend around 3,2% in 2027 and 3% in 2028.
Brent crude oil monthly average prices increased by $2,99 per barrel. Iron ore decreased slightly by $0,034 per metric ton on a monthly average.
South Africa’s retail trade rose by 2,6 % year-on-year in December 2025, following an upwardly revised 3,6% surge in the prior month. According to Statistics SA, South Africa’s unemployment rate fell to 31,4% in Q4 2025.
The GDP growth rate expanded by 0,5% in the third quarter of 2025. Nine of the ten industries experienced an increase. The agriculture sector saw a 1,1% rise during the period.
The Safex maize prices followed a decreasing trend, decreasing by about 3% compared to a month ago on the back of good weather prospects reinforced by the receipt of early rains during the current summer crop production season. The preliminary area planted estimate for maize indicated an increase of 2,98% compared to the previous season.
The El Niño–Southern Oscillation (ENSO) is on La Niña advisory. As of mid-February 2026, the equatorial Pacific is experiencing a declining La Niña conditions. ENSO-neutral remains the dominant category through Mar-May (90%) and Apr-Jun (65%). The solar cycle is in a downward trend for the current 11-year cycle which means possible less rain for the following season to come. The turning point is predicted to be in 2025.
The Policy Uncertainty Index (PUI) eased to 64,9 from its record high of 81,0 (baseline 50) in Q3 2025, Although still in negative territory, positive factors over the past three months have outweighed the negative ones. The 4Q 2025 PUI calibration suggests the economy may have reached a turning point. The economy enters 2026 on a note of cautious optimism.
Sources: https://tradingeconomics.com/south-africa/inflation-cpi
https://tradingeconomics.com/commodity/brent-crude-oil
https://tradingeconomics.com/south-africa/unemployment-rate
https://www.statssa.gov.za/?page_id=737&id=1
https://tradingeconomics.com/south-africa/gdp-growth
https://agrink.co.za/downloads/ABSA%20Agri%20Trends%20Grains%20and%20Veggies.pdf
https://tradingeconomics.com/commodity/iron-ore
PUI_2025Q4.pdf
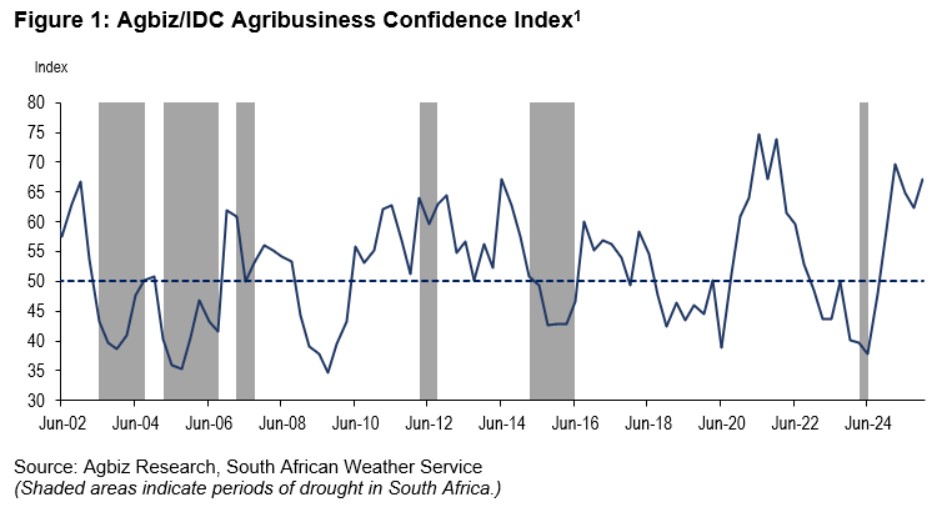
Agribusiness Confidence Index (ACI) Q4, 2025
The Agricultural Business Chamber conducts a quarterly survey to compile the Agribusiness Confidence Index (ACI), reflecting the views of at least 25 decision-makers in the agricultural sector. Released on 5 December 2025, the latest index evaluates ten critical factors impacting agribusiness: turnover, net operating income, market share, employment, capital investment, export volumes, economic growth, general agricultural conditions, debtor provisions for bad debt, and financing costs.
After falling for two consecutive quarters, the Agbiz/IDC Agribusiness Confidence Index (ACI) increased by 5 points to 67 in Q4 2025. Favourable weather conditions, strong exports throughout the year on the back of ample grains, oilseeds, and horticulture harvests, as well as better port efficiencies, are among the key drivers of optimism in the sector. We suspect that the announcement of nationwide vaccination of cattle against foot-and-mouth disease also contributed to the upbeat mood, as the disease is a national challenge that, for some time, seemed out of control.
The current ACI level of 67 is well above the 50-neutral mark, suggesting that South African agribusinesses are generally optimistic about business conditions in the country. This survey was conducted in the last week of November and covered agribusinesses operating across various agricultural subsectors nationwide.
Discussion of the subindices
The ACI comprises ten subindices. Most increased in Q4 2025, while two declined slightly. Here is the detailed view of the subindices.
- The capital investments subindex increased by 7 points from Q3 to 74. This uptick is well aligned with the encouraging high-frequency data, such as tractor and combine harvester sales, which have remained strong since the start of the year. For example, cumulative tractor sales for the first ten months of 2025 amounted to 6 122 units, up by 11% year-on-year. Moreover, the cumulative sales of combine harvesters for the same period are up 8% year-on-year, with 197 units sold.
- The sub-index measuring export volumes surged by 32 points from Q3 to 75. This is unsurprising as South Africa’s agricultural exports have remained strong since the start of the year despite significant trade policy shifts and uncertainty. For example, the cumulative value of agricultural exports for the first three quarters of the year is US$11,7 billion, representing a 10% increase from the corresponding period in 2024.
- The general agricultural conditions subindex increased by four points to 71 in Q4 2025. The increase highlights optimism about the benefits of La Niña-induced rains in the 2025/2026 season, which has recently started.
- The market share subindex lifted by 11 points to 71 in Q4 2025. Most respondents across the various subsectors shared this optimism and generally aligned with the better agricultural production conditions.
- The employment subindex increased by 3 points to 53 points in Q4 2025. This mirrors the sector’s general employment conditions. For example, while a bit more backward-looking, the number of farm jobs in South Africa increased slightly from the second quarter of 2025, by 2% to 920k in Q3 2025.
- The general economic conditions subindex improved by 3 points to 62 in Q4 2025. This is consistent with the country’s general macroeconomic optimism following S&P’s credit rating upgrades, South Africa’s removal from the FATF grey list, and numerous positive developments stemming from the implementation of Operation Vulindlela.
Mild decline
- However, the turnover subindex confidence fell by 4 points from Q3 to 71. This was primarily driven by views from the winter crop-growing regions, which reflect the fact that, while the harvest is relatively large, prices are lower. Still, a level of 71 is quite good and well above the 50-neutral mark. Similarly, the net operating income subindex declined by 6 points to 65 in Q4 2025.
Changes in interpretation
- The subindices of the debtor provision for bad debt and financing costs are interpreted differently from the abovementioned indices. A decline is viewed as a favourable development, while an increase signals growing financial strain.
- In Q4 2025, the debtor provision for bad debts indices fell by 3 points to 47, reflecting gains from generally large agricultural harvests in the country, mainly in field crops and horticulture. However, the financing costs index lifted by 12 points to 82. This was surprising, as the recent decline in interest rates has eased the cost of capital in the country.
Concluding remarks
In essence, the ACI results for Q4 2025 illustrate generally better conditions in the agricultural sector. “Still, the recovery of the sector this year will likely be uneven. We see better production conditions in the horticulture and field crops. However, the livestock industry is under pressure due to foot-and-mouth disease. What will help in the recovery going into 2026 will be the speedy vaccination process against foot-and-mouth disease in the roughly 12-million national herd of cattle, with 7,2 million of them in commercial production. Moreover, the La Niña rains will help in horticulture and field crops,” said Wandile Sihlobo, chief economist of the Agricultural Business Chamber of SA (Agbiz). “Also important are the collaborative efforts between business and government on pushing for better management of the municipalities, addressing rural crime, and the release of the government-owned land to appropriately selected beneficiaries. This is key for long-term expansion in the sector,” added Sihlobo.
ISSUED BY:
Wandile Sihlobo
Chief Economist, Agricultural Business Chamber of South Africa (Agbiz)
E-mail: wandile@agbiz.co.za
https://agbiz.co.za/content/economic-research?page=agribusiness-confidence
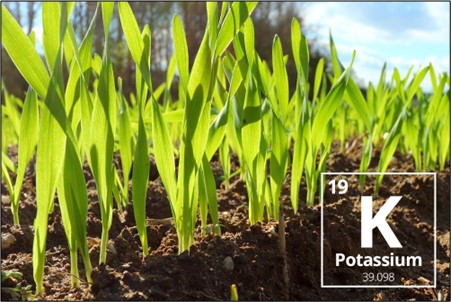
Fact of the month
The macronutrient known as the “quality nutrient” is potassium. Potassium plays a vital role in photosynthesis, activations of enzymes and water regulations. It helps enhance protein synthesis and improves stress resistance, while also increasing root growth and improving drought tolerance.
Source:https://www.cropnutrition.com/nutrient-management/potassium/
https://brandteurope.com/en/how-potassium-in-plants-defines-the-quality-of-your-crops-essential-nutrients/#:~:text=in%20olive%20crops-,The%20importance%20of%20potassium%20as%20an%20essential%20macronutrient%20in%20plants,the%20most%20efficient%20agricultural%20production
Weather and climate
NATIONAL ASSESSMENT
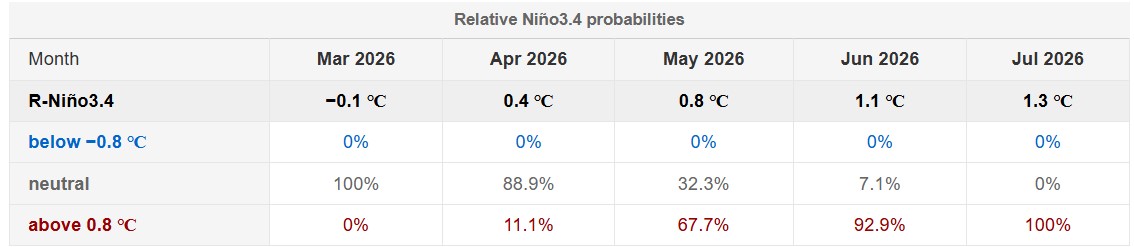
As of mid-February 2026, the equatorial Pacific is experiencing a declining La Niña conditions. The CCSR/IRI ENSO plume forecast places the probability of La Niña at just 4% for February to April 2026 and shifts the odds in favour of ENSO-neutral conditions (about 96%) for the same period. ENSO-neutral remains the dominant category through March to May (90%) and April to June (65%), while El Niño probabilities increase rapidly during same period. Starting in May-July, El Niño probabilities become higher than ENSO-neutral and remain in the range of 58% to 61%, with ENSO-neutral the second most likely outcome.
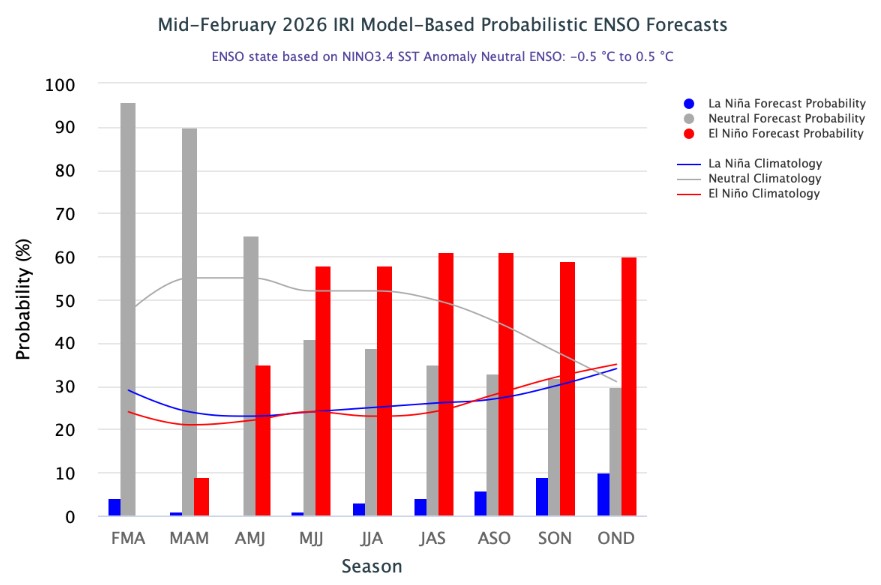
Source: International Research Institute for Climate and Society: https://iri.columbia.edu/our-expertise/climate/forecasts/enso/current/?enso_tab=enso-iri_plume
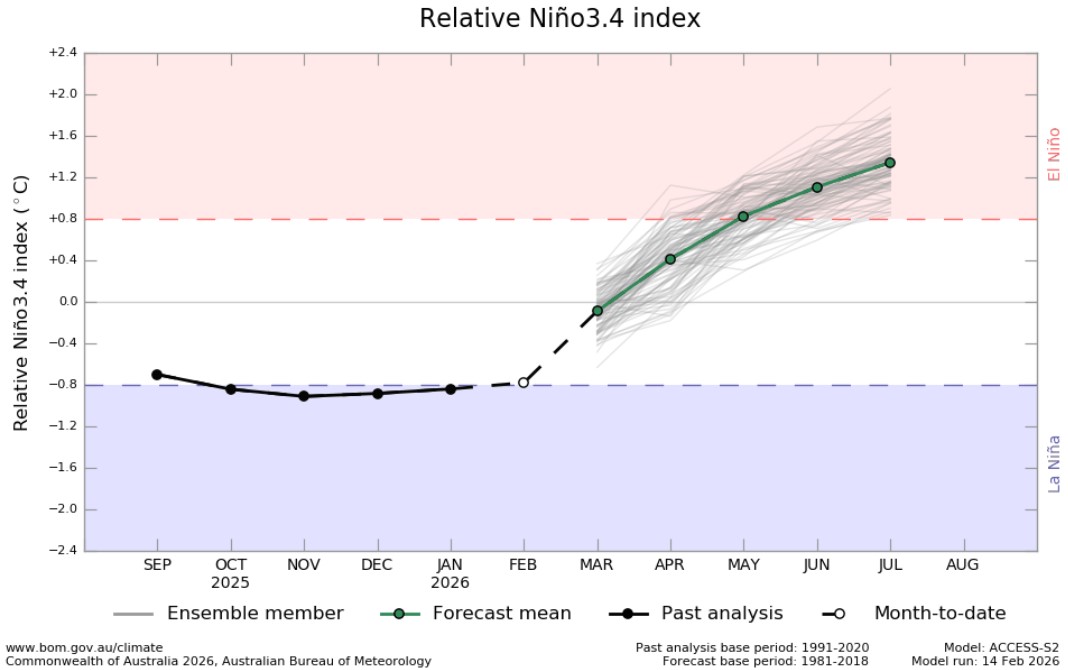
The Bureau of Meteorology’s model indicates that SSTs in the tropical Pacific have been fluctuating around the La Niña threshold (−0,8 °C) since late January. All models, including the Bureau’s indicate a return to neutral ENSO conditions later in February or in early autumn.
The graph below reflects current La Niña in the tropical Pacific. The 2025/2026 La Niña continues to weaken. The graph supports the prediction of an ENSO-neutral state from February to May 2026 and the possibility of an El Niño in June 2026.
http://www.bom.gov.au/climate/ocean/outlooks/?index=nino34
The latest Climate Watch issued by the SA Weather Service (3 February 2026) states above-normal rainfall is expected for most parts of the country’s summer rainfall areas during the late summer and autumn months, which is likely to bring positive impacts for crop and livestock production. However, there is an increased risk of waterlogging that can cause crop damage and prevent or delay harvest in areas receiving excessive rainfall.
The forecast indicates that some interior regions including areas in the Free State, North West and Northern Cape Provinces, will receive below-normal rainfall during the autumn months. Therefore, the relevant decision-makers are encouraged to advise Producers to practice measures such as soil and water conservation, ensure proper water harvesting and storage, establish good drainage systems, and implement other appropriate farming practices. Producers should also monitor the increase in pests and diseases and vaccinate their livestock to avoid disease outbreaks due to the wet conditions.
Source: https://www.weathersa.co.za/Documents/SeasonalForecast/SCOLF202601_03022026115119.pdf
SUNSPOTS
Sunspots are darker, cooler areas on the sun’s surface that arise due to disturbances in the sun’s magnetic field. Sunspots vary in numbers throughout the 11-year solar cycle.
According to a study published on Science Direct the rainfall rate can be directly related to the sunspot number, but shows different characteristics during solar maximum (the peak of the sun’s 11-year solar cycle) years. Though a lag correlation exists between sunspot number and rainfall, sunspots have an increasing effect on rainfall. Studies show that the more sunspots are present the higher the rainfall and the less sunspots the lower the rainfall.
ENSO (El Niño Southern Oscillation) occurs at irregular intervals between 3 and 7 years causing global climate system variation. Considering this event occurs periodically, it might be triggered by the 11-year solar cycle as an energy source.
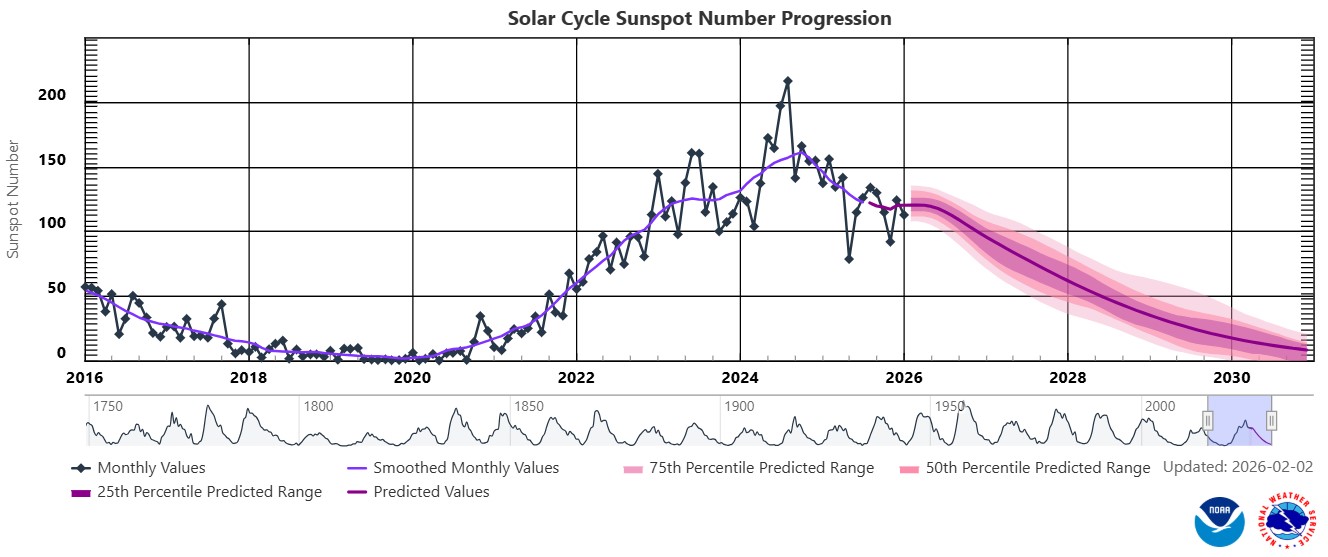
The graph below shows the latest 11-year solar cycle. An upward trajectory suggests that higher rainfall can be expected, characteristic of a La Niña. A downward trajectory suggests that lower rainfall can be expected, characteristic of an El Niña.
Between October 2020 to February 2025 the actual sunspot numbers were higher than the predicted values. January 2026 falls inside of the predicted range, with a monthly mean sunspot value of 112,6.
Sources:https://www.spaceweatherlive.com/en/solar-activity/solar-cycle.html https://www.sciencedirect.com/science/article/abs/pii/S136468262200116X#:~:text=It%20was%20observed%20that%20rainfall,an%20increasing%20effect%20on%20rainfall
https://www.space.com/solar-cycle-frequency-prediction-facts
https://eos.org/articles/why-did-sunspots-disappear-for-70-years-nearby-star-holds-clues https://aip.scitation.org/doi/abs/10.1063/1.4930679?journalCode=apc#:~:text=ENSO%20occurs%20at%20irregular%20interval,cycle%20as%20an%20energy%20source
Market risk
GRAIN MARKET ANALYSIS
- Ending stock – national
Ending stock data is gathered from the National Agricultural Marketing Council (NAMC). The estimates are reassessed and reported by the Grain & Oilseeds supply & demand estimates committee. The following is the projected ending stock for April 2026 in tonnages for the 2025/2026 season:
- White maize => 1 829 062 t
- Yellow maize => 704 330 t
The following is a summary of September 2025 ending stock projections for the 2024/2025 season:
- Wheat => 455 014 t
The following is a summary of February 2026 projected ending stock for the 2025/2026 season:
- Sunflower => 44 989 t
- Soybeans => 368 259 t
- Sorghum => 82 312 t
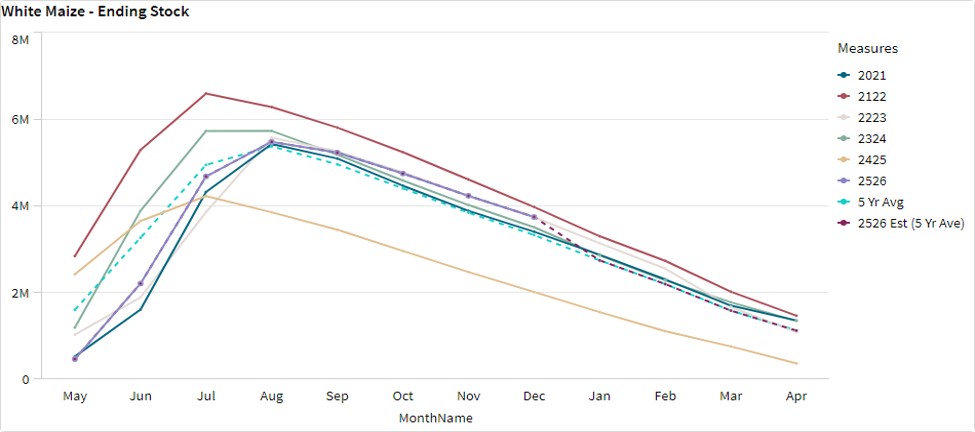
The graphs below show the predicted ending stock for the different commodities according to SAGIS data. A five-year average has been calculated to determine the estimated ending stock for the current season.
The estimated white maize ending stock for April 2026 is 1 829 062 t. That is 757 603 t more than the final ending stock for the 2024/2025 season. The final yellow maize ending stock for April 2026 is 704 330 t. That is 439 284 t more than the final ending stock for the 2024/2025 season.
The predicted five-year average sunflower ending stock for the 2025/2026 season is 452 t more than the previous season ending stock.
The predicted five-year average soybean ending stock for the 2025/2026 season is 28 832 t more than the previous season ending stock.
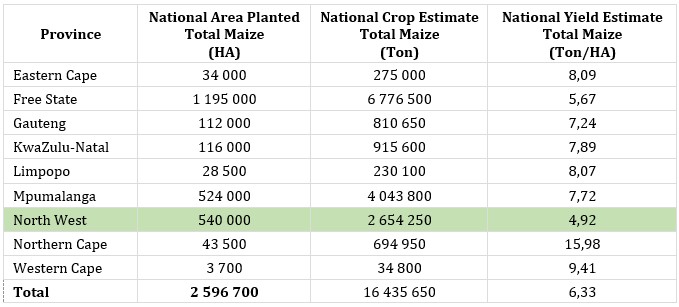
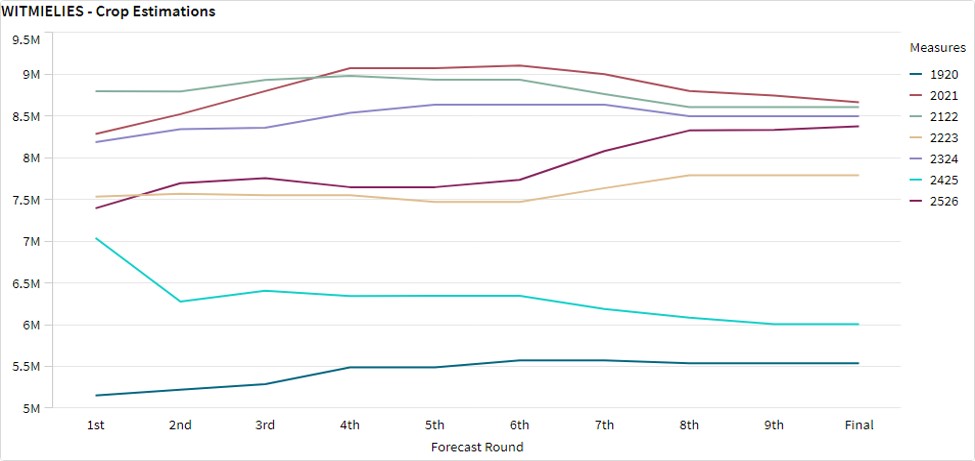
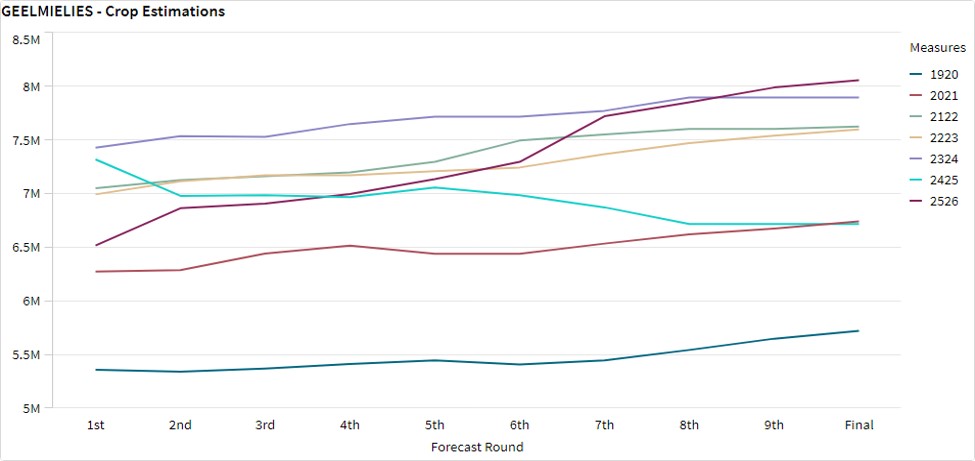
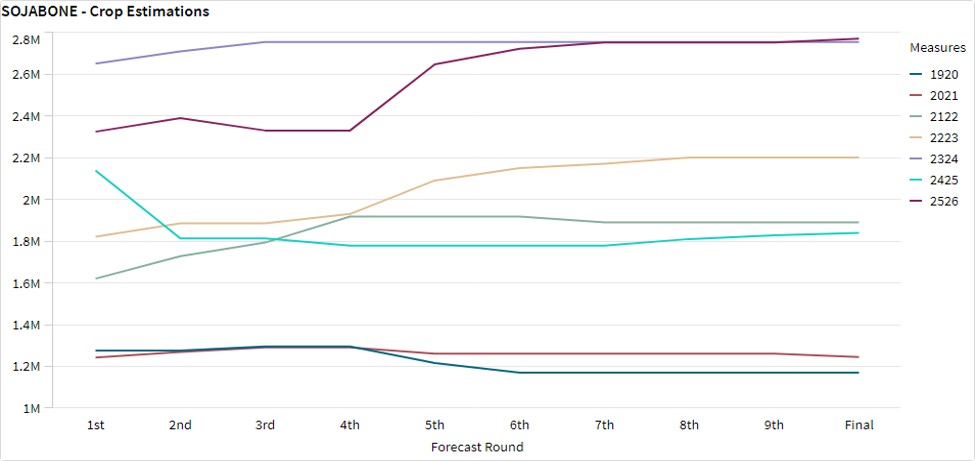
- Crop estimations
According to the Crop Estimate Committee (CEC) final production forecast for 2025, the total area estimate for maize in South Africa is 2,647 million ha, which is 2,98% more than the 2,597 million ha planted for the previous season. The total forecasted tons for white – and yellow maize are 16 million tons from the final forecast.
Source: CEC (Crop Estimates Committee)
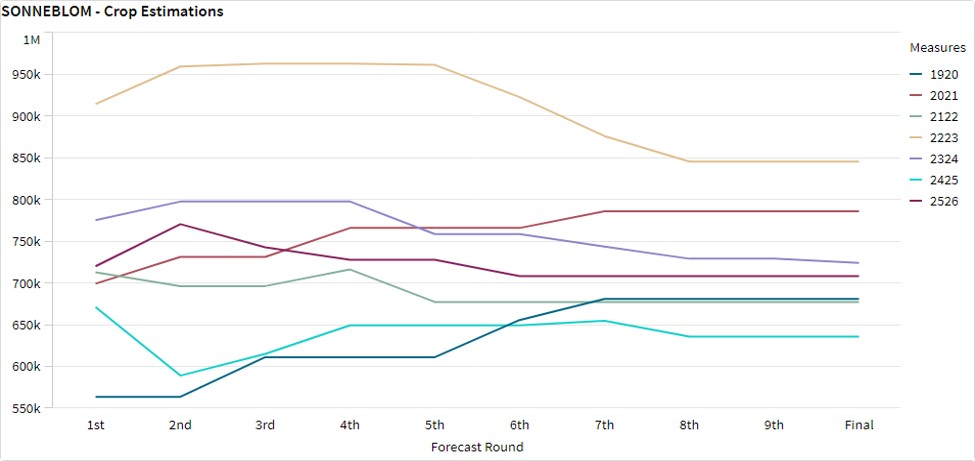
- Production forecast sunflower
The production forecast for sunflower seed is 708 300 t. The area estimate for sunflower seed is 555 700 ha while the expected yield is 1,27 t/ha.
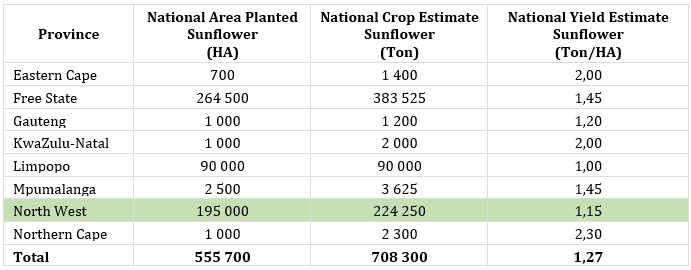
Source: CEC (Crop Estimates Committee)
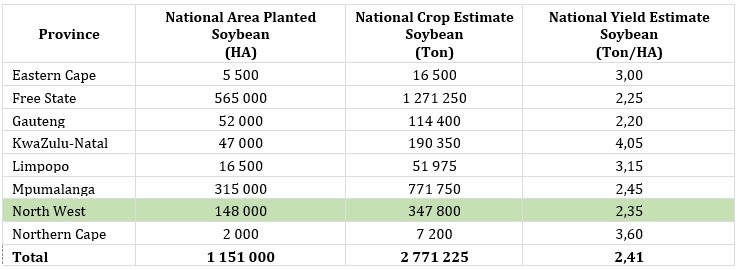
- Production forecast soybeans
The production forecast for soybeans is 2,771 million tons. The estimated area for soybeans is 1,151 millionha with an expected yield of 2,41 t/ha.
Source: CEC (Crop Estimates Committee)
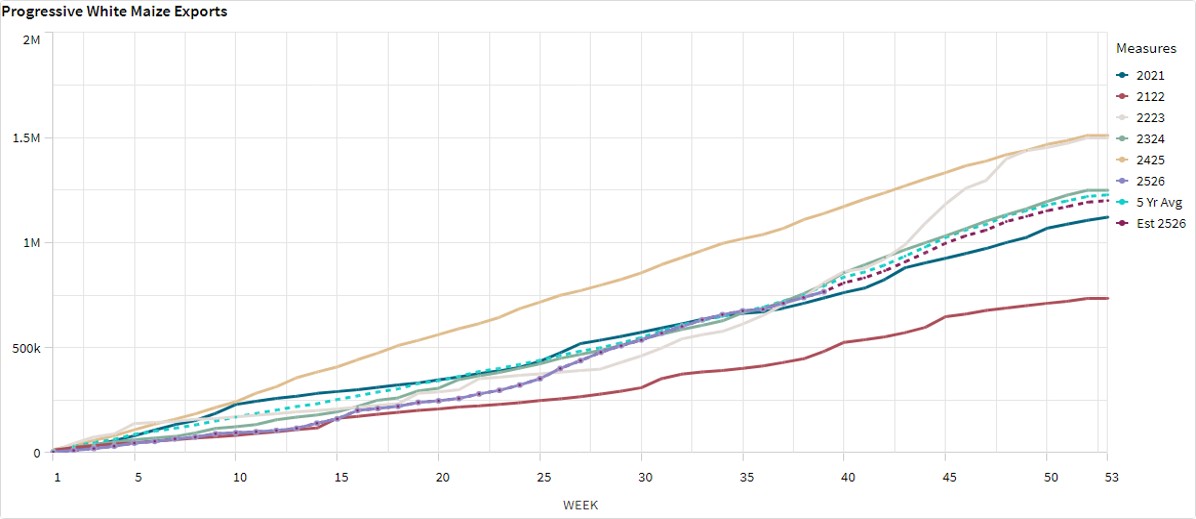
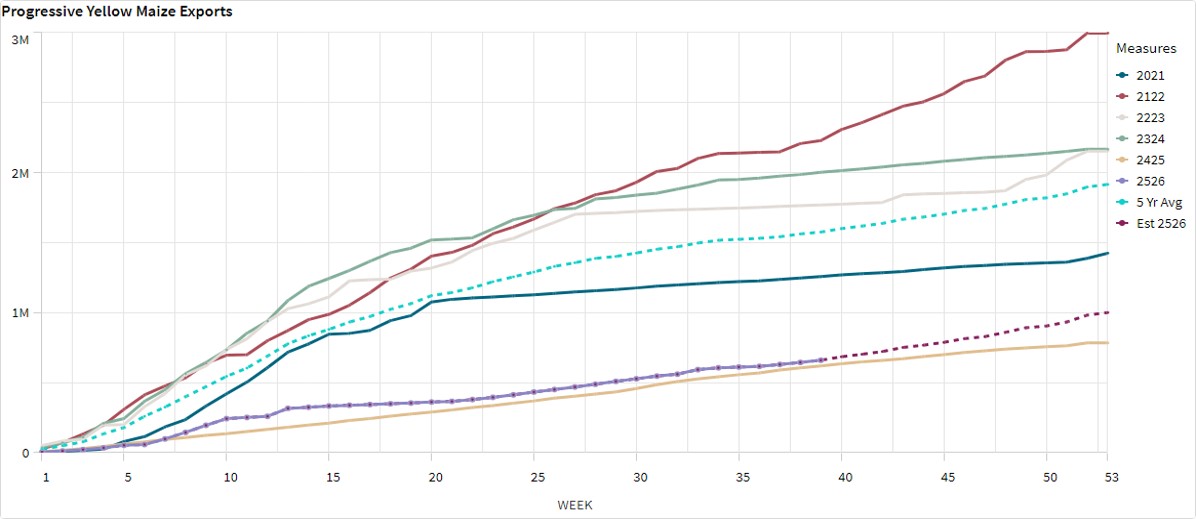
- Imports and exports – national
For the production season ending April 2026, 764 681 t of white maize and 660 275 t of yellow maize have been exported so far as seen in the graphs below.
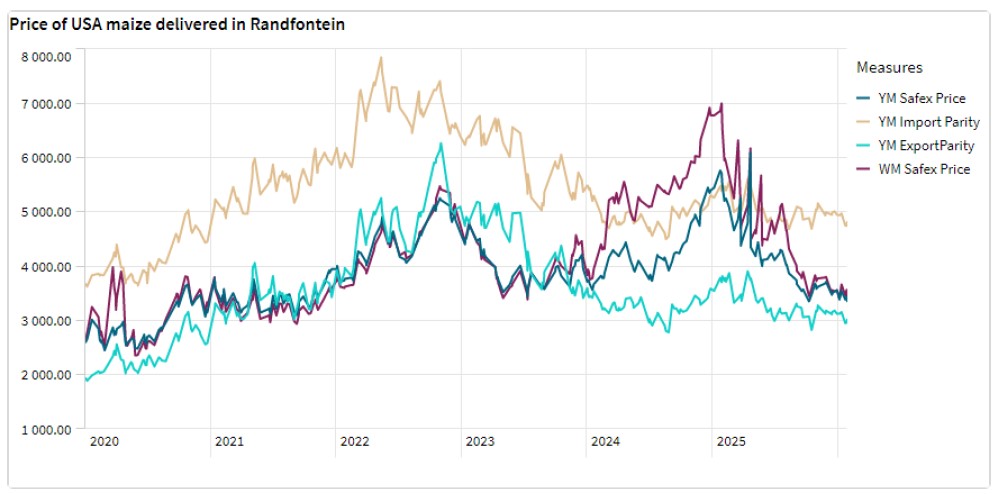
- Parity prices
South Africa is a small producer compared to other countries and is thus a price taker (meaning that we cannot influence world prices). Because of this, our local prices are normally between import and export parity, which is illustrated in the figure below. An import parity price is defined as the price which a buyer will pay to buy the product on the world market. This price will include all the costs incurred to get the product delivered to the buyer’s destination.
An export parity price is defined as the price that a local seller could receive by selling his product on the world market e.g., excluding the export costs. The price which the seller obtains is based on the condition that he delivers the product at the nearest export point (usually a harbour) at his own expense.
The graph below reflects the Safex price, import parity and export parity of yellow maize as well as the Safex price of white maize. The import and export parity prices for white maize is not released by Grain SA for this period.
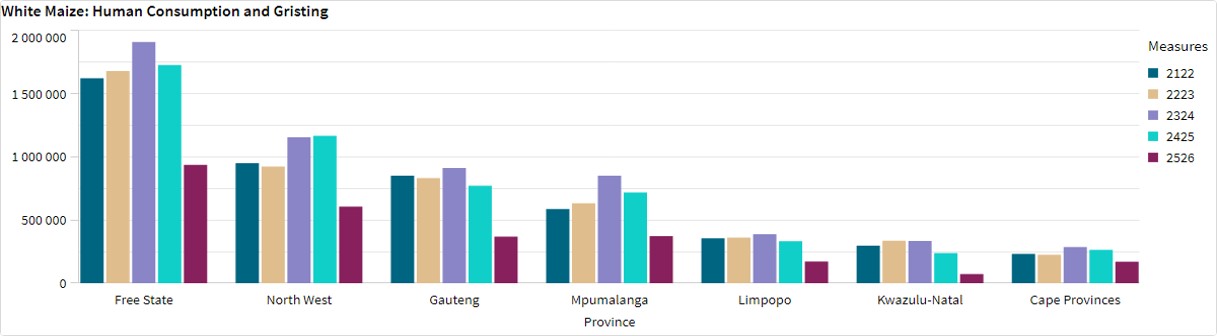
- Grain processing per province
For the marketing year 2025/2026, May 2025 to April 2026, the Free State dominates the white maize that is used for human consumption and gristing. North West consumed the second most white maize produced for human consumption for the marketing year.
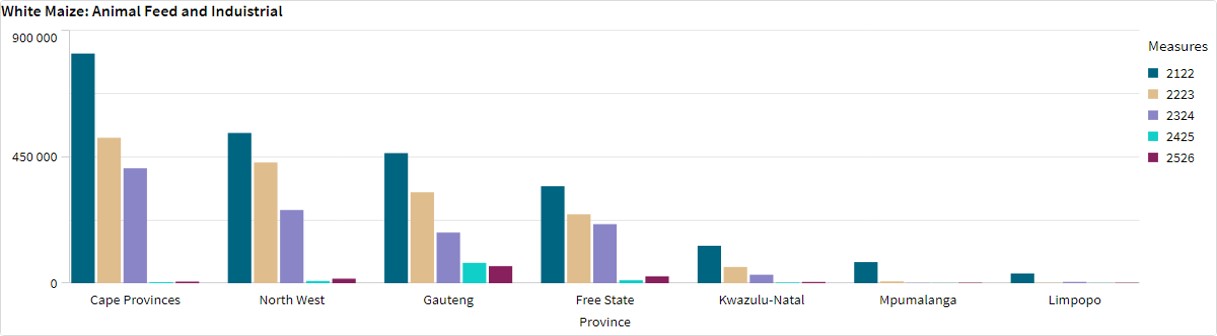
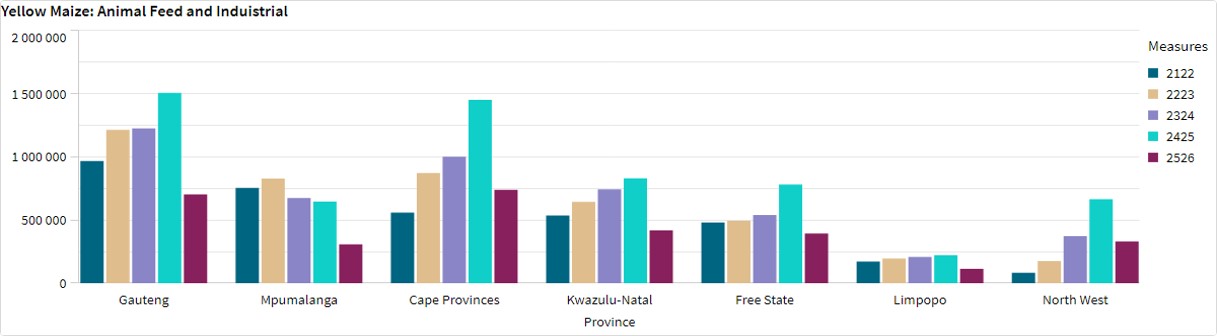
Gauteng used the most, white maize for animal feed and industrial usage with the Free State using the second most.
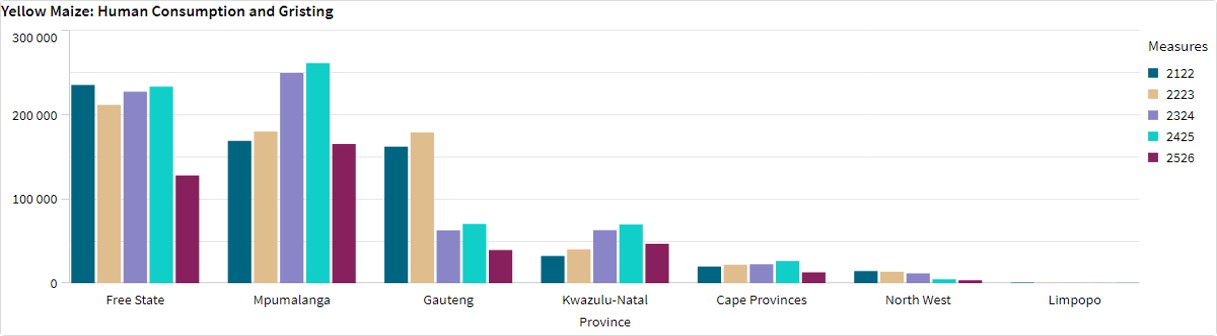
Mpumalanga processed the most yellow maize for consumption and gristing and the Cape Provinces processed the most yellow maize for animal feed and industrial purposes.
- Exchange rate
NWK Group is exposed to foreign exchange rate risk in various business areas, such as commodity prices and trade imports, etc.
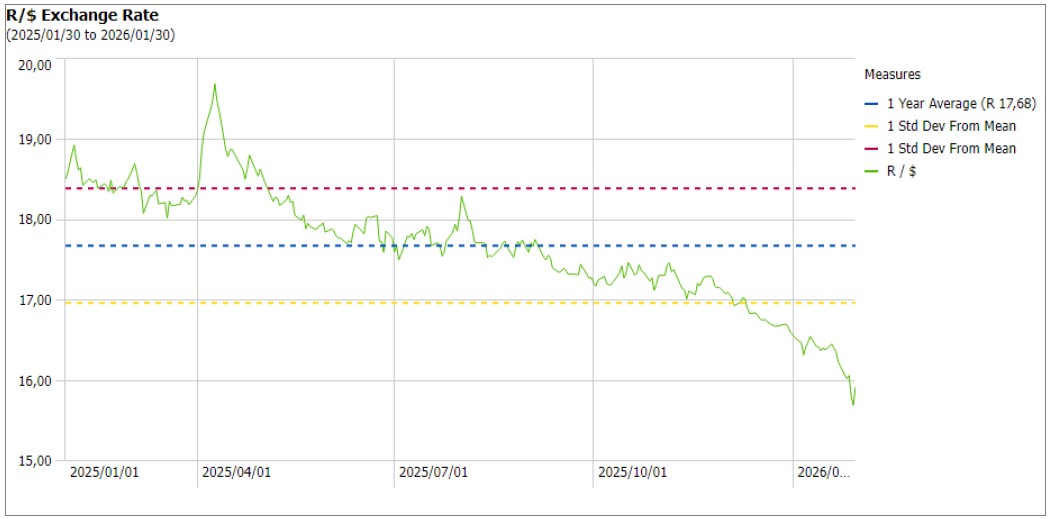
The rand traded at a monthly average of R16,28 against the dollar for the month of January, that is 0,57% better than in December. Over the past month, the South African rand has strengthened by 2,29%, and is up by 13,81% over the last 12 months.
Source: Trading Economics
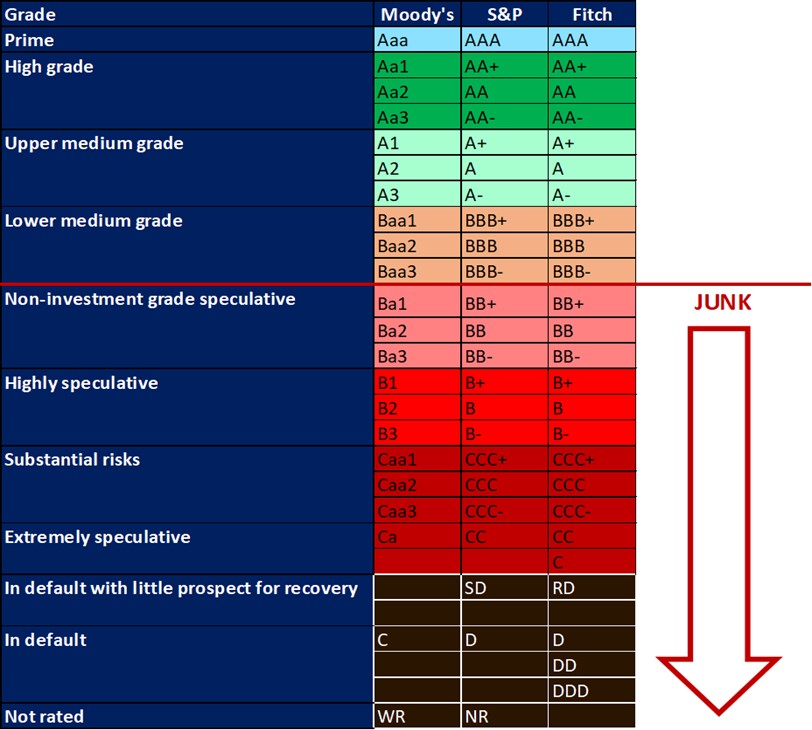
- Interest rate
All major rating agencies, i.e., Moody’s, S&P and Fitch, have South Africa’s credit ratings in sub-investment-grade territory. S&P, however, raised the country’s investment status for the first time in nearly two decades from BB- to BB.
The South African Reserve Bank is also having new discussions around the repo rate, how it is calculated and whether it should still exist. The rate has been fixed at 350 basis points above the country’s monetary policy rate since 2001. These discussions will be monitored over time to see how things unfold.
Source: https://www.spglobal.com/ratings/en/regulatory/article/-/view/type/HTML/id/3479175
https://www.moneyweb.co.za/news/economy/kganyago-favours-ending-use-of-prime-rate/
https://www.moneyweb.co.za/moneyweb-radio/safm-market-update/prime-interest-rate-what-is-it-and-do-we-need-it/
During the previous Monetary Policy Committee (MPC) meeting held on 29 January 2026 the committee decided to keep interest rates unchanged. The repo rate is still 6.75% and the prime rate is 10.25%. The next MPC meeting will be held on 26 March 2026.
Interest rate movement:
27 March 2024 – 11,75%
30 May 2024 – 11,75%
18 July 2024 – 11,75%
19 September 2024 – 11,50%
21 November 2024 – 11,25%
30 January 2025 – 11,00%
20 March 2025 – 11,00%
29 May 2025 – 10,75%
31 July 2025 – 10,50%
18 September 2025 – 10,50%
20 November – 10,25%
29 January – 10,25%
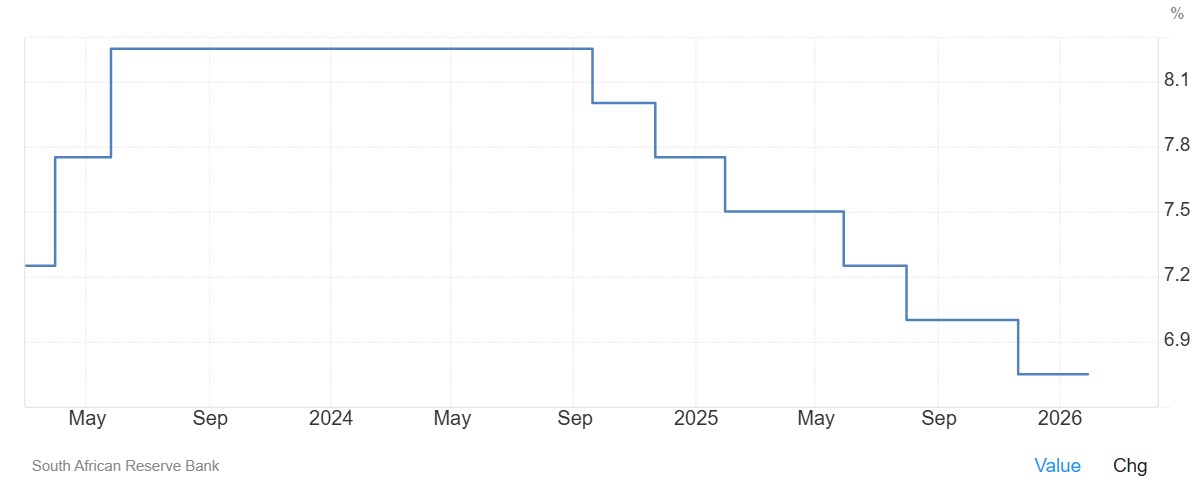
- Current interest rate
The South African Reserve Bank kept its key repo rate unchanged at 6,75% on January 29 2026, as widely expected, after a 25 bps rate cut in November. The decision was not unanimous, with two members favouring a 25-basis-point cut. Policymakers noted that, although the inflation outlook is improving, they aim for a further drop in inflation expectations and remain watchful of potential price pressures from electricity tariffs. Uncertainty in global politics also weighed.
Source: South African Reserve Bank: Trading economics
- Inflation rate
As the inflation rate is a driver for increases and decreases in interest rates the current rate and forecast have to be assessed to foresee further increases in the interest rate.
- Current
South Africa’s annual inflation rate edged down to 3,5% in January 2026 from 3,6% in the prior month, though slightly above analysts’ estimates of 3,4%. Lower transportation costs (-0,2% vs 1% in December), largely reflecting a decline in fuel prices (-3,7% vs 0,6%), were the main drag on overall price growth. Meanwhile, inflation in the heavyweight categories of housing and utilities (4,8% vs 4,9%) and food and non-alcoholic beverages (4,4% vs 4,4%) remained elevated, continuing to support overall price pressures.
Food inflation was underpinned by higher meat prices (13,5% vs 12,6%), amid persistent supply constraints linked to foot-and-mouth disease. The annual core inflation rate, which excludes food, non-alcoholic beverages, fuel, and energy, rose to a near one-year high of 3,4% in January, from 3,3% in December. On a monthly basis, the CPI rose by 0,2%, maintaining the same pace as the previous month.
Source: Statistics South Africa
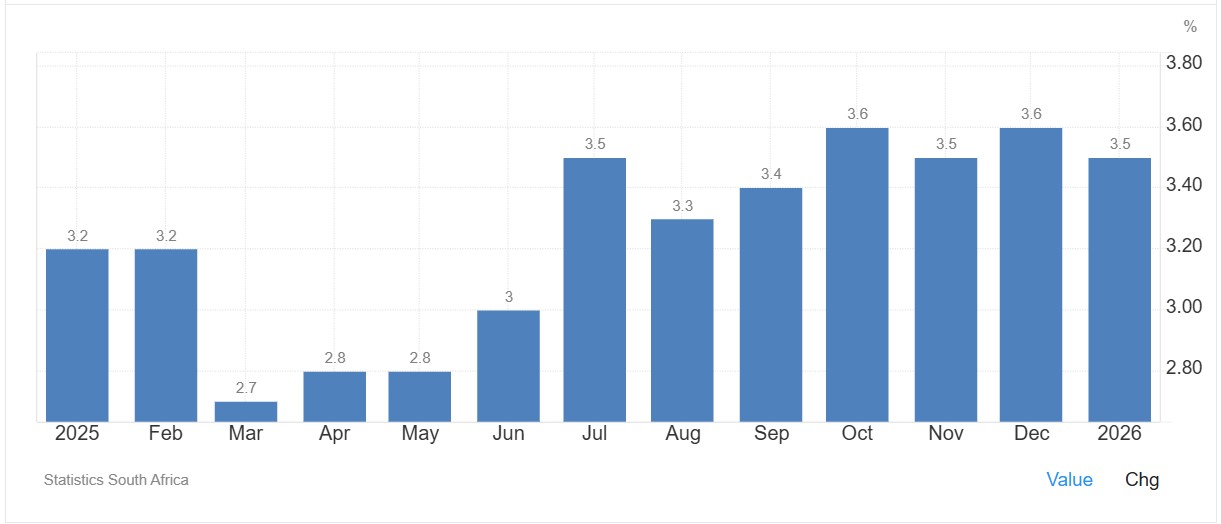
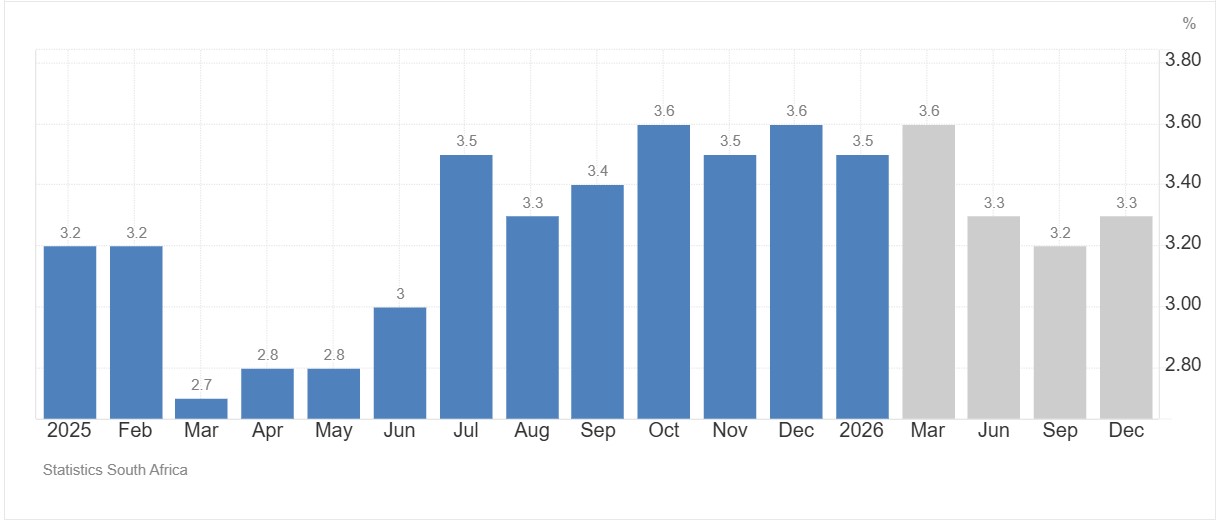
Inflation rate in South Africa decreased to 3,50% in January from 3,60% in December of 2025. It is expected to be 3,60% by the end of this quarter, according to Trading Economics global macro models and analysts’ expectations. In the long-term, the South Africa inflation rate is projected to trend around 3,20%in 2027 and 3% in 2028, according to their econometric models.
Source: https://tradingeconomics.com/south-africa/inflation-cpi
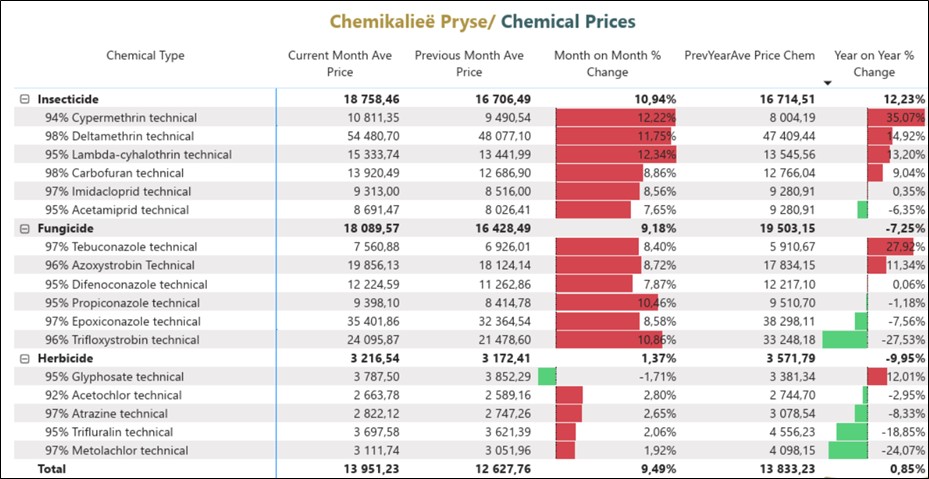
- Highlights in the agrochemical sector
Insecticide and fungicide prices increased a lot on average in a month-on-month period with 10,94% and 9,18% respectively. Herbicide prices increased slightly on average, month-on-month, with 1,37%. On a year-on-year basis, chemical prices for insecticides increased by 12,23%, herbicides are down 9,95%, and fungicides are down 7,25%.
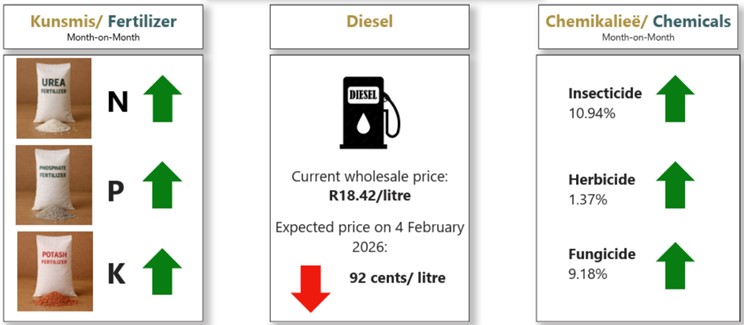
- Fuel costs
The wholesale diesel price has been on a downward trend recently, now at R18,41 per litre, and an anticipated decrease of 92,53 cents per litre.
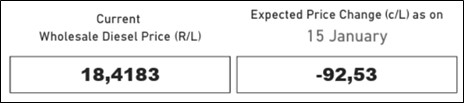
As of the first week of January 2026, both petrol 95 and diesel 0,05% show a declining trend, further supporting the expectation for lower fuel prices in the upcoming month supported by the stronger value of the rand against the dollar and lower global crude oil prices during the observed period.
Source: https://www.grainsa.co.za/upload/report_files/Input-Monitoring-Report_16-January-2026.pdf
Future prices
The graphs below illustrate the market sentiment for maize, in the form of future contracts, for the upcoming contract months. The market sentiment is the expectation of supply and demand fundamentals relating to white and yellow maize in South Africa.
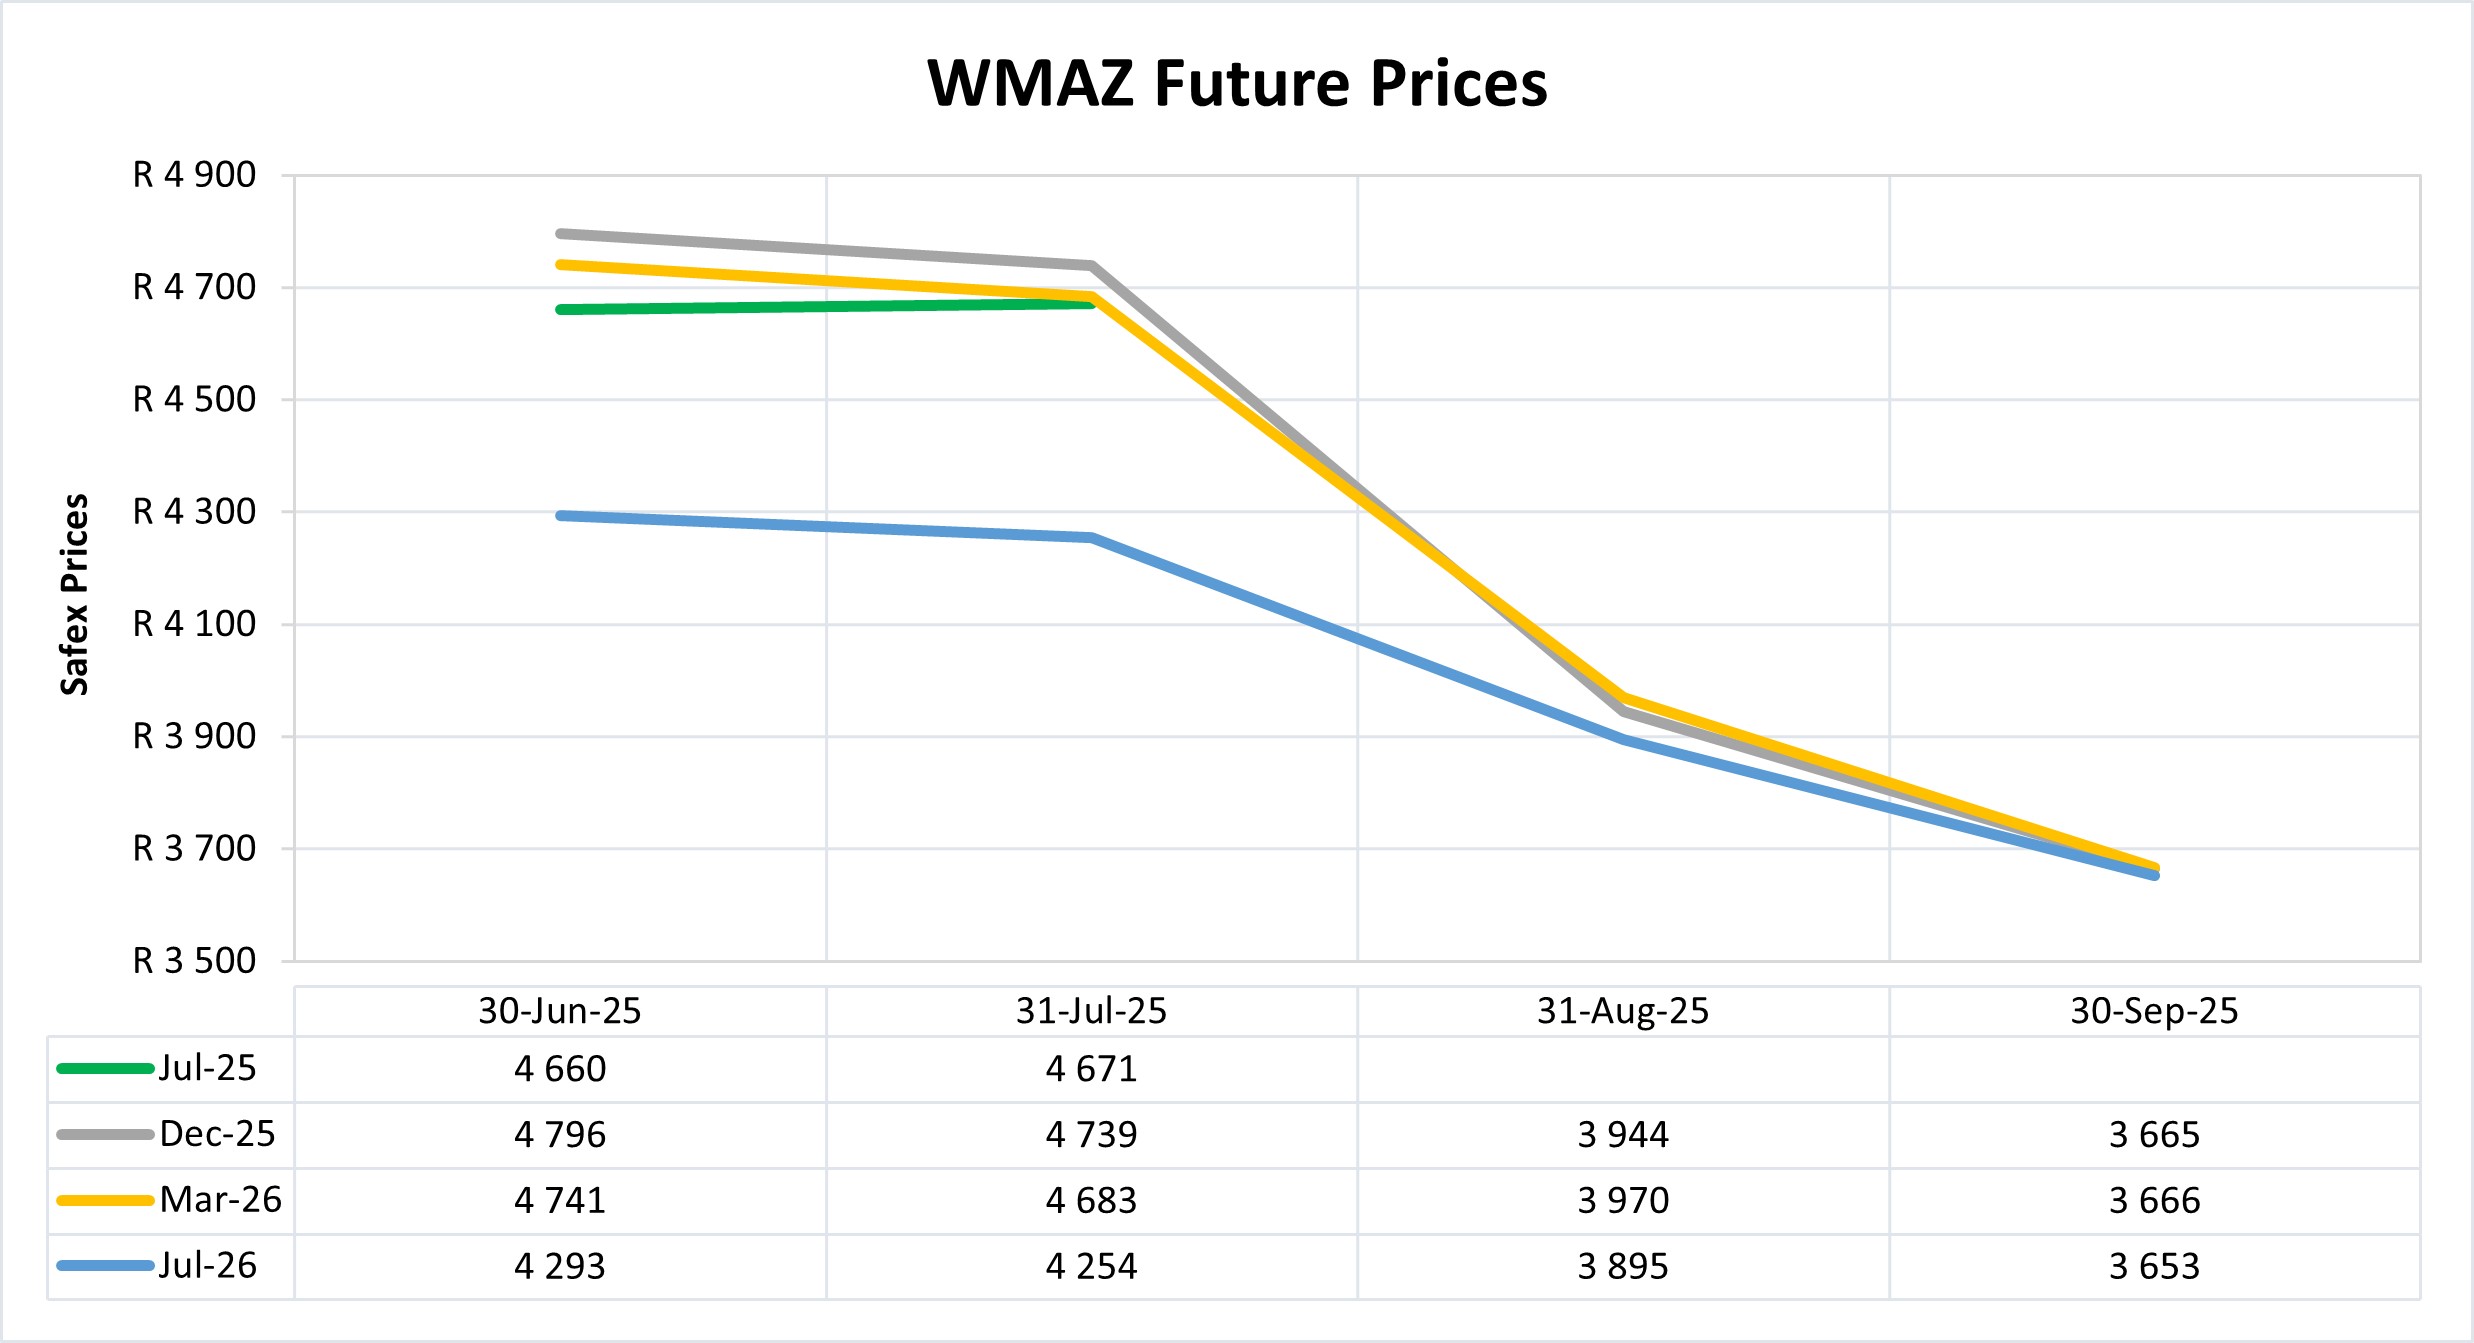
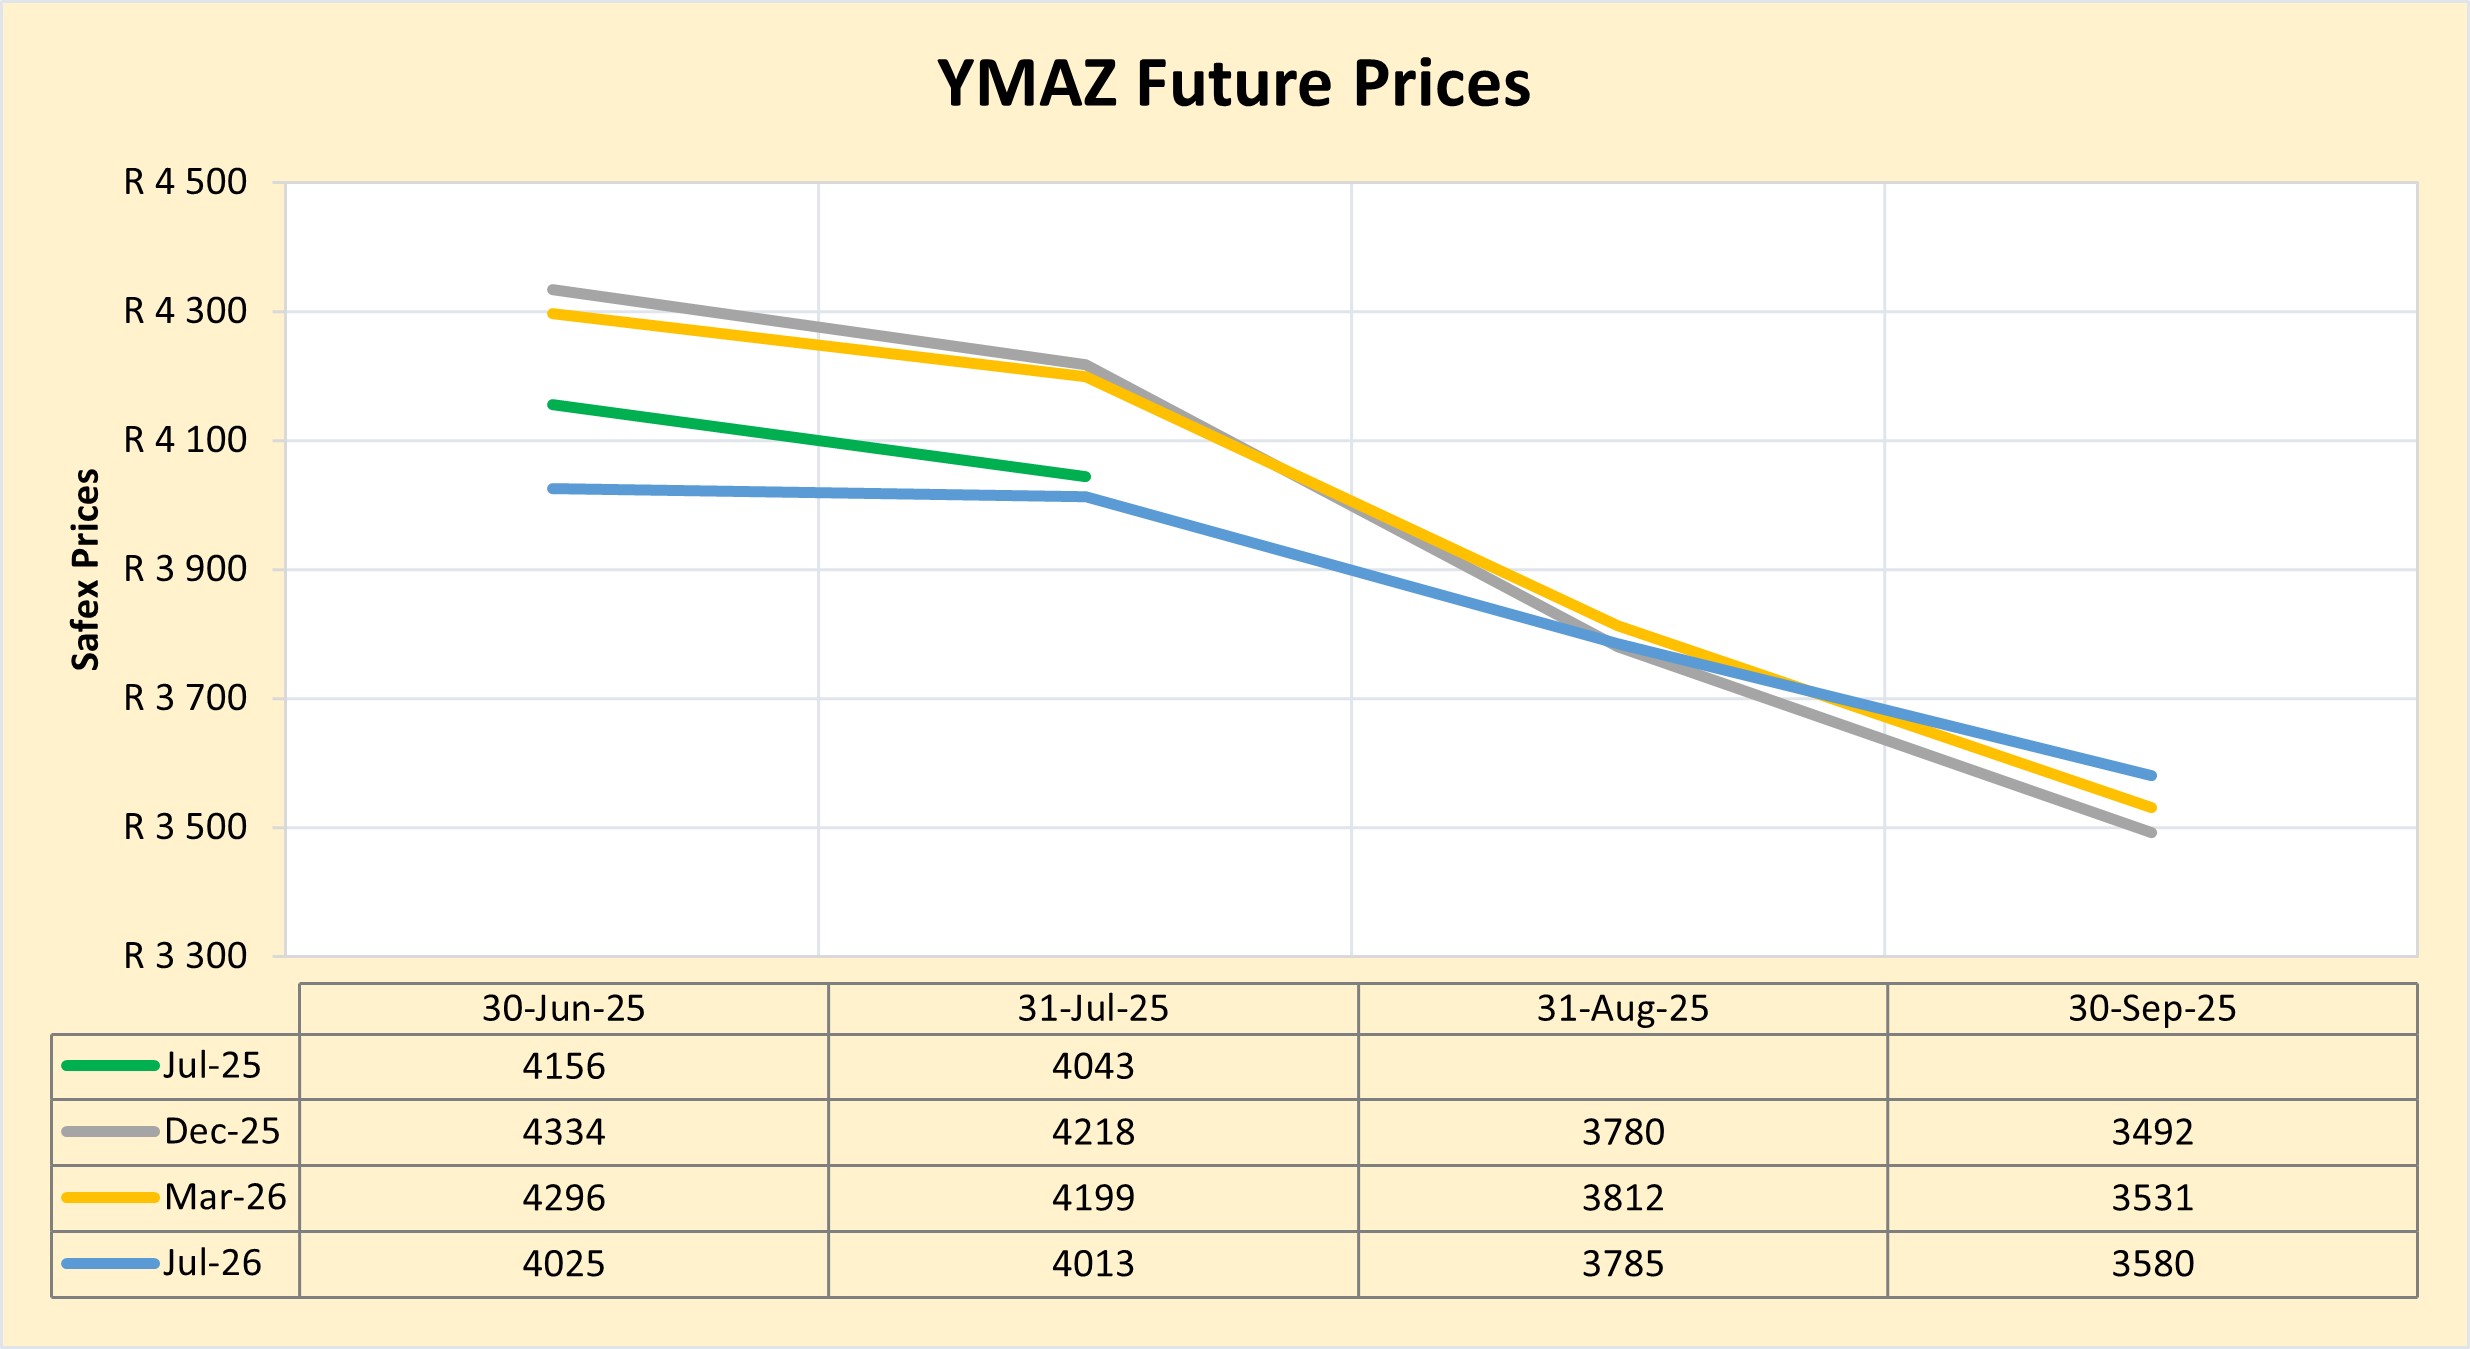
- Domestic market overview
As of late February 2026, South African maize prices are experiencing downward pressure, trading significantly lower (by roughly 30%) than the previous year due to large supplies and slow exports. The preliminary area planted estimate for maize indicated an increase of 2.98% compared to the previous season.
Fraud risk
FRAUD AWARENESS
Account takeover is defined as a type of cybercrime in which a malicious actor gains control of a legitimate user account – often through stolen or compromised credentials. This allows them to make unauthorized transactions, change account details, or engage in other fraudulent activities.
Due to the wide reach, ATO poses a threat to any organisation that handles sensitive user data. Compromised business accounts are also on the rise, increasing the risk of both individuals and enterprises. ATO can also be used to execute a vandalism scheme designed to hurt the reputation or the operational capacity of a company.
With AI-tools and credential-stuffing software readily available, attackers can automate ATO attempts at scale – testing thousands of stole credentials across multiple platforms in a matter of minutes.
ATO can happened through social engineering tactics, credential stuffing, financial malware, session hijacking, SIM swaps, phising and data breaches.
Ways to prevent ATO Fraud:
- Strong passwords
- Multi-factor Authentication (MFA)
- Regular Password changes
- Use a Password Manager
- Monitor your accounts
- Enable Security Features
- Be aware of fraud tactics, both old and emerging
While cybercriminals can use AI to execute ATO attacks, it is also a powerful fraud detection and prevention tool. AI – specifically machine learning algorithms – can analyse user behaviour patterns and detect suspicious activity and potential account takeover attempts.
Source: https://www.threatmark.com/account-takeover-fraud/#:~:text=What%20Is%20Account%20Takeover%20Fraud,in%20a%20matter%20of%20minutes
https://www.fortinet.com/resources/cyberglossary/account-takeover


