
This report opts to aid on a timely basis to foresee the external market and other factors that may have an impact on any business and its clients.
External factors
The main focus of this document is to have a closer look at external factors that have an influence on the agricultural sector.
1. GRAIN ENDING STOCK FORECAST
The National Agricultural Marketing Council (NAMC) predicts 30 April 2021 ending stock for white and yellow maize to exceed that of the 2019/2020 season. Our forecast for white maize for the season is that of an excellent harvest. The estimated maize crop is 5% bigger than the 2020 crop. The three main maize producing areas, namely the Free State, Mpumalanga and North West are expected to produce 84% of the 2021 crop.
2. REPO RATE
The repo rate has been cut by 300 basis points this year to help mitigate the economic fallout of the Covid-19 pandemic. The repo rate is currently 3,5% and the prime lending rate 7%.
3. GRAIN MARKET ANALYSIS
- Ending stock – national
Ending stock data is gathered from the NAMC. The estimates are reassessed and reported by the Grain and Oilseeds Supply and Demand Estimates Committee.
The following is a summary of April 2021 ending stock estimates for the 2020/2021 season in tonnages:
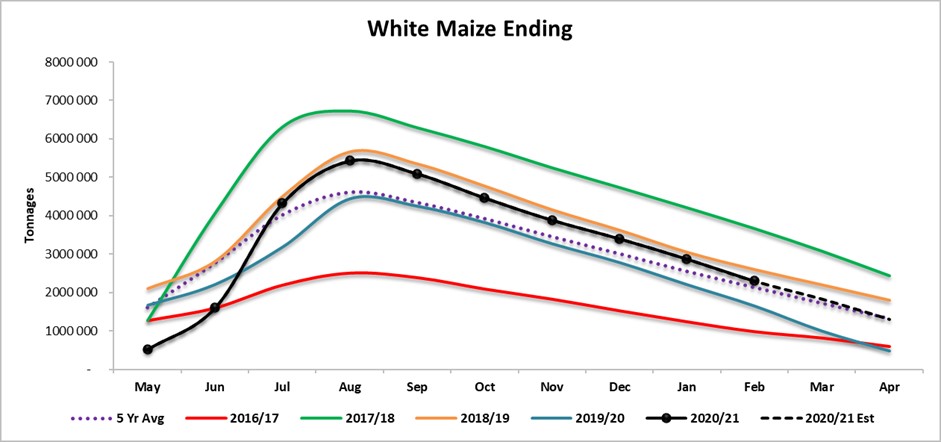
White maize = 1 308 623 t
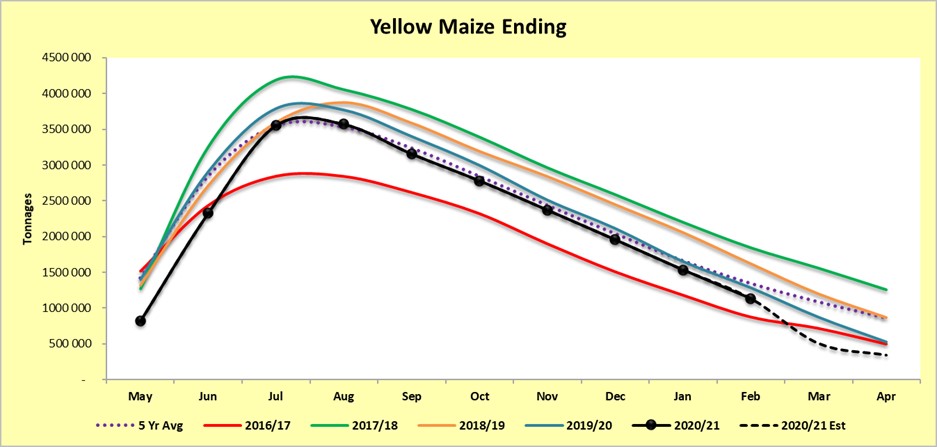
Yellow maize = 337 609 t
The following is a summary of February 2021 ending stock estimates for the 2020/2021 season:
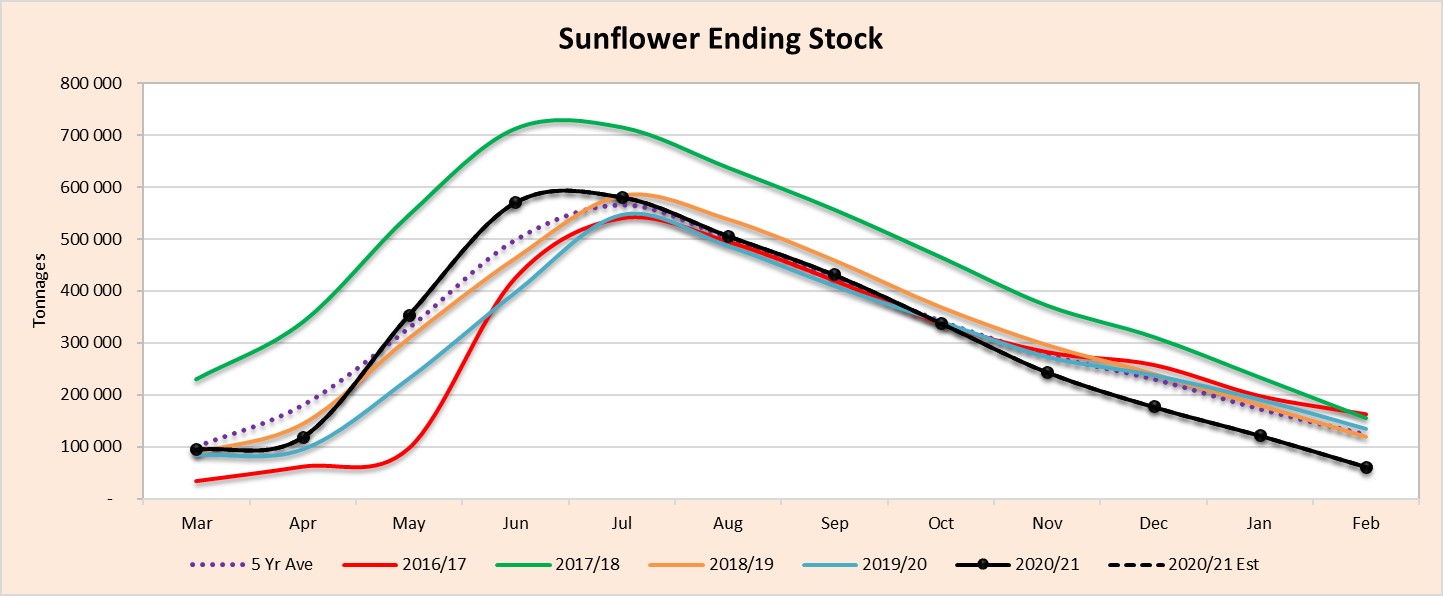
Sunflower = 61 690 t
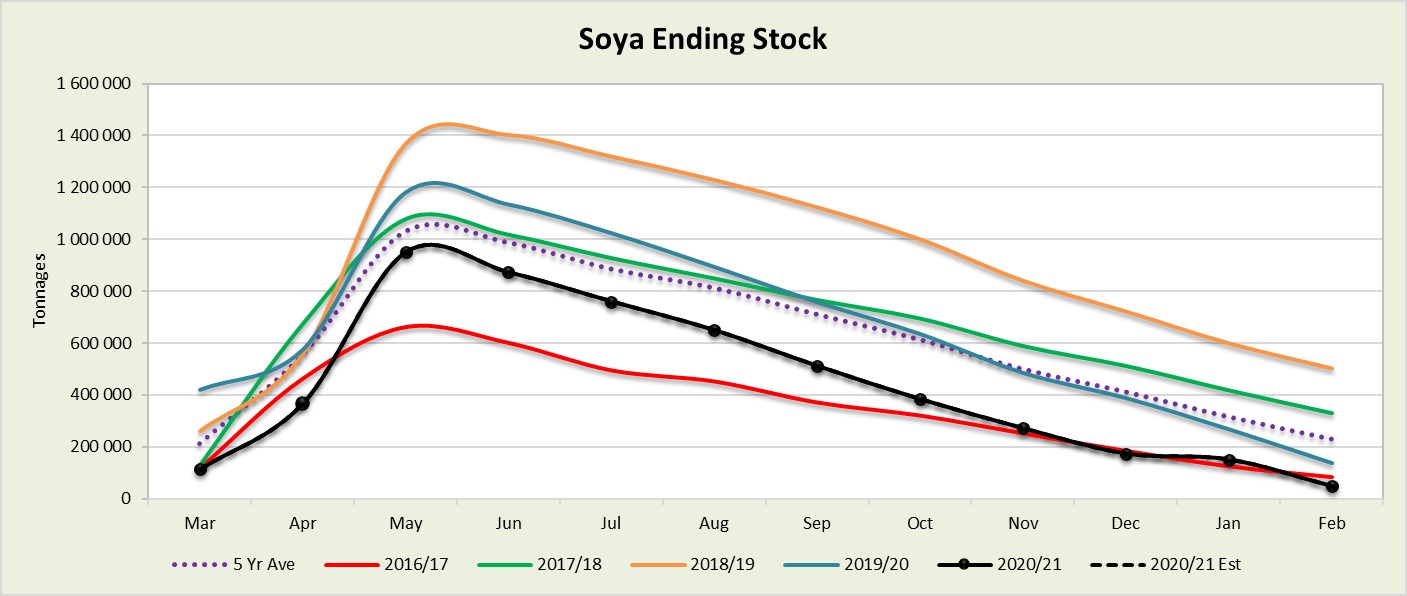
Soybeans = 47 696 t
Sorghum = 52 260 t
Graph 1a to 1d shows white maize ending stock estimates for April 2021 that are 834 659 tons more than the 2019/2020 season. Yellow maize shows a 189 028 ton decrease in ending stock estimation for the 2020/2021 season over the previous season. The sharp drop after January for yellow maize could mean that the ending stock could be more than what NAMC predicted, according to our forecasting.
Source: Sagis
Source: Sagis
Source: Sagis
The actual soya ending stock for February 2021 is 90 759 tons less than February 2020. The actual sunflower ending stock is 46% (73 635 tons) less than the previous seasons ending stock.
Source: Sagis
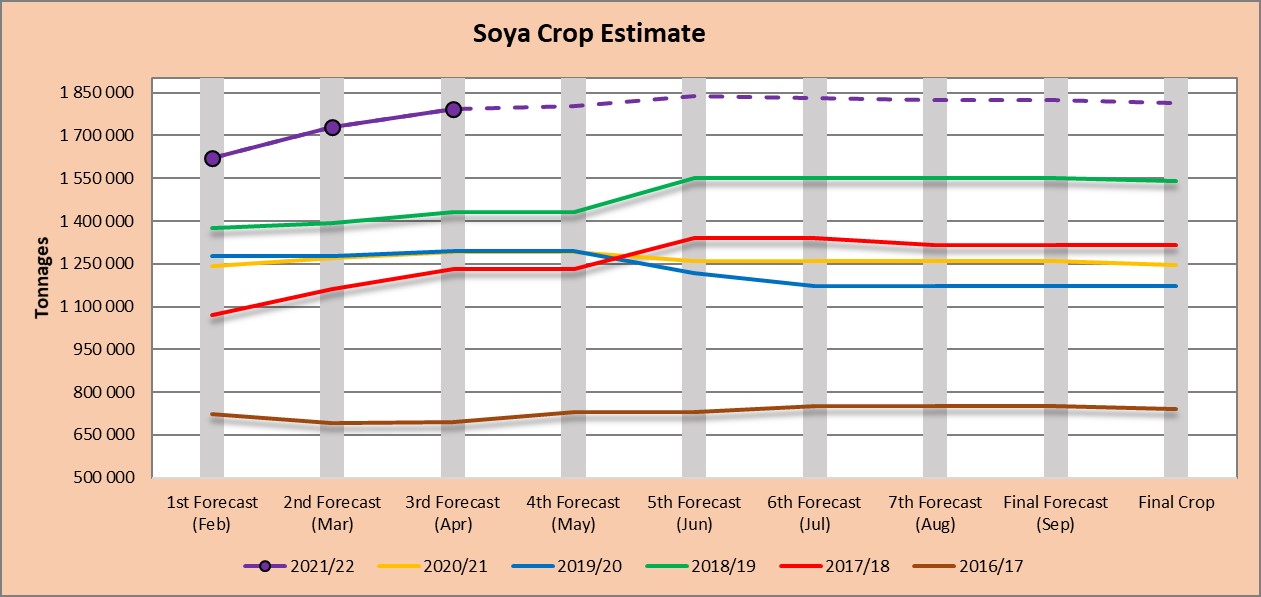
- Crop estimates (Graphs 2a to 2d)
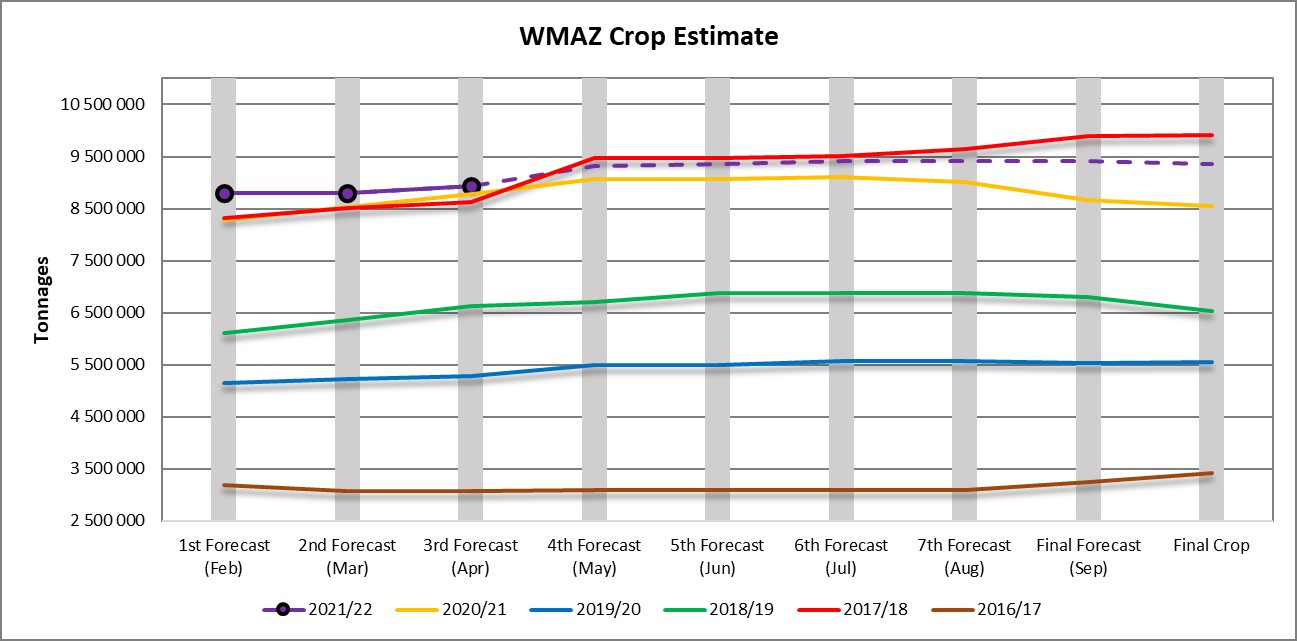
According to the Crop Estimates Committee (CEC), the size of the expected commercial maize crop has been set at 16,096 million tons – 1,09% or 173 800 tons more than the previous forecast of 15,922 million tons. The area estimate for maize is 2,755 million hectares, while the expected yield is 5,84 tons per hectare.
The area estimate for white maize is 1,692 million hectares and for yellow maize the area estimate is 1,063 million hectares.
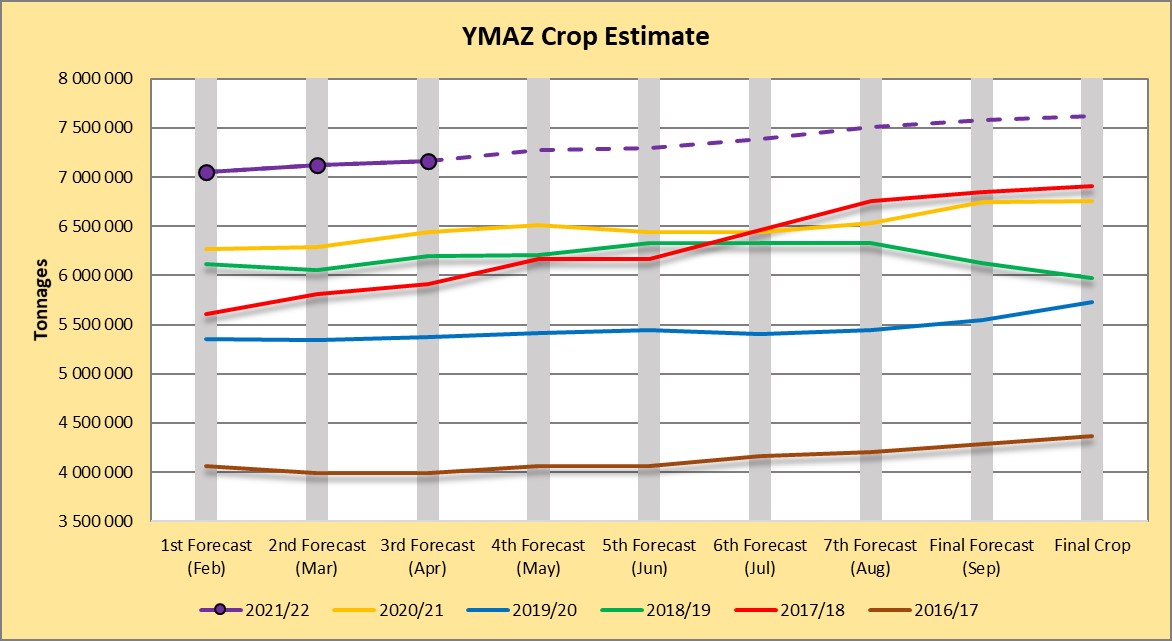
The production forecast of white maize is 8,934 million tons, which is 1,57% or 137 800 tons more than the 8,796 million tons of the previous forecast. The yield for white maize is 5,28 tons per hectare. In the case of yellow maize the production forecast is 7,162 million tons, which is 0,51% or 36 000 tons more than the 7,126 million tons of the previous forecast. The yield for yellow maize is 6,73 tons per hectare.
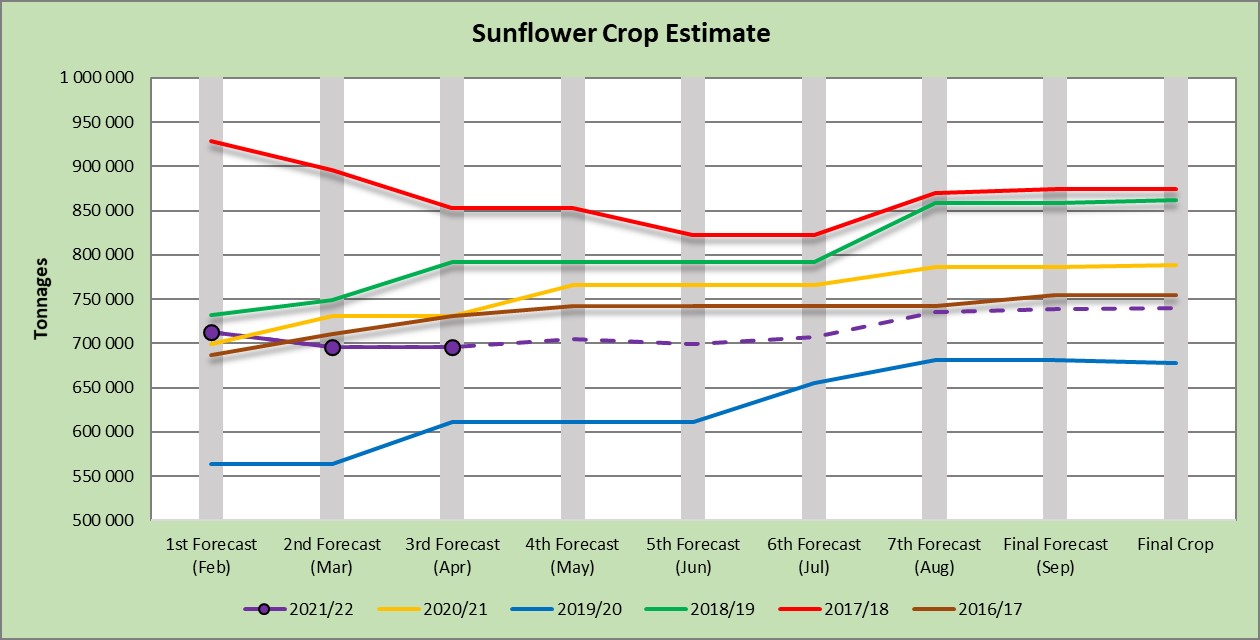
The production forecast for sunflower seed remained unchanged at 696 290 tons. The area estimate for sunflower seed is 477 800 hectares, while the expected yield is 1,46 tons per hectare.
The production forecast for soybeans increased by 3,79% or 65 500 tons to 1,794 million tons. The estimated area planted to soybeans is 827 100 hectares and the expected yield is 2,17 tons per hectare.
Source: CEC (Crop Estimates Committee)
Source: CEC (Crop Estimates Committee)
The production forecast for sunflower seed remained unchanged at 696 290 tons. The area estimate for sunflower seed is 477 800 hectares, while the expected yield is 1,46 tons per hectare.
Source: CEC (Crop Estimates Committee)
The production forecast for soybeans increased by 3,79% or 65 500 tons to 1,794 million tons. The estimated area planted to soybeans is 827 100 hectares and the expected yield is 2,17 tons per hectare.
Source: CEC (Crop Estimates Committee)
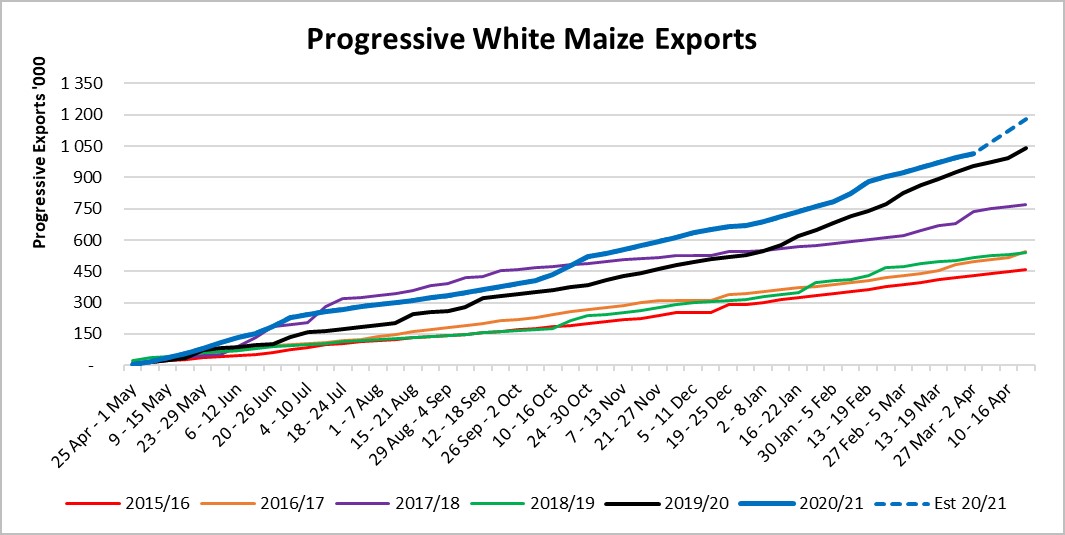
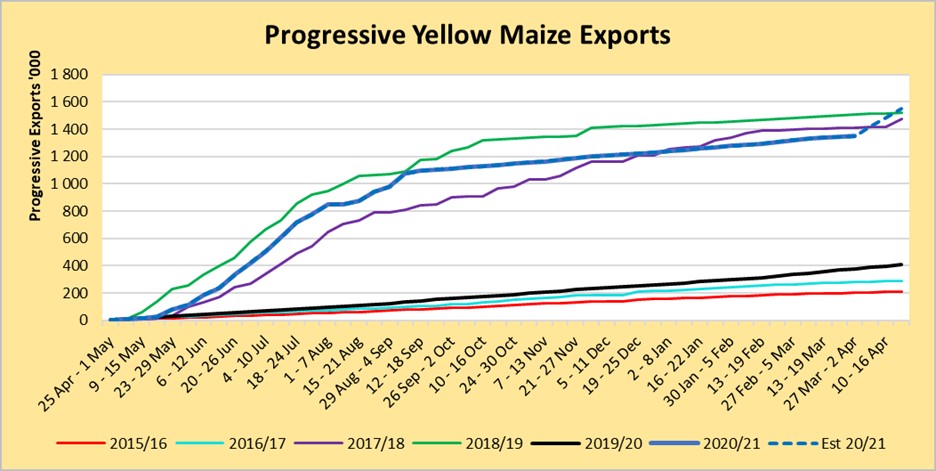
- Imports and exports – national
Source: Sagis
To date, 1 013 621 tons of white maize and 1 350 429 tons of yellow maize have been exported since the beginning of May 2020 (Graphs 3a to 3d).
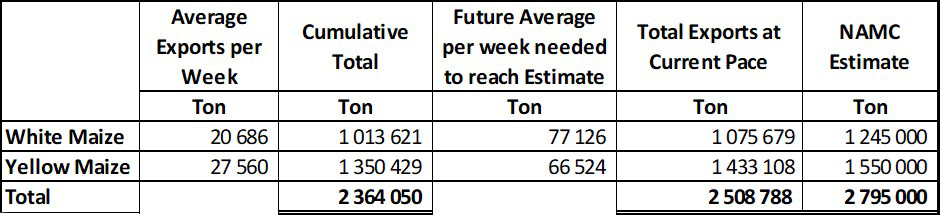
As seen in Table 1, the average white maize exports per week are currently 20 686 tons. If theoretically, white maize exports remain at the current average of 20 686 tons per week then there would be 169 321 tons less white maize exports than anticipated.
The average yellow maize exports per week are currently 27 560 tons. If theoretically, yellow maize exports remain at the current average of 27 560 tons per week then there would be 116 892 tons less yellow maize exports than anticipated.
Source: Sagis
- Parity prices
South Africa is a small producer compared to other countries and is thus a price taker (meaning that we cannot influence world prices). Because of this, our local prices are normally between import and export parity, which is illustrated in Graphs 4a and 4b. An import parity price is defined as the price that a buyer will pay to buy the product on the world market. This price will include all the costs incurred to get the product delivered to the buyer’s destination.
An export parity price is defined as the price that a local seller could receive by selling his product on the world market e.g., excluding the export costs. The price which the seller obtains is based on the condition in which he delivers the product at the nearest export point (usually a harbour) at his own expense.
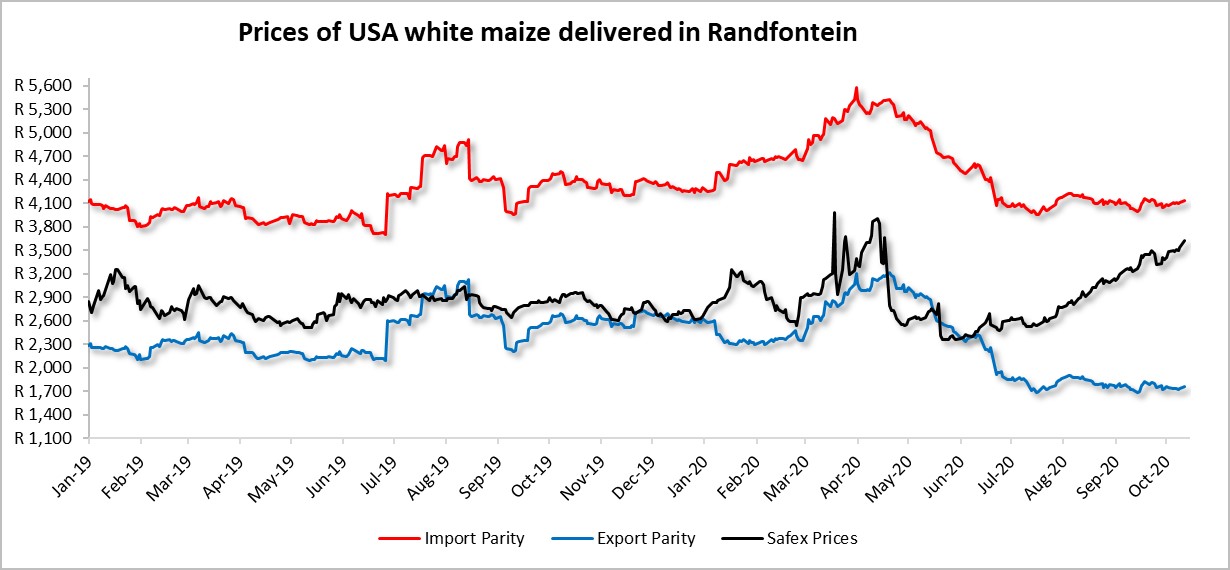
Source: Grain SA (No further data available for white maize)
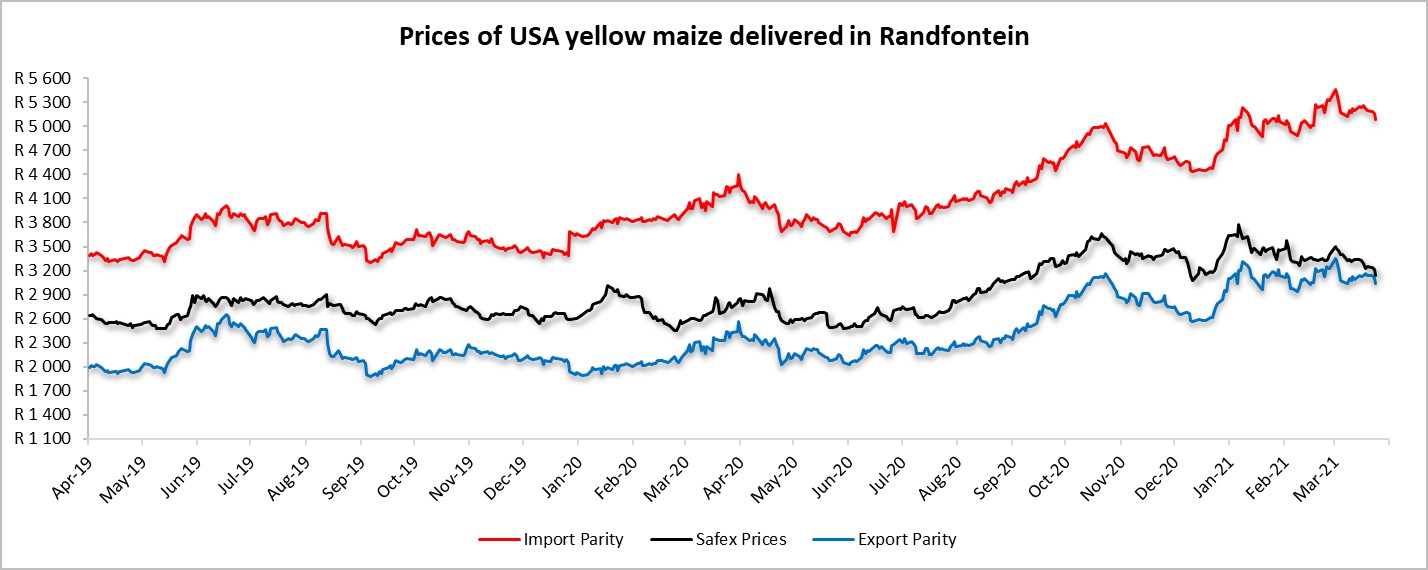
Source: Grain SA
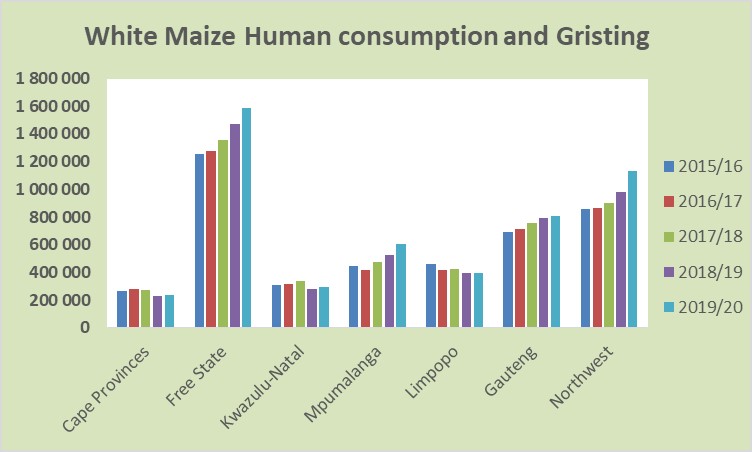
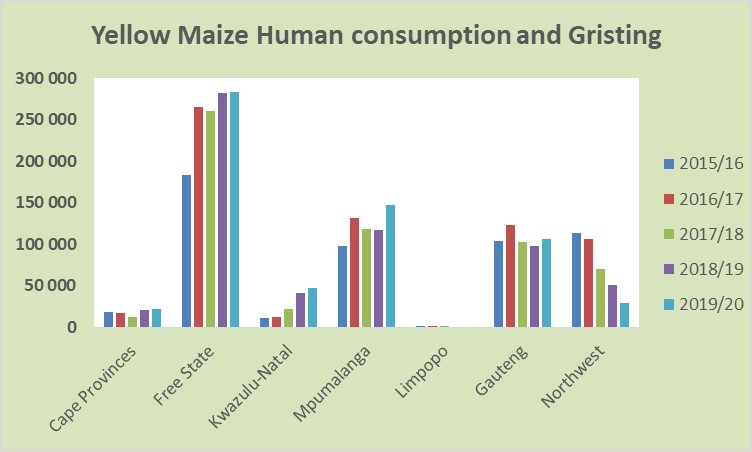
- Producer deliveries – provincial
For the marketing year which stretches from May to April, the Free State dominates the white maize that is used for human consumption and gristing (Graphs 5a and 5b). North West showed a significant increase for the 2019/2020 season, with a 16% rise over the previous season.
North West has a decreasing trend in y maize which is used for consumption and gristing. Only 29 157 tons of yellow maize was used in the 2019/2020 season that ended April 2020.
- Exchange rate
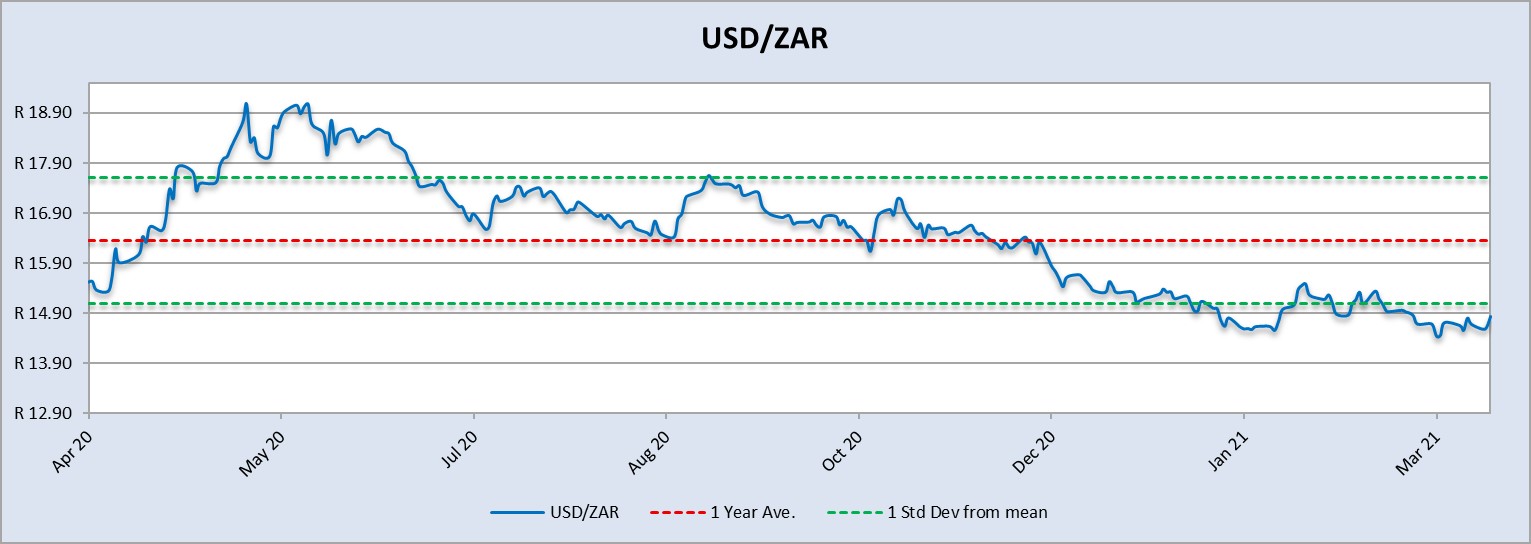
Source: Standard Bank, Corporate and Investment Banking & SARB
On a monthly average basis, the exchange rate appreciated with 1,62% (0,24c) over the period February 2021 to March 2021. The period May 2020 to June 2020 showed a very weak exchange rate that traded above the 1 standard deviation from the mean. The one-year average for rand/US dollar is R16,35. Moreover, the average rand/US dollar exchange rate for the period March 2021 was R14,99 compared to R14,75 of February 2021.
As seen in Graph 6 the rand is starting to recover.
- Exchange rate forecast
Graph 7 shows the actual USD/ZAR for 2020 Quarter 4 (Q4) and 2021 Quarter 1 (Q1) against the forecasted figures. Absa’s forecast for 2020 Q4 was the closest to actual and trading economics were the closest for 2021 Q1. According to The Economic Forecast Agency, the rand will strengthen a lot in the year 2021.
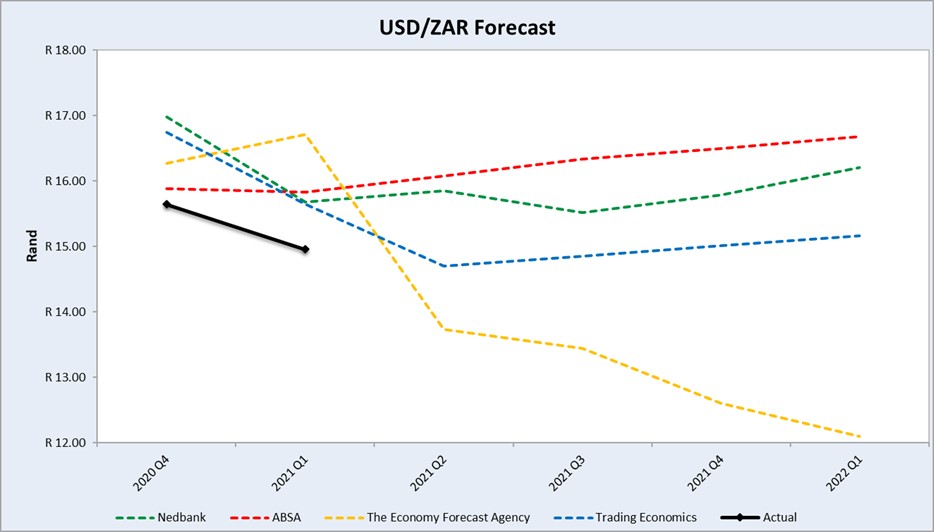
Source: Nedbank CIB; Absa; The Economic Forecast Agency and Trading Economics
- Future prices
Graphs 8a and 8b illustrate the market sentiment for maize, in the form of future contracts, for the upcoming contract months.
The market sentiment is the expectation of supply and demand fundamentals relating to white and yellow maize in South Africa.
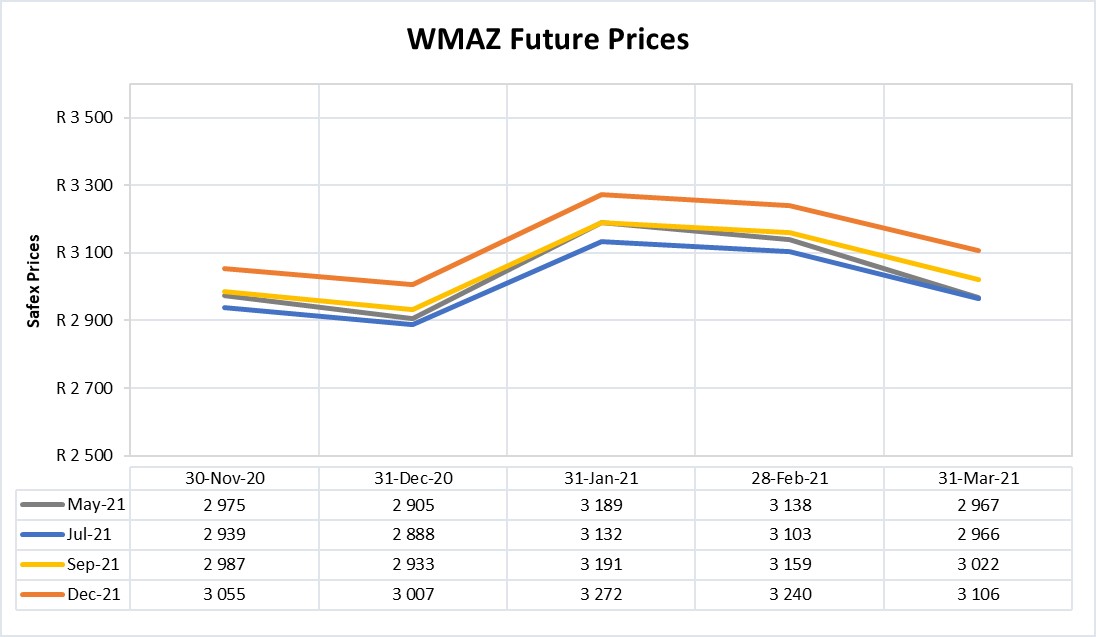
Source: Sagis
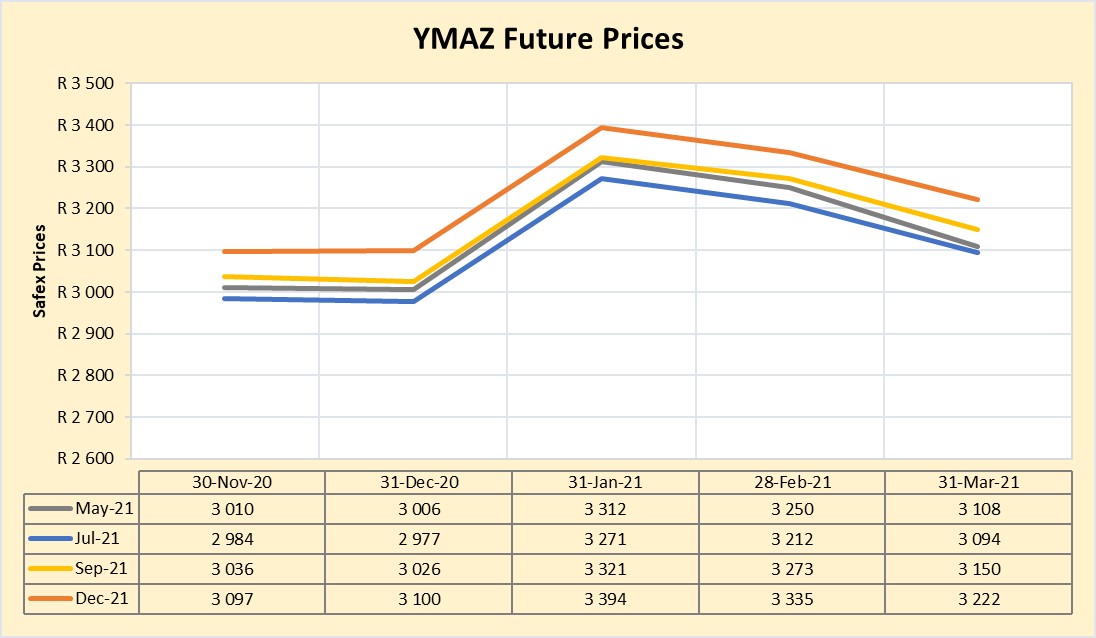
Source: Sagis
- Weather and climate
La Niña continued during March, reflected by negative sea surface temperatures (SST) anomalies, which extended across much of the equatorial Pacific Ocean. There is a 50% chance of La Niña for the March to May average, then the ENSO will become neutral after this period. See Graph 9.
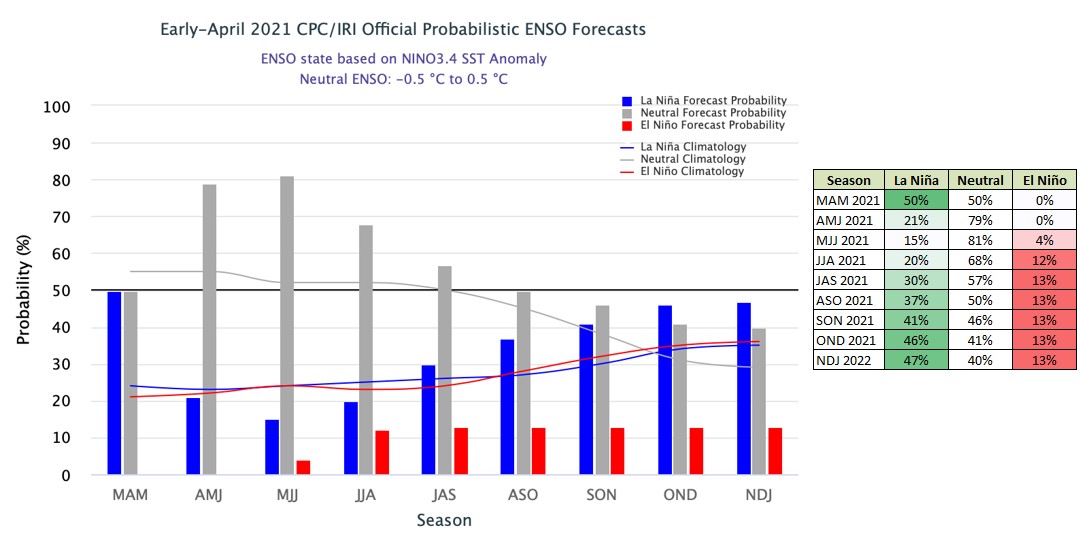
Source: International Research Institute for Climate and Society
The El Niño-Southern Oscillation (ENSO) is neutral. The model outlooks for NINO3.4 indicates that it will remain neutral until at least September (Figure 1).
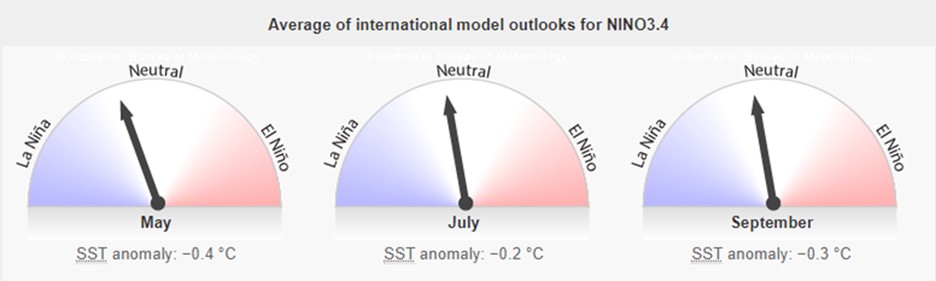
Source: Australian Government – Bureau of Meteorology
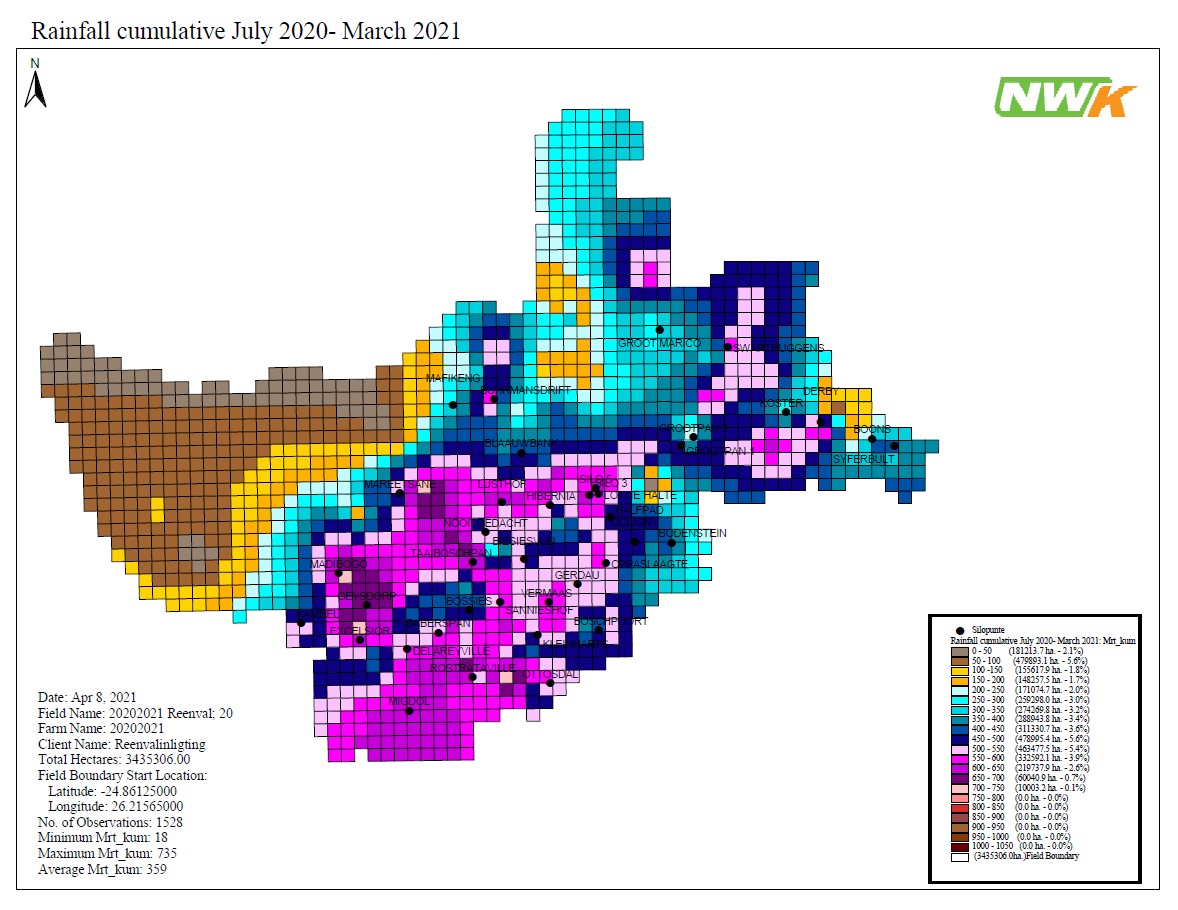
March received poor rainfall (Figure 2). This may be due to the number of tropical cyclones east of Madagascar and the low pressure in the Mozambique channel. Its effect, together with the hot and dry climate, can be clearly seen in the maize yields. Nevertheless, there are good harvests on the fields. Sunflower did not suffer significant damage due to the dry hot March. On the contrary, it kept Sclerotinia at a distance.
During a La Niña year, cold fronts tend to move further south of the country. The result is that it would rather frost later in the northern inland than usually. The Cape will therefore receive rain later than usual.
- Interest rate risk
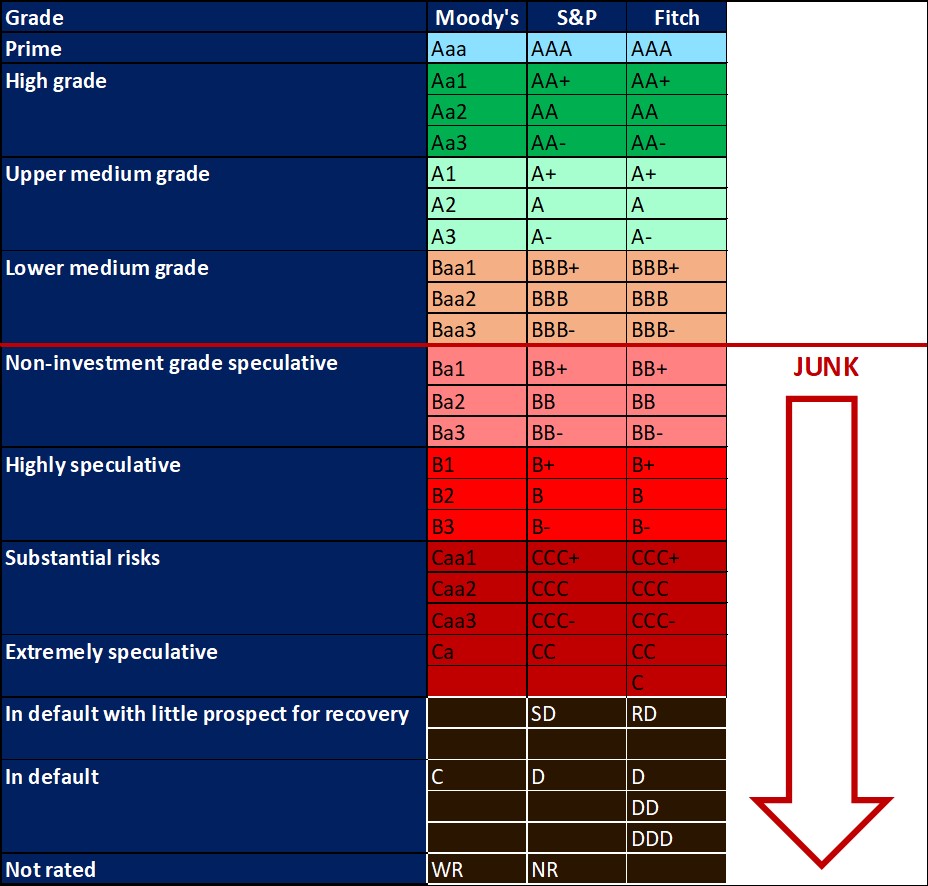
On 27 March 2020, Moody’s downgraded South Africa’s sovereign credit rating to sub-investment grade and placed a negative outlook on the rating. The key drivers for this downgrade include weak economic growth, continuing deterioration in fiscal strength, and slow progress on structural economic reforms.
It is now the first time in post-apartheid South Africa where all major rating agencies, i.e., Moody’s, Fitch and S&P, have South Africa’s credit ratings in sub-investment grade territory.
The COVID-19 pandemic forced the South African Reserve Bank to make a number of interest rate cuts to bring relief to the economy. Interest rate movement:
- 20 March 2020 – 8,75%
- 15 April 2020 – 7,75%
- 22 May 2020 – 7,25%
- 23 July 2020 –7,00%
Since the Monetary Policy Committee meeting in July 2020, the interest rate stayed unchanged.
Source: Atlas Magazine & NWK Risk Management
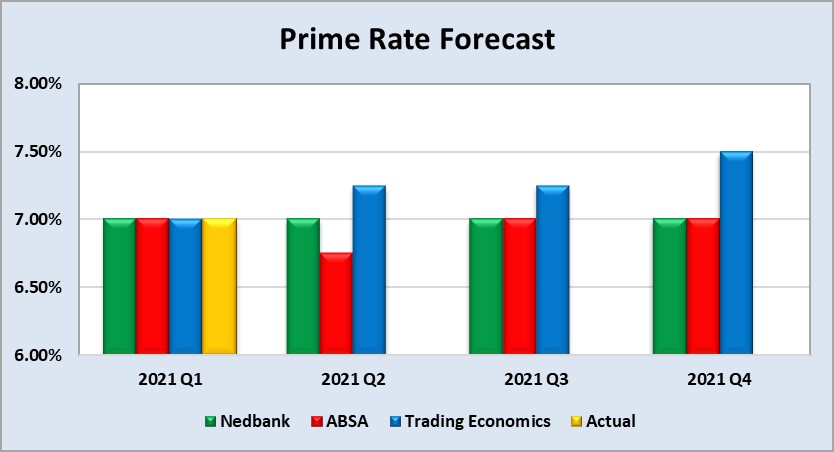
Graph 10 shows the prime rate forecast for 2021 Quarter 2 to 2021 Quarter 4. Absa forecasts that the prime interest rate will be cut by a further 25 basis points. The next MPC meeting date is 20 May 2021.
4. FRAUD RISK
a. Fraud awareness
SymQuest believes that business data is more vulnerable than ever before. It is also critical for protecting our customers’ information.
Following IT best practices goes beyond using the latest technology; it’s about staying ahead of risks and disasters. When creating cybersecurity procedures, SymQuest suggests using a layered security model. This model begins with the internet and ends with the company employees. The fourth point in this layered security model that will be referred to is firewalls. In the coming reports, additional points of the model will be included.
With cybersecurity becoming such an important component of almost any business The Committee of Sponsoring Organisations of the Treadway Commission (COSO) plans to issue detailed recommendations on how organisations can better manage risks related to cloud computing, artificial intelligence and outside contractors, among other topics in the year ahead.
The final version of the Cybercrime Bill is also completed and ready to become law. The law will effectively deal with cybercrimes.
b. Fraud tip
The fraud prevention tip for this month is: Monitor vacation balances. It is important for a company to compel employees to take at least ten continuous leave days per year. While you may think it is a sign of good work ethic if an employee hasn’t missed a day of work in years, it could actually be a red flag. The employee might have something to hide and is worried that someone will detect their fraud when they are on leave for some time. It is a good idea to rotate employees between different roles. When they review another employee’s work it may reveal fraudulent activities that otherwise would have been missed.


