
The NWK Limited external factors report provides an overview of the main external factors that NWK and its clients are exposed to at a specific point in time. This report opts to aid in a timely basis to foresee external market and other factors that may have an impact on any business and clients. The main focus of this document is to have a closer look at external factors that can affect any business and our customers.
Executive summary
Inflation rates eased, but the world economy is slowing down and economists expect a global recession this year. On a year-to-year movement retail trade decreased slightly and the unemployment rate is down to 32,9% in quarter three of 2022. The agricultural sector was the biggest contributor to the overall GDP growth of 1,6% even though one thousand jobs were cut in the mining and agricultural sector. Agricultural prices are forecast to decline in 2023, but on a positive note the Policy Uncertainty Index eased to 53,2 in Q3.
The National Agricultural Marketing Council (NAMC) projected the ending stock for 30 April 2023 of white and yellow maize to be less than the 2021/2022 season. According to the final maize forecast the three main maize producing areas, namely the Free State, Mpumalanga and North West are expected to produce 82% of the 2022/2023 crop.
The latest increase of 75 basis points (bps) came into effect on 24 November 2022. The repo rate is currently 7% and the prime rate is 10,5%.
Load shedding poses long term risks for the agricultural sector on a supply and input cost level. When producers struggle to produce outputs. NWK is directly impacted through less silo stock income and producers’ ability to repay loans. Cost effective and sustainable alternative solutions must be considered in order to reduce the dependency on Eskom for electricity. Even more so now that tariff hikes of 18,65% have been approved.
On Wednesday evening, 28 September 2022, the National Assembly adopted the controversial Expropriation Bill which currently allows the expropriation of land only for public purposes and in the interest of the public, as stipulated in Section 25 of the Constitution.
One of the topics covered during the medium-term budget speech is that South Africa’s GDP growth declined to 1,9% compared to the 2,1% estimated in February’s budget speech.
Business climate: Key risk drivers
A few highlights are pointed for certain risk drivers as new data is released monthly/quarterly.
According to Trading Economics South Africa’s annual inflation rate eased to 7,4% in November 2022 from 7,6% in the prior month, below market expectations of 7,5% but still above the upper limit of the South African Reserve Bank’s target range of 3% to 6%. It was the lowest reading since June, mainly due to a slowdown in prices of transportation (15,3% vs 17,1% in October), of which fuels (25,3% vs 30,1%). On a monthly basis, consumer prices were up by 0,3%, following a 0,4% rise in the prior month and slightly above market forecasts of a 0,2% increase.
In December the demand for Brent crude oil declined further resulting in lower prices. Brent crude futures traded near $85 per barrel for 3rd consecutive session, as investors were weighing improving demand outlook in top crude importer China against the possibility of a global recession this year. The latest data showed China’s economy expanded by 2.9% on an annualized basis in Q4, above expectations of a 1,8% growth. Still, the World Economic Forum, World Bank and major US companies are sounding the alarm about a potential slowdown this year. A survey released at the Davos summit showed that two-thirds of private and public sector economists expected a global recession this year, with about 18% considering it ‘extremely likely’.
South Africa’s retail trade was down by 0,4% from a year earlier in October of 2022, following a downwardly revised 0.4% decrease in the previous month and compared with market forecasts of a 0,5% fall according to Trading Economics data. It was the second consecutive month of contraction in retail activity and at the quickest pace since June. The largest declines in sales were recorded for hardware, paint and glass (-4,8% vs -7,2% in October); pharmaceuticals and medical goods, cosmetics and toiletries (-3,4% vs -4,8%) and food, beverages and tobacco (-2,3% vs -8,1%). On a monthly basis, retail trade rose by 0,4% in October, after an upwardly revised 0,2% increase in the previous month.
According to Statistics SA, South Africa’s unemployment rate was at 32,9% in the third quarter of 2022, down from 33.9% in the prior period and below market estimates of 33,4%. This was the lowest jobless rate since Q1 of 2021, as the number of unemployed persons declined by 269 000 to 7,725 million and employment rose by 204 thousand to 15,765 million. However, the labour force fell by 66 thousand to 23,491 million. Among sectors the largest job gains was seen in the manufacturing (+123 000), trade (+82 000), construction (+46 000) and transport (+33 000) sectors, while jobs were cut in finance (-80 000), private households (-36 000) and mining and agriculture (-1 000) each. The expanded definition of unemployment, including people who have stopped looking for work, was at 43,1%, down from 44,1% in the second quarter. The youth unemployment rate, measuring job-seekers between 15 and 24 years old, fell further to an over two-year low of 59,6% in the third quarter of 2022, but remains high.
The GDP growth for the third quarter rose by 1,6% on quarter in the three months to September of 2022, well above market forecasts of a 0.6% increase, following a 0,7% contraction in the prior quarter, partly because of a low base in the second quarter, when floods disrupted operations at a key export port in Durban. Eight out of ten activities expanded in the third quarter, with the agricultural sector (19,2%) making the biggest contribution to growth, on bumper crops. Significant increases were also seen in transportation and storage (3,7%); construction (3,1%), mining (2,1%); finance, real estate and business services (1,9%) and manufacturing (1,5%).On the expenditure side, both government spending (0,5%) and fixed investment (0,3%) rose while household consumption shrank (-0,3%). Meanwhile, net trade contributed positively as exports (4,2%) rose much faster than imports (0,6%). Year-on-year, the economy advanced by a notable 4,1%, the most since Q2 of 2021, beating market estimates of a 2,8% rise.
The Safex price was considered profitable according to December 2022 white maize spot prices. Agricultural prices are forecast to decline by 5% in 2023 before stabilising in 2024. The projected decline in 2023 reflects a better-than-expected global wheat crop and the resumption of grain exports from Ukraine (although the maize crop is expected to contract materially during the 2022/2023 season). However, there are numerous upside risks to the price forecast.
- First, disruptions in exports from Ukraine or Russia, both key grain exporters, could once again interrupt global supplies, as they did in the early stages of the war in Ukraine.
- Secondly, further increases in energy prices or disruptions in energy supplies (especially natural gas and coal, which are key inputs to fertilisers) could exert upward pressure on grain and edible oil prices.
- In the third place, adverse weather patterns can reduce yields – indeed, 2023 is likely to be the third La Niña year in a row, potentially reducing yields of key crops in South America and Southern Africa. However, things can change as see surface temperatures are forecast to rise in February, moving toward an El Niño by June. On the downside, weaker-than-expected growth, especially in China, could affect the prices of certain agricultural commodities such as maize and soybeans, which are used as animal feed.
The iron ore price saw an increase of $23,76 per metric ton from November to December. Prices for iron ore cargoes with a 63,5% iron ore content for delivery into Tianjin eased to below $122 per tonne, from the seven-month high of $127 touched in the previous session, as a rise in Covid-19 deaths in China renewed concerns over demand. Adding to woes, China is set to step up the frequency and intensity of investigations of the iron ore market after steel manufacturers were passing wrong information about iron products to unfairly bulk up prices. Still, expectations of additional support measures have brightened the outlook. China authorities will boost financing for good-quality property developers and roll out of CNY 100 billion ($14,86 billion) support plan for rental housing loans. On the supply side, Brazil’s and Australia’s iron production is expected to fall amid weather-related disruptions in Brazil and potential cyclones in Australia.
The NWU Business School PUI declined significantly to 53,2 points in the fourth quarter compared to 59.6 points in Q3, but remains in negative territory (baseline 50). The PUI is the net outcome of positive and negative factors influencing the calibration of policy uncertainty over the relevant period. It is seen to have important implications for business confidence and the investment climate in the country.
Sources:
https://tradingeconomics.com/south-africa/inflation-cpi
https://tradingeconomics.com/commodity/brent-crude-oil
https://tradingeconomics.com/south-africa/unemployment-rate
https://tradingeconomics.com/south-africa/gdpgrowth#:~:text=South%20Africa%20GDP%20Grows%201.2,expectations%20of%20a%200.7%25%20growth
https://www.statssa.gov.za/?page_id=737&id=1
https://openknowledge.worldbank.org/bitstream/handle/10986/38160/CMO-October-2022.pdf
https://tradingeconomics.com/commodity/iron-ore
NWU Business School Policy Uncertainty Index (PUI) 4Q 2022_09012023_pdf
Weather and climate
NATIONAL ASSESSMENT
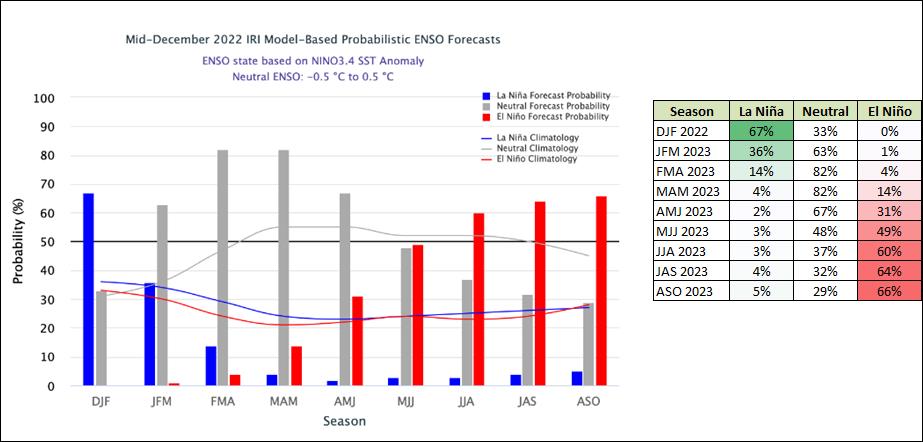
La Niña is expected to transition into ENSO-neutral during Jan-Mar 2023, which remains the most likely category until April to June 2023. The likelihood of El Niño remains low through April to June 2023 (49% chance), and becomes the dominant category thereafter with probabilities in the 60% to 66% range.
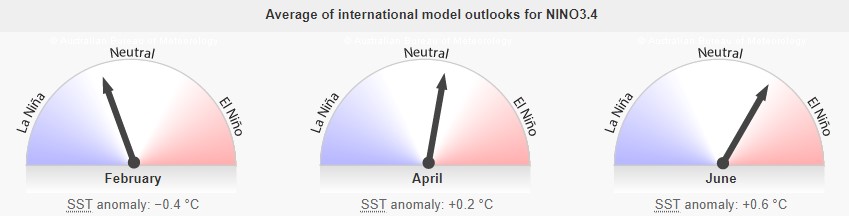
All models indicate a return to neutral NINO3.4 index values by February 2023. Neutral ENSO SSTs are between -0,5°C and 0,5°C. The current SSTs for November to March range from -1,1°C to -0,2°C.
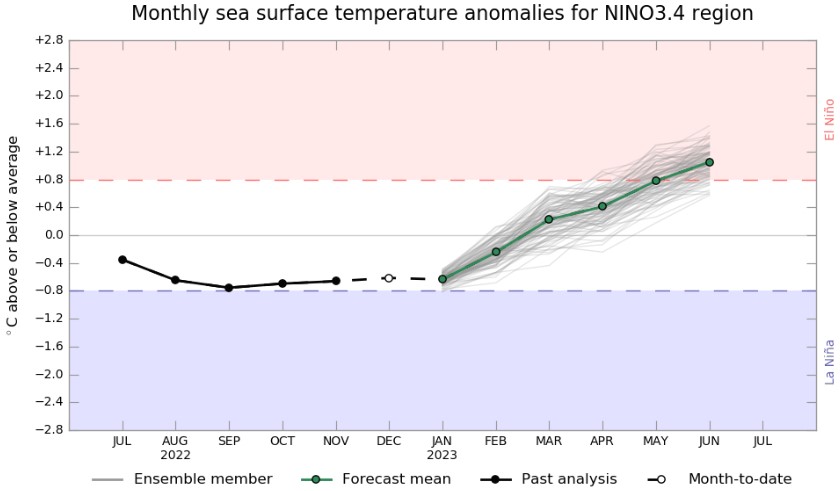
According to the above graph ENSO is still in a La Niña phase, but ocean temperatures near the equator is slowly starting to get warmer. The graph also shows that it is likely that an El Niño will form later this year in June. The upward trajectile of the graph shows that there will already be less rain than usual as temperatures rise.
The current view on 16 January 2023 is:
-
- The next ten days will be warm and dry.
- Possible rain at the end of the week ending 20 January 2023.
- The rest of the season will become drier.
- Early maize plantings might deliver the best yields.
- Good grain quality is expected.
- Sclerotinia on sunflowers won’t be a problem this season.
Source: Martiens du Plessis (16/01/2023)
Market risk
GRAIN MARKET ANALYSIS
• Ending stock – national
Ending stock data is gathered from the NAMC. The estimates are reassessed and reported by the Grain and Oilseeds Supply and Demand Estimates Committee. The following is a summary of the April 2023 projected final ending stock for the 2022/2023 season in tonnages:
- White maize => 1 273 399 t
- Yellow maize => 963 272 t
The following is a summary of September 2023 ending stock estimates for the 2022/2023 season:
- Wheat => 681 278 t
The following is a summary of February 2023 estimated ending stock for the 2022/2023 season:
- Sunflower => 58 090 t
- Soybeans => 193 287 t
- Sorghum => 45 642 t
The graph below shows the estimated ending stock (based on a five-year average) for white maize in April 2023, which is 38 884 tons more than the 2021/2022 season.
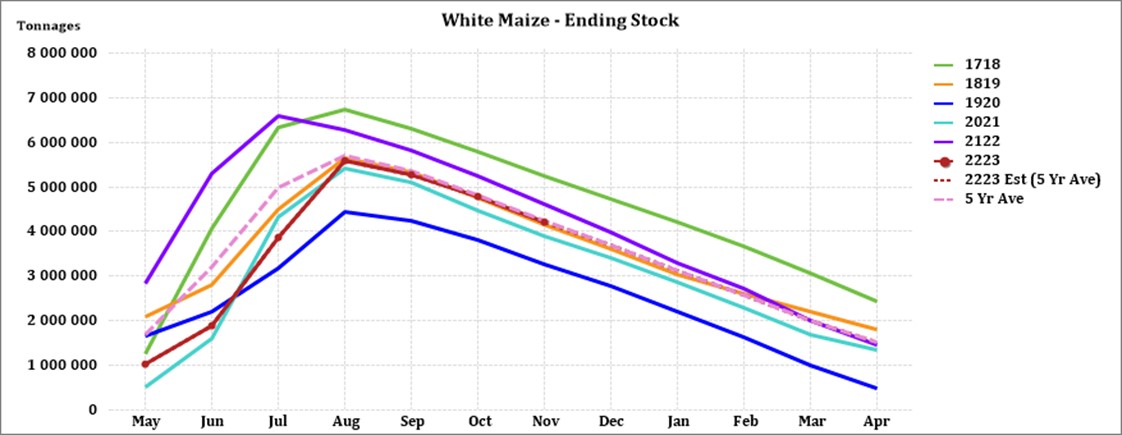
Source: Sagis
Yellow maize shows an estimated 155 755 tons increase in ending stock compared to the previous season – see graph below.
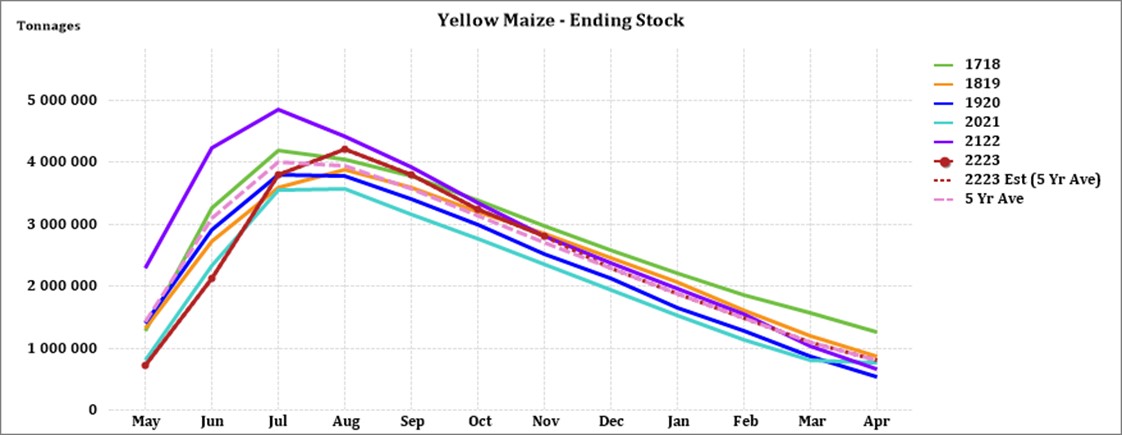
Source: Sagis
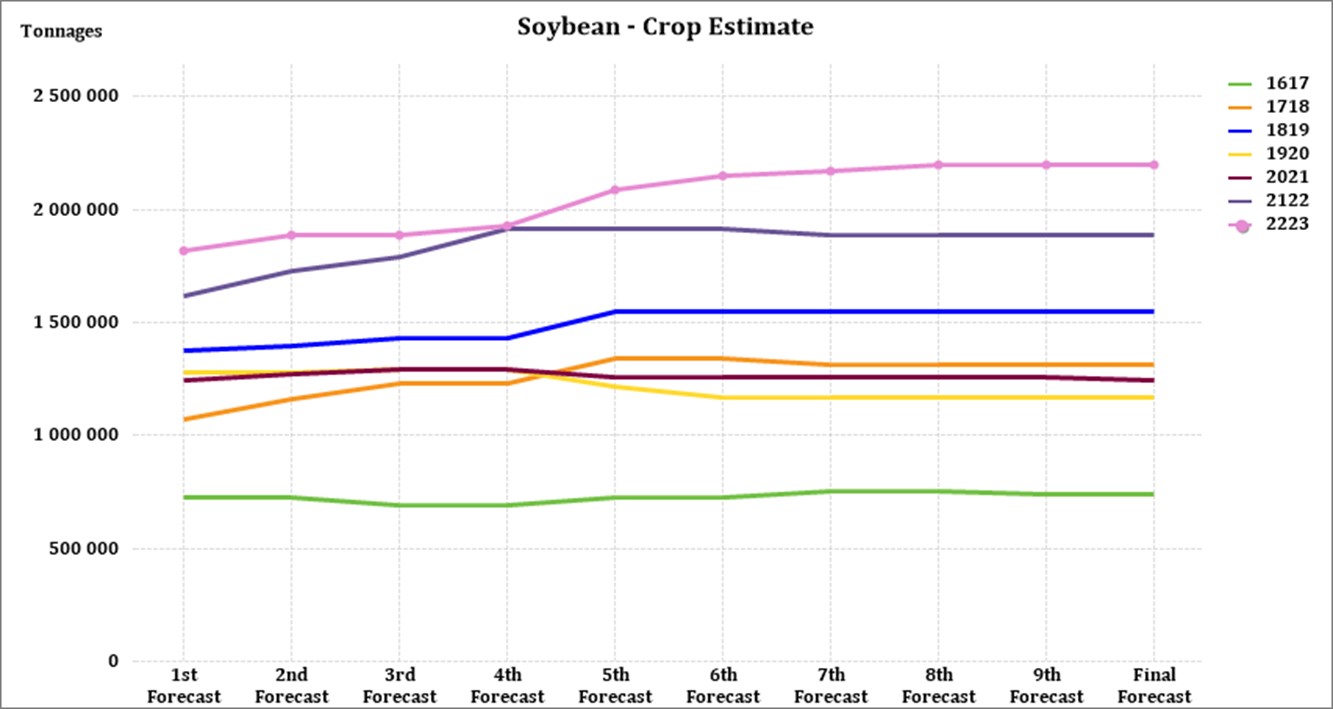
The estimated soybeans ending stock for February 2023 is 68 747 tons more than February 2022.
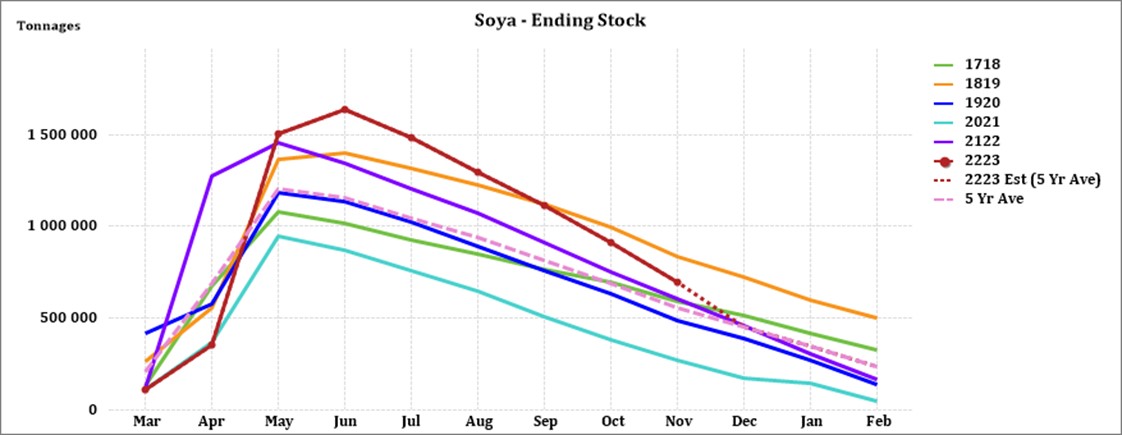
Source: Sagis
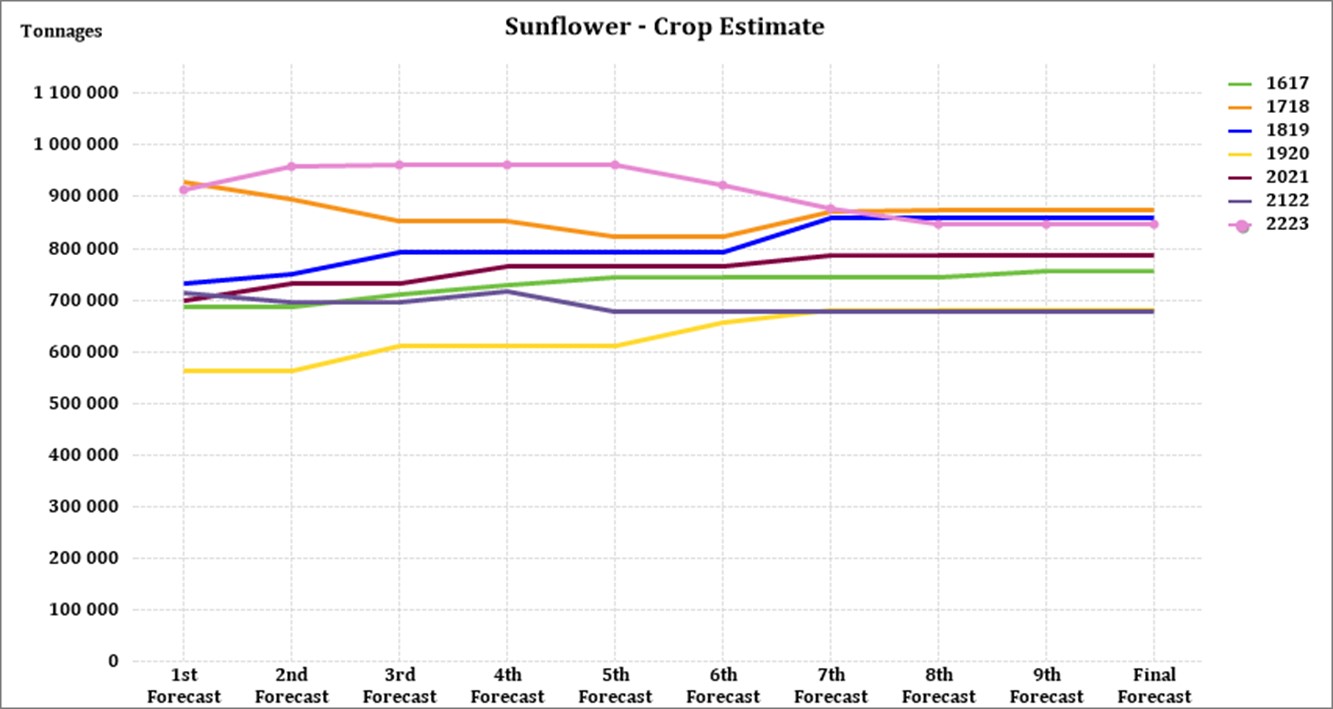
The estimated sunflower ending stock is (68 827 tons) more than the previous season ending stock.
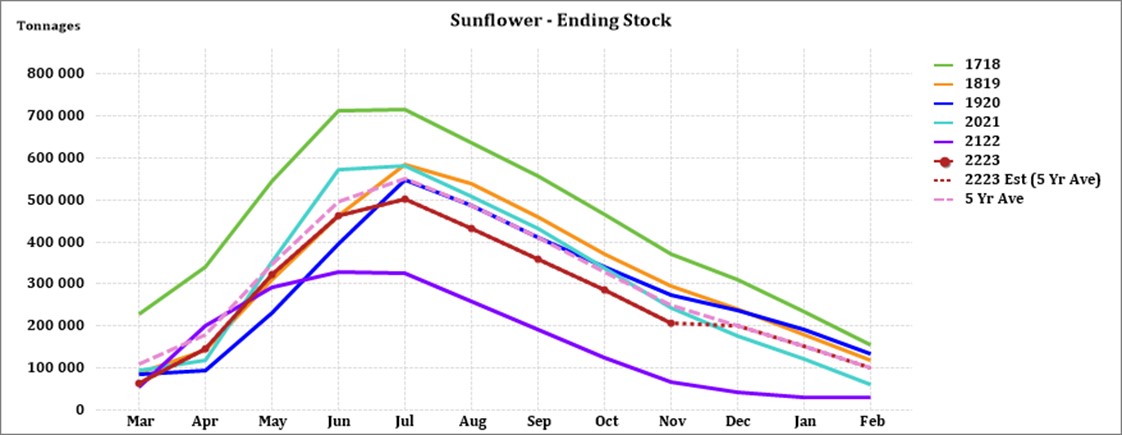
Source: Sagis
• Crop estimations
According to the Crop Estimate Committee (CEC), the preliminary area estimate for maize is 2,623 million hectares, which is 5% less than the actual 2,755 million hectares planted for the previous season.
For the final forecast, the preliminary area estimate for white maize is 1,575 million hectares, which represents a decrease of 7% compared to the actual 1,692 million hectares planted last season. In the case of yellow maize, the area estimate is 1,048 million hectares, which is 1,5% less than the actual 1,064 million hectares planted last season.
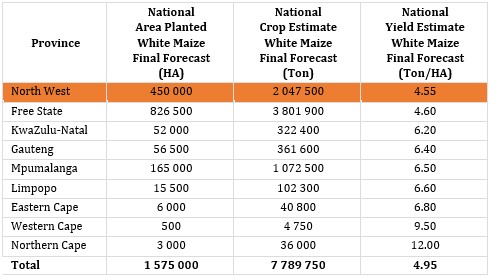
Source: CEC (Crop Estimates Committee)
Source: CEC (Crop Estimates Committee)
Source: CEC (Crop Estimates Committee)
The final area estimate for sunflower seed is 670 700 ha, which is 40% more than the 477 800 ha planted the previous season.
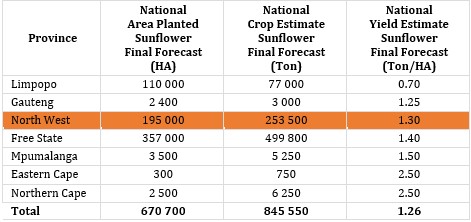
Source: CEC (Crop Estimates Committee)
Source: CEC (Crop Estimates Committee)
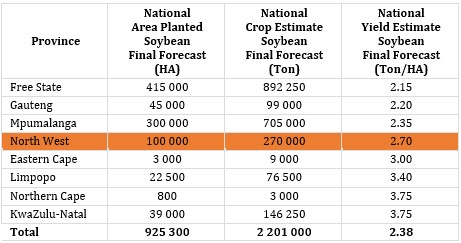
It is estimated that 925 300 ha have been planted to soybeans, which represents an increase of 12% compared to the actual 827 100 ha planted last season. This is the highest soybean area planted in the history of South Africa.
Soyabean forecast per province
Source: CEC (Crop Estimates Committee)
• Imports and exports – national
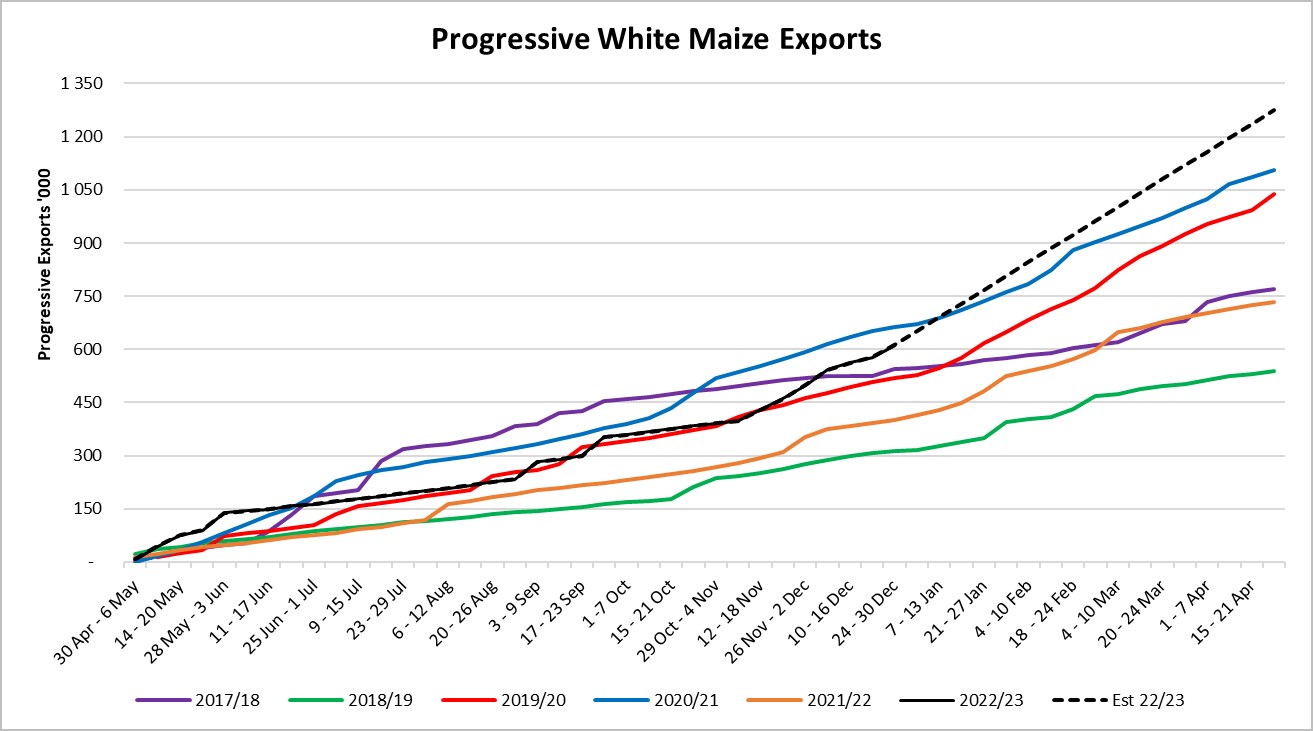
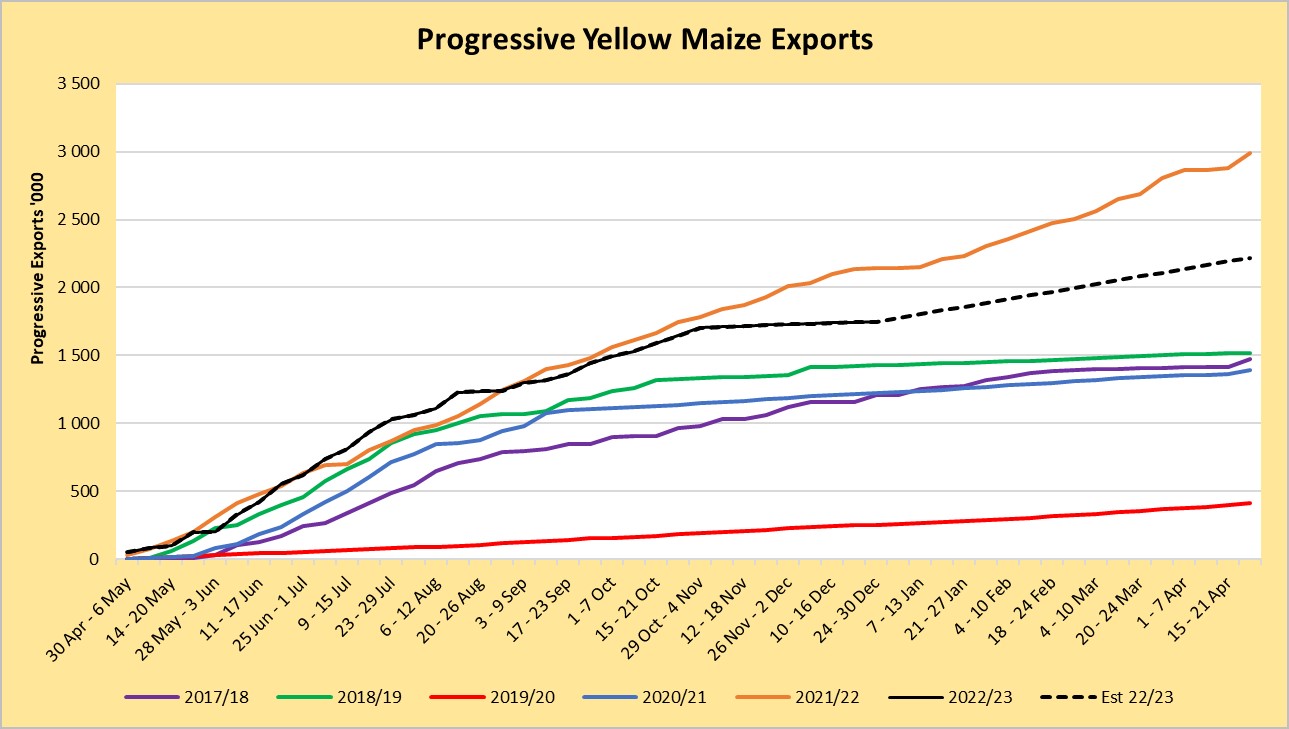
For the production season ending April 2023, 611 727 tons of white maize and 1 747 931 tons of yellow maize have been exported to date (week ending 30 December 2022) as seen in the graphs below, In the previous season a record number of 2 991 129 tons yellow maize was exported. This was mainly due to South Africa’s competitive export parity prices compared to the rest of the world.
Source: Sagis
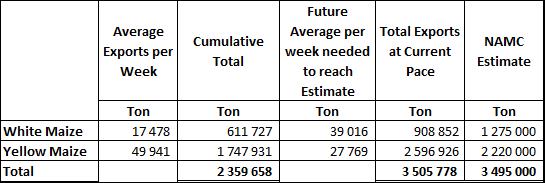
As seen in the table above, the average white maize exports per week are currently 17 478 tons. If theoretically, white maize exports remain at the current average per week then there would be 366 148 tons less white maize exports than anticipated.
The average yellow maize exports per week is currently 49 941 tons. If theoretically, yellow maize exports remain at the current average per week then there would be 376 926 tons more yellow maize exports than anticipated.
Source: Sagis
• Parity prices
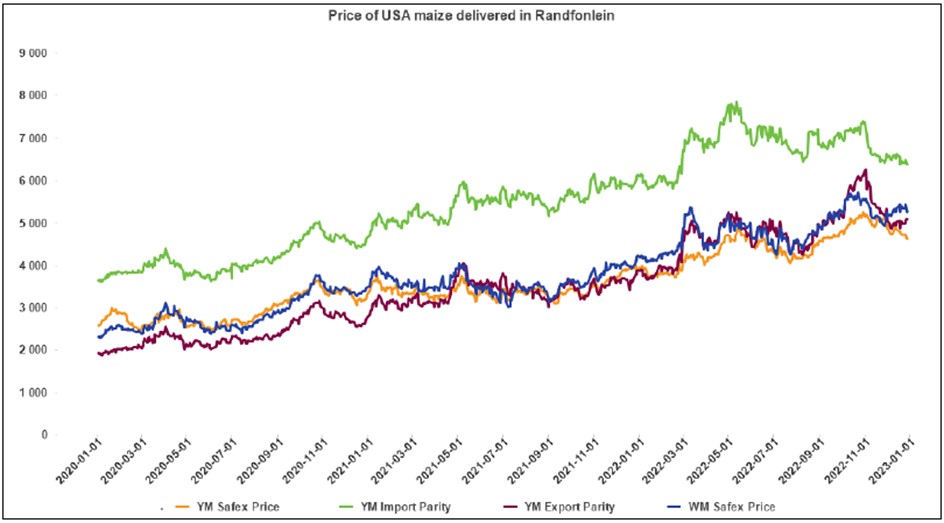
South Africa is a small producer compared to other countries and is thus a price taker (meaning that we cannot influence world prices). Because of this, our local prices are normally between import and export parity, which is illustrated in the graph below. An import parity price is defined as the price which a buyer will pay to buy the product on the world market. This price will include all the costs incurred to get the product delivered to the buyer’s destination.
An export parity price is defined as the price that a local seller could receive by selling his product on the world market e.g., excluding the export costs. The price which the seller obtains is based on the condition that he delivers the product at the nearest export point (usually a harbour) at his own expense.
The graph below reflects the Safex price, import parity and export parity of yellow maize as well as the Safex price of white maize. The import and export parity prices for white maize are not released by Grain SA for this period.
Source: Grain SA
• Producer deliveries – provincial
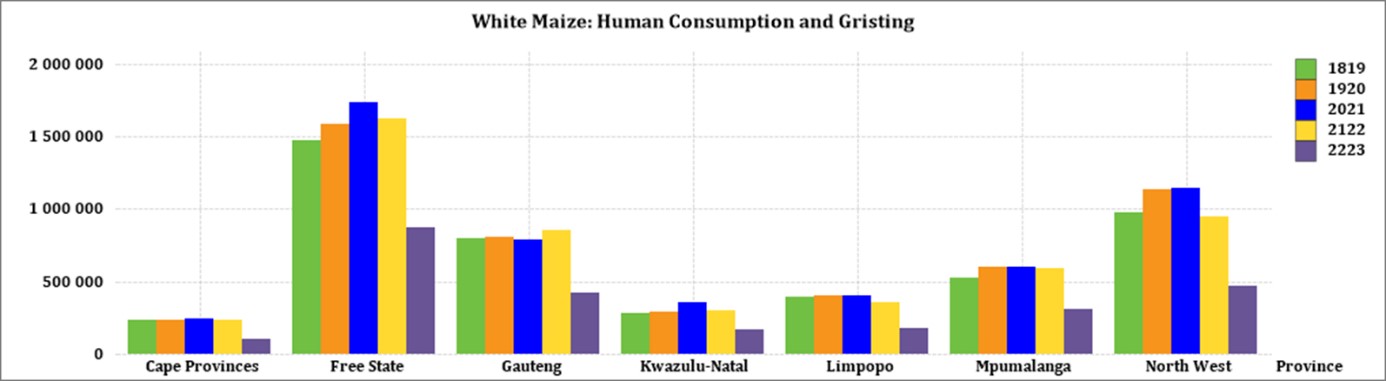
For the marketing year which is May to April (2022/2023) the Free State dominates the white maize which is used for human consumption and gristing. North West showed a decrease in white maize human consumption for the three month period ending October 2022.
Source: Sagis
The Cape provinces uses the most white maize for animal feed and industrial usage.
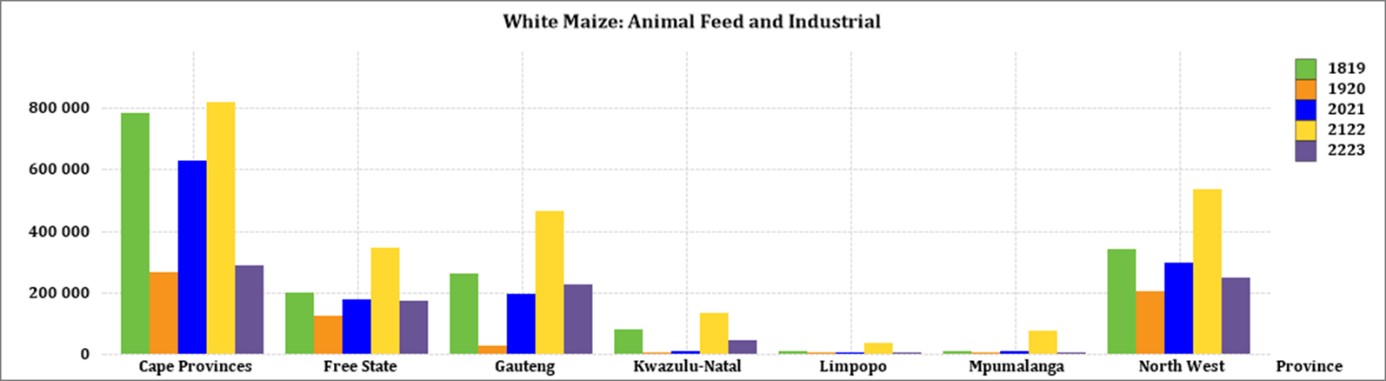
Source: Sagis
North West has a decreasing trend in yellow maize which is used for consumption and gristing. For the three month period ending October 2022 North West processed an accumulative of 4 969 tons of yellow maize.
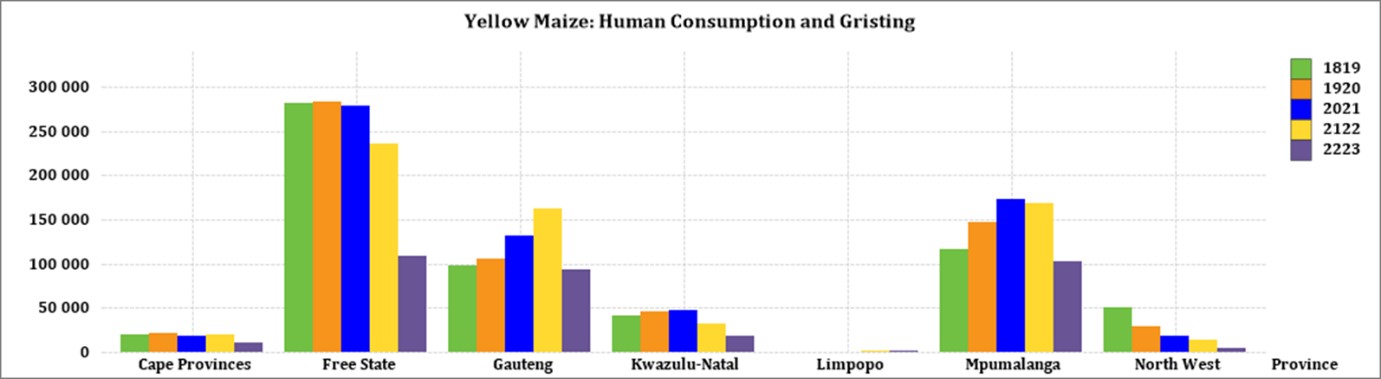
Source: Sagis
When it comes to yellow maize used for animal feed and industrial usage. Gauteng is the biggest consumer.
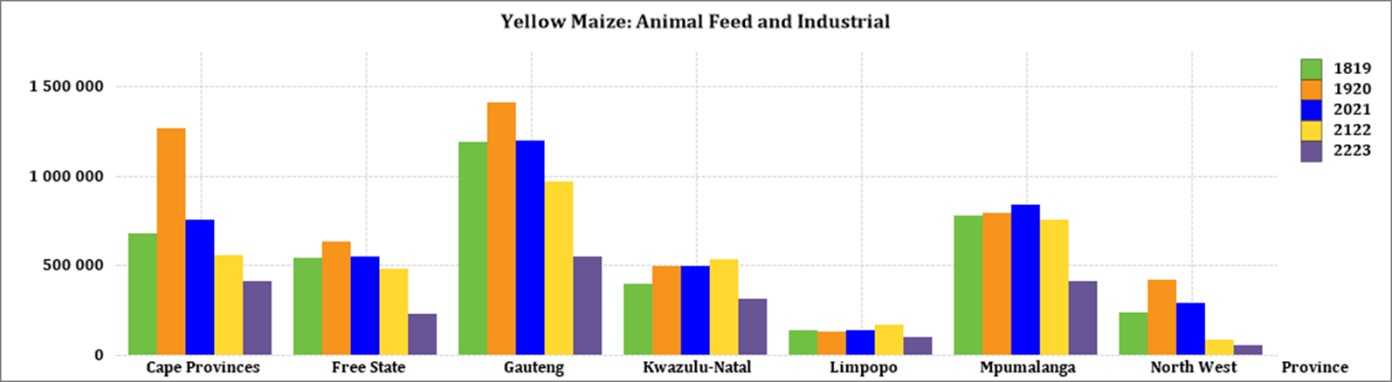
Source: Sagis
• Exchange rate
NWK Group is exposed to foreign exchange rate risk on various business areas, such as commodity prices and trade imports.
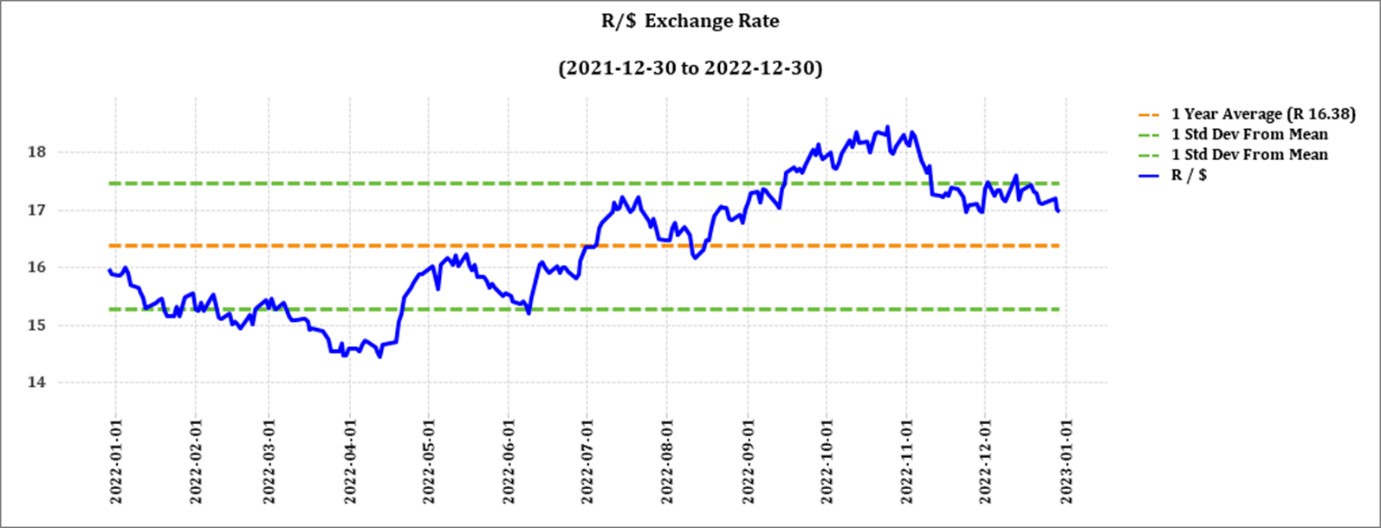
Source: Standard Bank, Corporate and Investment Banking & SARB
On a monthly average basis, the rand depreciated against the US dollar with 1,18% (R0,21) over the period November 2022 to December 2022. The one-year average for rand/US dollar is R16,38. Moreover, the average rand/US dollar exchange rate for the period December 2022 was R17,28 compared to R17,49 in November 2022. Since the middle of August the rand/US dollar exchange rate has been higher than the one-year average.
Exchange rate forecast:
The graph below shows the actual USD/ZAR for 2022 Quarter 1 (Q1) to 2023 Quarter 2 (Q2) against the forecasted figures.
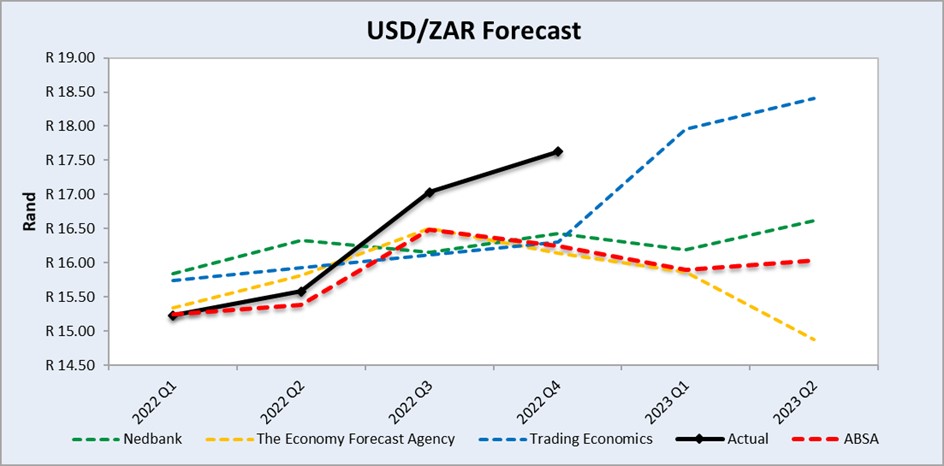
Source: Nedbank CIB; Absa; The Economic Forecast Agency; Trading Economics
• Interest rate risk
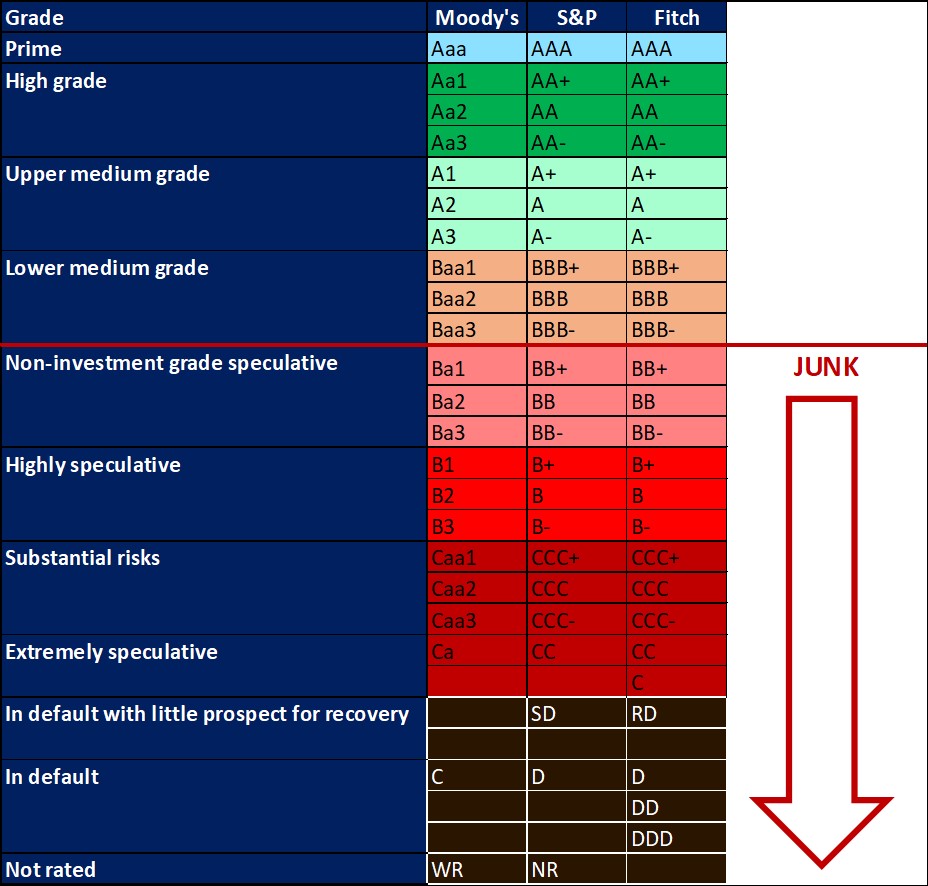
On 27 March 2020, Moody’s downgraded South Africa’s sovereign credit rating to sub-investment grade and placed a negative outlook on the rating. The key drivers for this downgrade include weak economic growth, continuous deterioration in fiscal strength, and slow progress on structural economic reforms, It is now the first time in post-apartheid South Africa where all major rating agencies, i.e. Moody’s, Fitch and S&P, have South Africa’s credit ratings in sub-investment grade territory. More than a year later and our Moody’s rating remains the same.
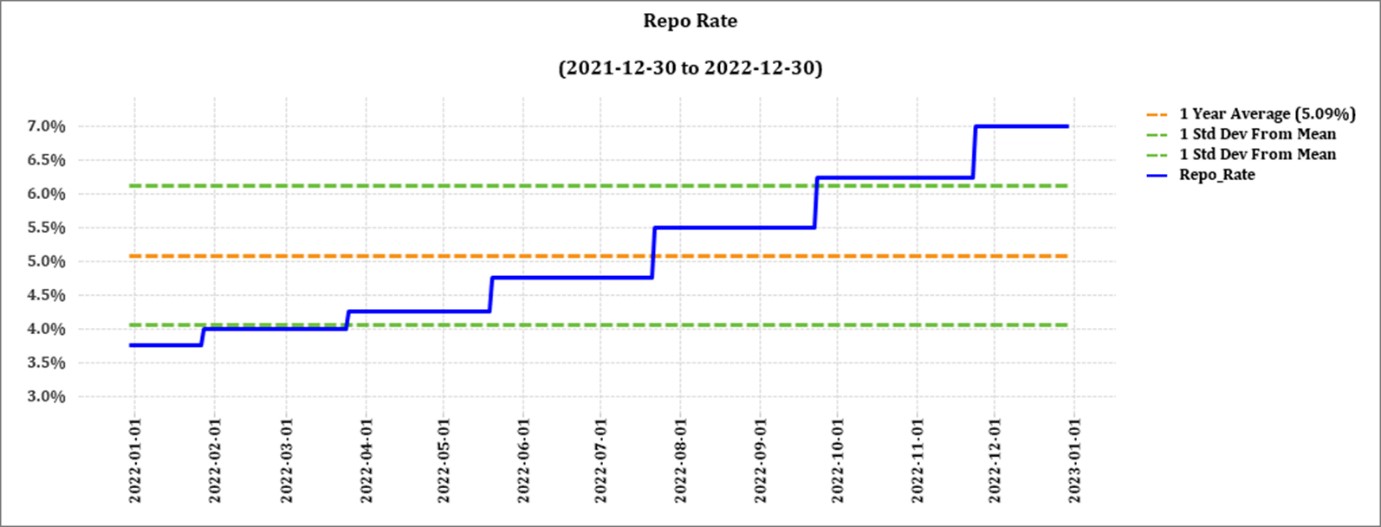
The latest increase of 75 basis points (bps) came into effect on 24 November. This is followed by an annual inflation rate of 7,4%. The South African Reserve Bank made several interest rate cuts amounting to 300 bps to bring relief to the economy, but as of November 2021 the prime interest rate experienced six increases amounting to a total of 350 bps. The repo rate is currently 7% and the prime rate is 10,5%.
The next MPC meeting date is 26 January 2023.
Interest rate movement:
- 27 January 2022: 7,50%
- 24 March 2022: 7,75%
- 19 May 2022: 8,25%
- 21 July 2022: 9,00%
- 22 September 2022: 9,75%
- 24 November 2022: 10,50%
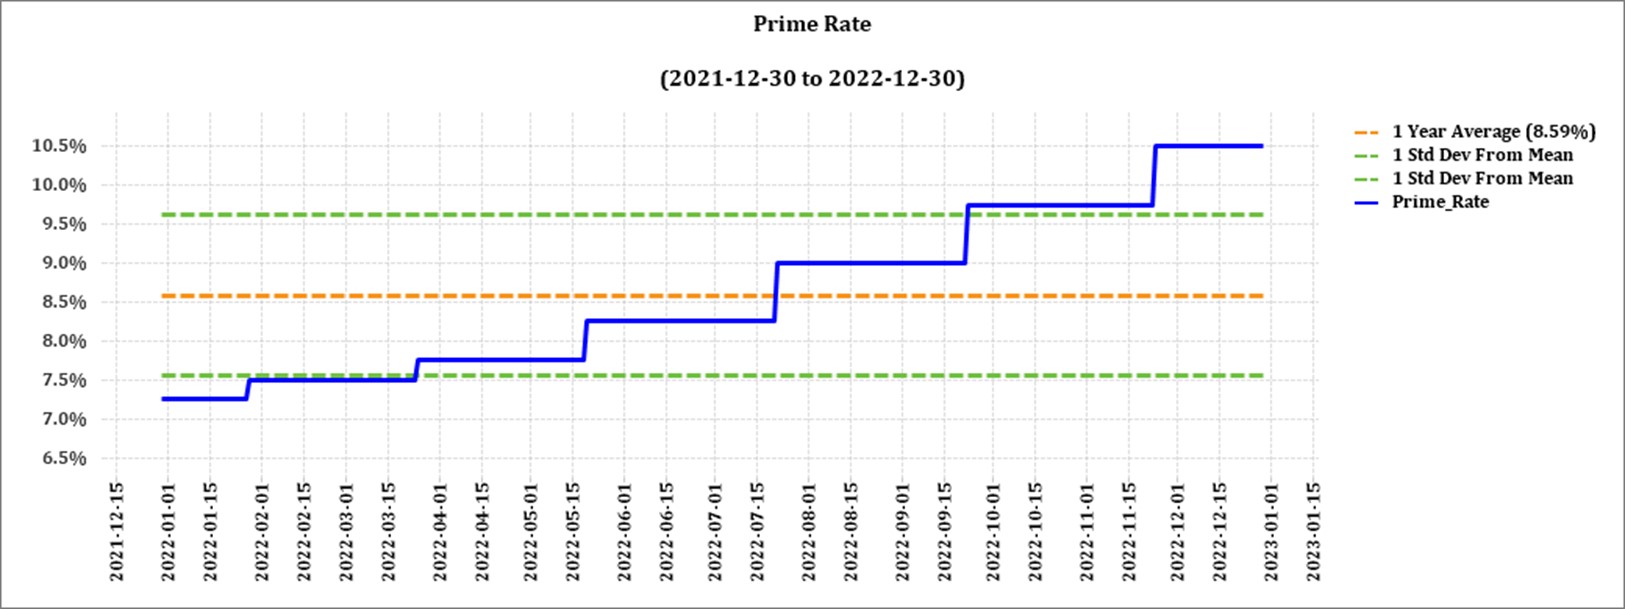
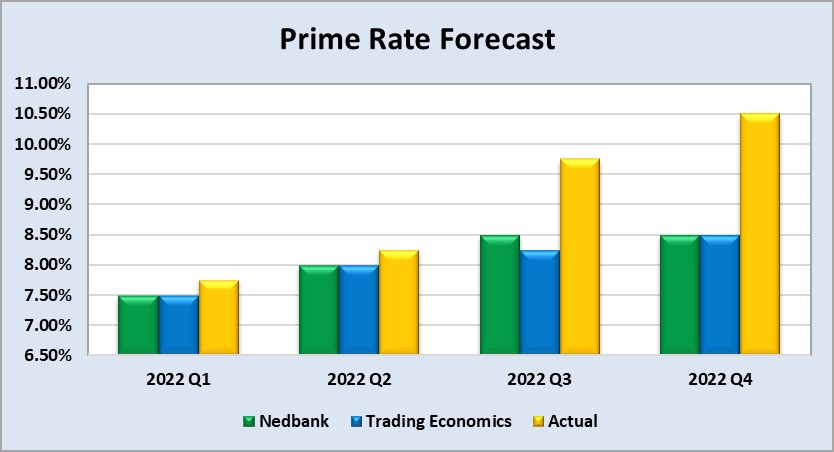
The following graph shows the prime rate forecast for 2022 Quarter 1 to 2022 Quarter 4. Both Q1, Q2 and Q3 experienced higher interest rates than anticipated by Nedbank and Trading Economics.
• Highlights in the agrochemical sector
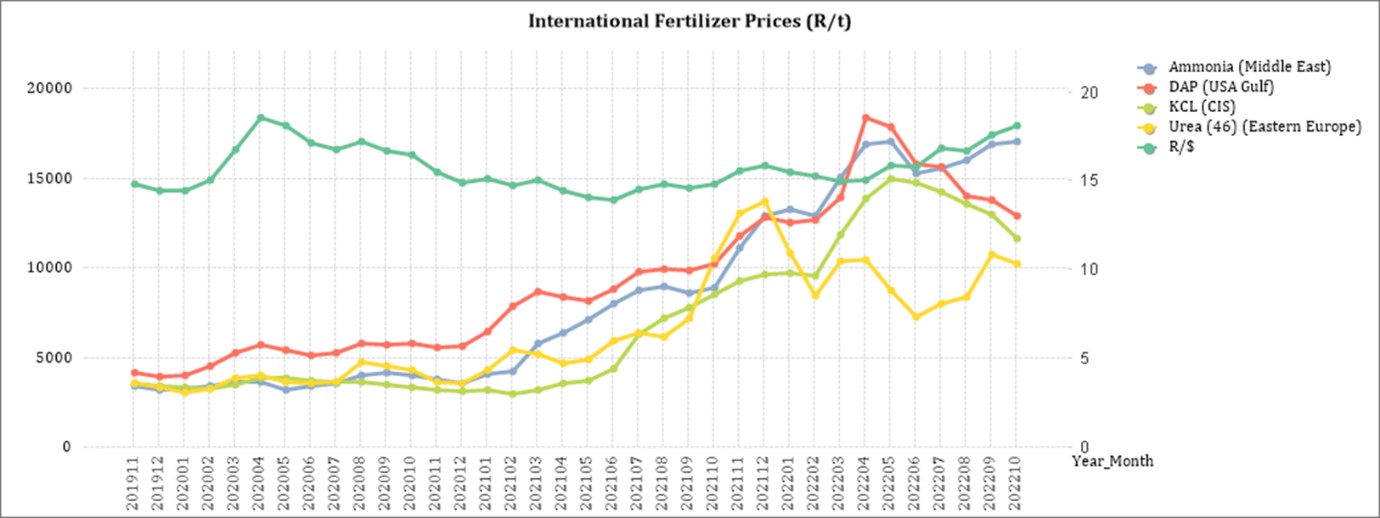
According to World Bank Blogs, fertiliser prices have eased from their early 2022 peaks but they remain at historically elevated levels. The price easing partly reflects weak demand as farmers cut back fertiliser field applications due to affordability and availability issues. The industry is also affected by supply-side issues, including a production crunch in Europe, disruptions due to sanctions on Russia and Belarus, and trade restrictions in China.
Herbicides
The following products are the main products regarding herbicides that may have an impact on input costs for producers:
- Glyphosate (95%)
- Acetochlor (92%)
- Atrazine (97%)
- Metolachlor (97%)
- Trifluralin (95%)
The following comparison is from the November 2022 Grain SA report which reports the previous month’s prices.
International herbicides prices, year to year change (R/t).
 In comparison with the previous year’s prices, there was a significant increase in prices in three of the five main products. The products that had a price decrease were trifluralin with a decrease of -7,95% and glyphosate with -7,74%.
International herbicides prices – month to month change (R/t).
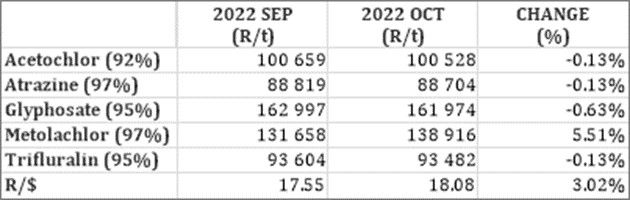
For the two months compared four products experienced a slight price decrease.
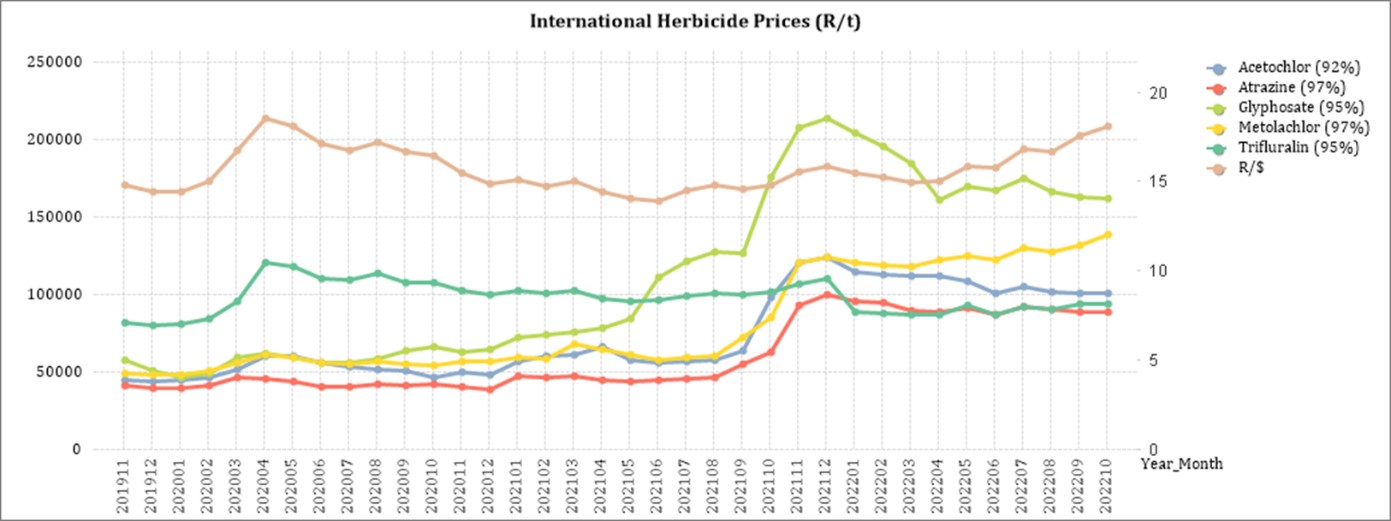
The graph below shows the international herbicides prices (R/t) per product from November 2019 to October 2022.
Insecticides
The following products are the main products regarding insecticides that may have an impact on input costs for producers,
Imidacloprid (95%)
Lambda-cyhalothrin (95%)
Carbofuran (99%)
Deltamethrin (98%)
Acetamiprid (95%)
Chlorpyrifos (95%)
Cypermethrin (94%)
International insecticide prices – year to year change (R/t).
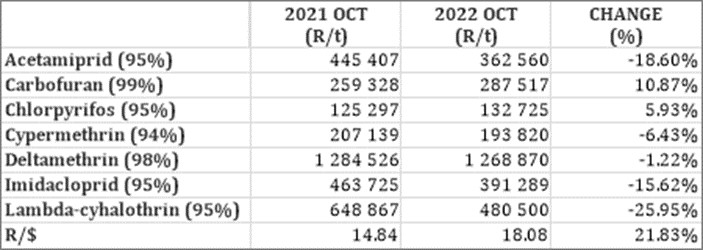
In comparison with the previous year’s prices. all of the products experienced a price decrease. The largest increase was Lambda-cyhalothrin, with a decrease of 25,95%. Carbofuran experienced the highest increase of 10,87%.
International insecticide prices – month to year month (R/t).
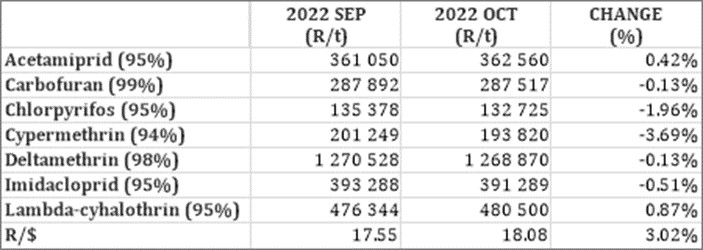
Most of the products experienced slight price increases in October.
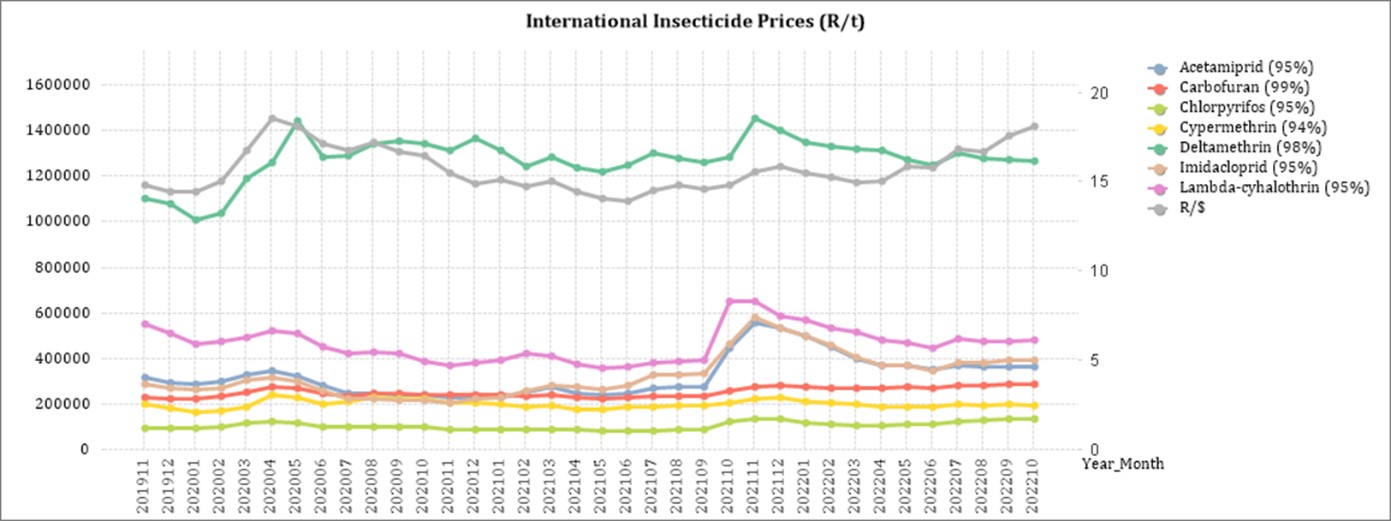
The graph below shows the international insecticide prices (R/t) per product from November 2019 to October 2022.
Fertiliser
The following fertiliser products are being analysed:
- Ammonia (Middle East)
- Urea (46%) (Eastern Europe)
- DAP (USA Gulf)
- KCL (CIS)
International fertiliser prices – year to year change (R/t).
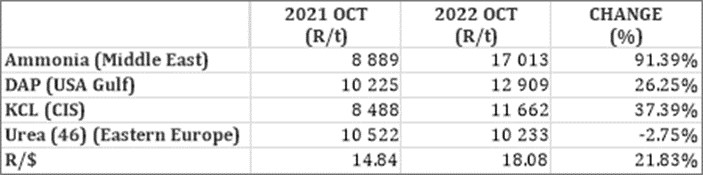 As seen in the table above all of the main fertiliser products increased on a year-on-year basis. The biggest increase, based on average international prices (R/t), was ammonia (91,39%).
International fertiliser prices – month to month change (R/t).
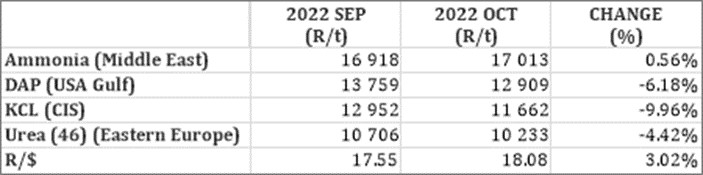 For the two months compared, three products experienced a decrease in price per ton.
The graph below shows the International Fertiliser prices (R/t) per product from November 2019 to October 2022.
Sources: Grain SA – https://www,ft,com/content/4d746aa5-29e3-4796-b9e6-0b64c6865389
Urea market: Urea prices seem to be decreasing for the coming weeks (India is thus also considering another tender). The recent tender locked in almost 3 times the intended 500 000 to 600 000 tons but the lack of demand from all other regions continued to put pressure on urea prices.
Ammonium nitrate market (AN): The ammonia price remains in limbo, however recent increases in the European gas price is getting European players engaging with the market again as the ammonia market price is getting very close to the European production cost and imports may be viable if the gas price keeps rising. In other markets, ammonia supply is in excess, and demand remains weak.
Phosphates: All major phosphates markets saw a hefty price drop the past few weeks. Phosphates supply continues to be low in comparison with prior years with the Chinese moratorium on exports and the ongoing issues with Russian exports. Demand for phosphates is reduced and the supply-demand balance is tiled towards excess supply. Prices thus continue to remain under pressure with producers anxious to secure whatever sales they can. Industry commentators are calling for the market to come into balance in January and therefore expect prices to stabilize then – for this to happen, the current supply restrictions from China, Russia and even Saudi would need to continue – otherwise prices will carry on drifting downwards.
Potash: Potash prices continue to decrease, the downward trend in global potash prices was evident again the past few weeks, as Brazil and South East Asia enjoyed price reductions. Potash prices have not come down meaningfully yet in Europe and remain above $800/t. The European import season is now, so aggressive negotiating from buyers should see some rapid adjustments in the potash price. With demand continuing to be soft-to-medium in South Africa and ample potash stocks, further substantial imports of potash are unlikely in the next 6 weeks. The local potash price is therefore likely to remain elevated as sellers want to minimize their losses on their expensive stock positions.
Source: https://www.grainsa.co.za/upload/report_files/Chemical-and-Fertilizer-Report_Oct-2022.pdf
• Economic impact of load shedding on the agricultural sector
The reality is that load shedding will continue for years to come and the negative impact on the economy is severe.
The table below indicates the GDP lost per hour per sector due to load shedding:
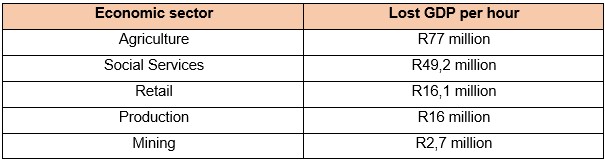
From this table it is clear that the agricultural sector loses the most GDP per hour. With even higher levels of load shedding expected in 2023 these GDP figures will soon be much higher.
Modern farming businesses have become extremely dependent on electricity to run their irrigation, cooling, pumping stations, and mechanization, producers may need to find alternative power sources, These sources, while reliable, come at a cost. With increasing fuel costs as a result of the Russian-Ukrainian war and the big fuel consumption nature of generators, investing in a generator as a power source may not be a sustainable solution – especially for small-scale producers who are sensitive to increasing variable costs. When producers fail to find alternative sources, they take the risk of forfeiting water quotas for irrigating purposes which can cause the business to go under.
Machinery and equipment are damaged and repairment comes to a standstill as a result of power outages, producers may be forced to work after hours when there is electricity, leading to increased expenditure on overtime wages and increasing production costs. Some producers may not be able to afford this, given that production costs such as fertilizer and fuel have already increased a lot over the last few months.
Electricity tariff hike
Nersa granted Eskom a 18,65% hike in electricity prices for the 2023/2024 tariff year. It will be effective from 1 April 2023. With load shedding already increasing input costs in many sectors due to generators and other energy sources being expensive to run, the latest electricity increase is going to cripple producers even further and threaten food security.
Sources
https://www.news24.com/news24/community-newspaper/paarlpost/electricty-tariff-hike-will-hinder-agriculture-20230113
https://www.businesslive.co.za/bd/national/2023-01-12-power-cuts-are-sowing-the-seeds-of-food-crisis-say-farmers/
• Expropriation bill
On Wednesday evening, 28 September 2022, the National Assembly adopted the controversial Expropriation Bill which currently allows the expropriation of land only for public purposes and in the interest of the public, as stipulated in Section 25 of the Constitution.
While Section 25(3) requires the amount of compensation for land to be “just and equitable” the bill makes it possible for expropriation of land with “nil compensation” under specific circumstances. These circumstances include abandoned land, state land, or land held for speculative purposes. However, the DA, EFF, IFP, FF Plus and ACDP objected to the bill each for different reasons.
Patricia de Lille, public works and infrastructure minister, has tried to assure South Africans that the government has no intention of using the bill to “arbitrarily” seize land from private owners. She said that talk of land grabs and seizures of private property amounted to fear-mongering.
The bill will now go to the National Council of Provinces for commencement, after which it will head to the desk of the president to be signed into law.
According to Christo van der Rheede, Agri SA’s executive director, load shedding also poses a risk for food security and social stability.
In response to this energy crisis, Solidarity has appealed to everyone who is able to generate electricity on small scale to apply for power generating permits in an attempt to solve the electricity crisis. Regulations have been amended and up to 100 MW can be generated with a permit. However, a license is required when generating more than 100 MW.
The adoption of the expropriation bill remains a controversial subject, but government is trying to reassure citizens that land grabs will not happen. If the president signs the bill into law only future will tell what the effects of the implementation of the bill will be.
Sources
https://businesstech.co.za/news/energy/602470/experts-give-bleak-outlook-for-load-shedding-in-south-africa-report/
https://maroelamedia.co.za/nuus/sa-nuus/tshwane-bekommerd-oor-beurtkrag-wipwaentjierit/
https://maroelamedia.co.za/nuus/sa-nuus/private-verskaffers-kan-kragrevolusie-veroorsaak/
https://www.chaifm.com/podcast/2022-07-06-christo-van-der-rheede
• Medium term budget speech
The minister of finance, Enoch Godongwana, delivered the medium-term budget speech on 26 October 2022, South Africa’s GDP growth declined to 1,9% compared to the 2,1% estimated in February’s budget speech.
National treasury says it’s making progress in its bid to stabilise South Africa’s debt burden, announcing that a fiscal deficit of 4,9% of the GDP is projected for 2022/2023.
It’s also projecting that consolidated government spending will exceed R2,2 trillion this year and likely to rise to R2,5 billion in the next financial year, this as it proposes the non-implementation of budget reductions.
Revenue collections have also exceeded projections, with the tax revenue having to now be revised from R83,5 billion to R1,68 trillion.
Fuel levy collections are expected below 2022 budget estimates due to the tax relief provided between April and July 2022.
Social grants
In February the social relief distress grant was extended for a year with government now taking a decision to retain the temporary grant, at least until 2024. Gondogwana says given the large cost of extending the grant, increases to other social grants in the 2023/2024 year will be slightly below inflation and other social welfare priorities might remain unaddressed.
Gondogwana says discussions are still underway to consider a replacement for the grant, including ways to finance it going forward but that it needs to be financed with permanent increases in revenue, spending, reprioritisation and or a combination of the two.
In its predictions, if the grant value and take-up remain and if it is extended indefinitely, its cost could grow at an average of 8,8% per year, reaching R64,9 billion by 2030/2031. Treasury warns that this without a permanent source of funding would threaten the sustainability of public finances.
Greylisting
Gondogwana says government is doing everything necessary to prevent South Africa from being grey-listed by the Financial Action Task Team. this is the international standard-setting body which oversees global compliance with anti-money laundering rules.
South Africa failed to meet several of its 40 recommendations and is now in a time crunch to tighten and amend some of its laws to curb money laundering and corruption more effectively before the February 2023 deadline. Two bills are already before parliament and are aimed at being enacted before the end of the year, the two are aimed at addressing weaknesses in the legislative framework.
Source: https://ewn.co.za/2022/10/26/godongwana-s-2022-medium-term-budget-speech-everything-you-need-to-know
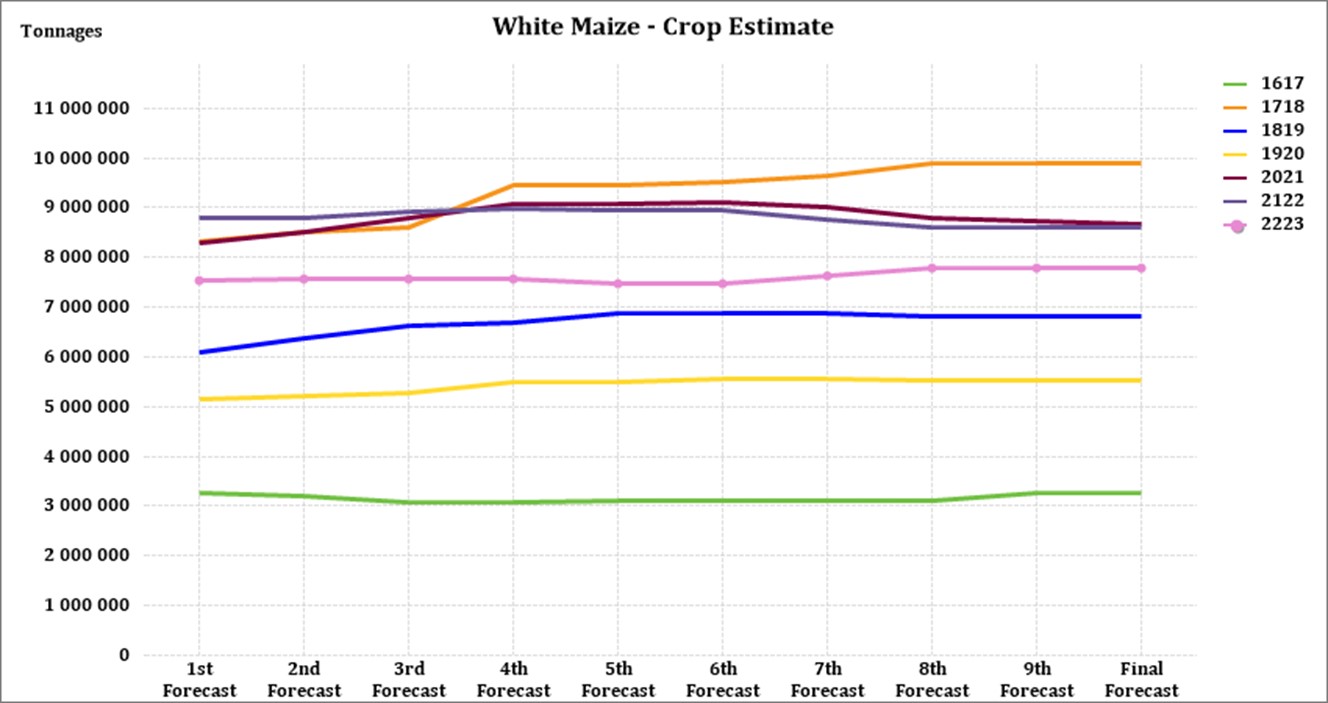
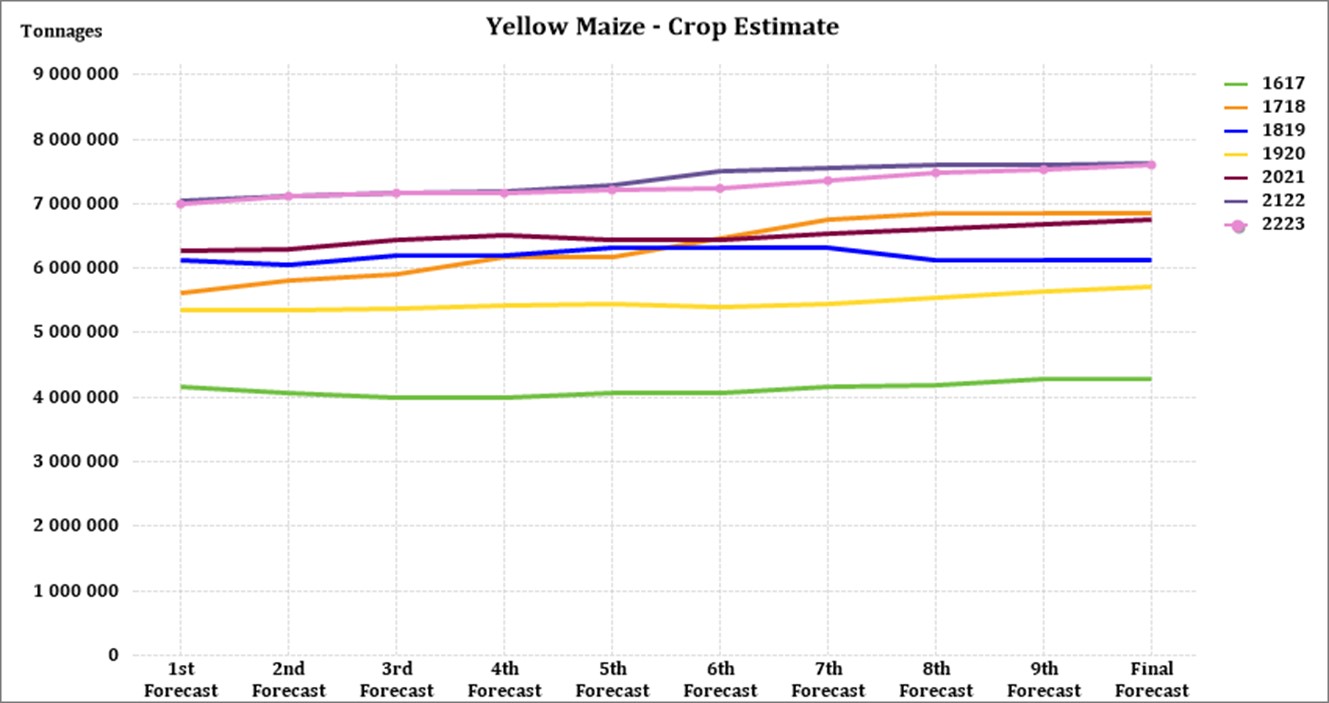
• Future prices
The graphs below illustrate the market sentiment for maize, in the form of future contracts, for the upcoming contract months. The market sentiment is the expectation of supply and demand fundamentals relating to white and yellow maize in South Africa.
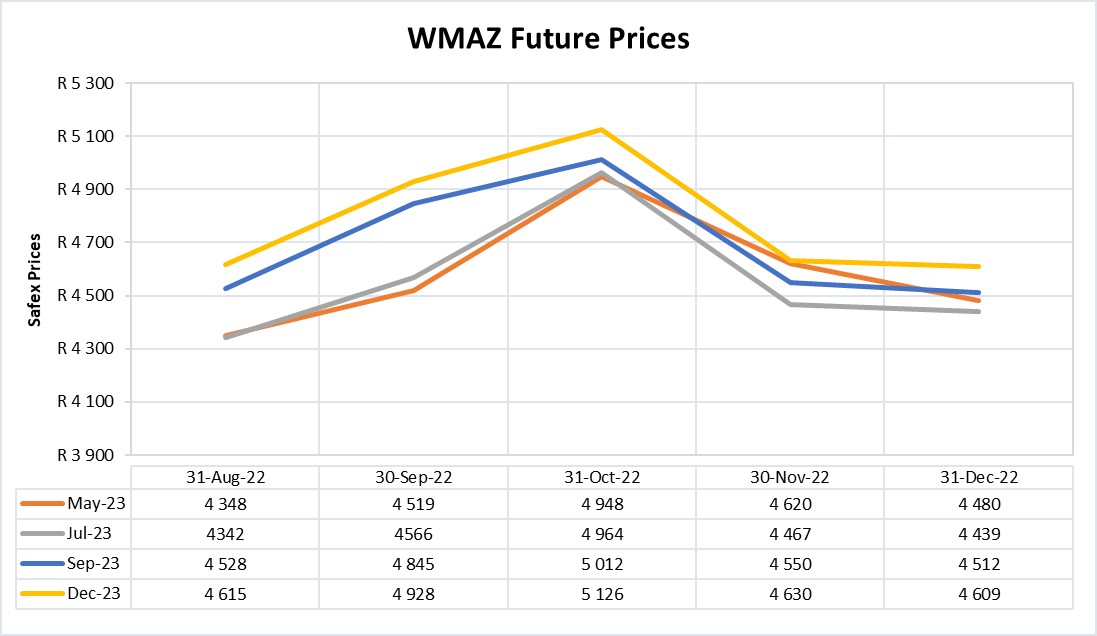
Source: Sagis/JSE
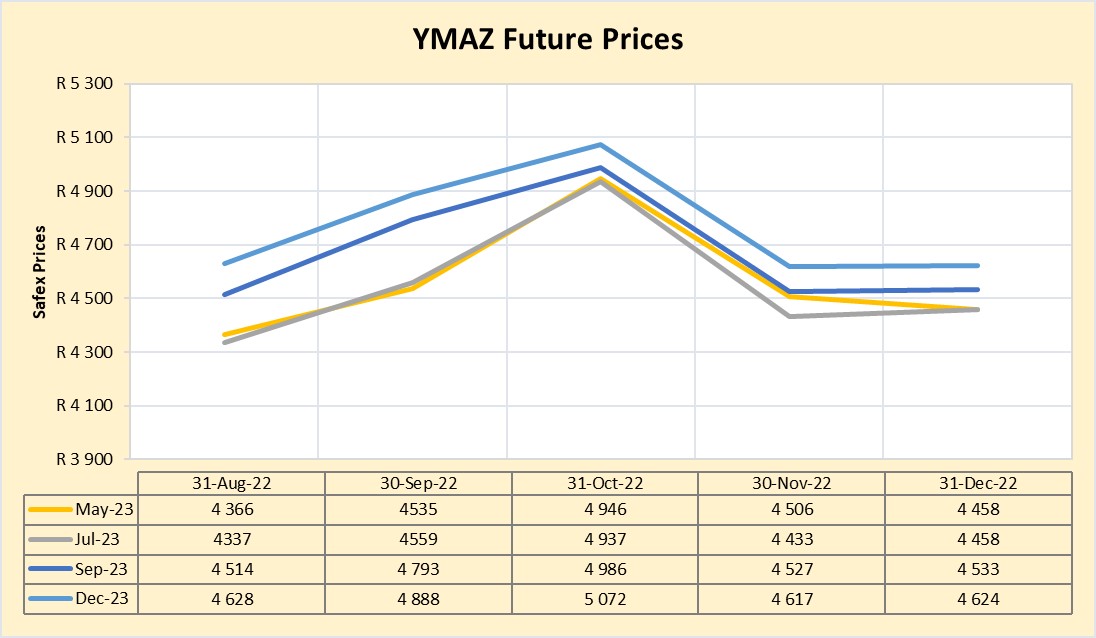
Source: Sagis/JSE
Maize prices increased seasonally in October across most markets and remained above the previous year and five-year averages, driven by declining stock-to-use ratios and strong export demand to East Africa. Inflation surged in the region in October, driven by high global commodity prices, exchange rate volatility, and international supply chain disruptions.
Maize grain prices across the region are expected to increase until the April harvest due to a below-average 2022 harvest, tightening stocks, high export demand, and volatile global commodity markets. Uncertainty regarding the future of the Black Sea grain agreement will continue to be a key driver of elevated prices.
Source: https://reliefweb.int/report/world/global-price-watch-october-2022-prices-november-30-2022
Fraud risk
FRAUD AWARENESS
Here are three fraud prevention tips:
Stay safe online: Don’t send sensitive information such as credit card numbers by email because it’s not secure. Look for clues about security on websites. At the point where you are asked to provide your financial or other sensitive information, the letters at the beginning of the address bar at the top of the screen should change from “http” to “https” or “shttp,” Your browser may also show that the information is being encrypted, or scrambled, so no one who might intercept it can read it. But while your information may be safe in transmission, that’s no guarantee that the company will store it securely, See what websites say about how your information is safeguarded in storage.
Be cautious about unsolicited emails: They are often fraudulent. If you are familiar with the company or charity that sent you the email and you don’t want to receive further messages, send a reply asking to be removed from the email list. However, responding to unknown senders may simply verify that yours is a working email address and result in even more unwanted messages from strangers. The best approach may simply be to delete the email.
Resist pressure: Legitimate companies and charities will be happy to give you time to make a decision. It’s probably a scam if they demand that you act immediately or won’t take “No” for an answer. Some scammers may also demand you pay off a loan immediately or damaging consequences may occur, always take time to look into who is requesting the money before you pay up.


