
The NWK Limited external factors report provides an overview of the main external factors that NWK and its clients are exposed to at a specific point in time. This report opts to aid in a timely basis to foresee external market and other factors that may have an impact on any business and clients. The main focus of this document is to have a closer look at external factors that can affect any business and our customers.
Executive summary
The inflation rate rose for the second month in a row in March to 7,1%. The world economy is slowing down and economists expect a global recession this year. On a year-to-year February movement retail trade decreased slightly with 0,5% and the unemployment rate is down to 32,7% in quarter four of 2022. The agricultural sector declines with 3,3% and was one of the biggest contributors to the overall decline in GDP growth of 1,3%. The Policy Uncertainty Index reached a record level high of 71,7 points in Q1.
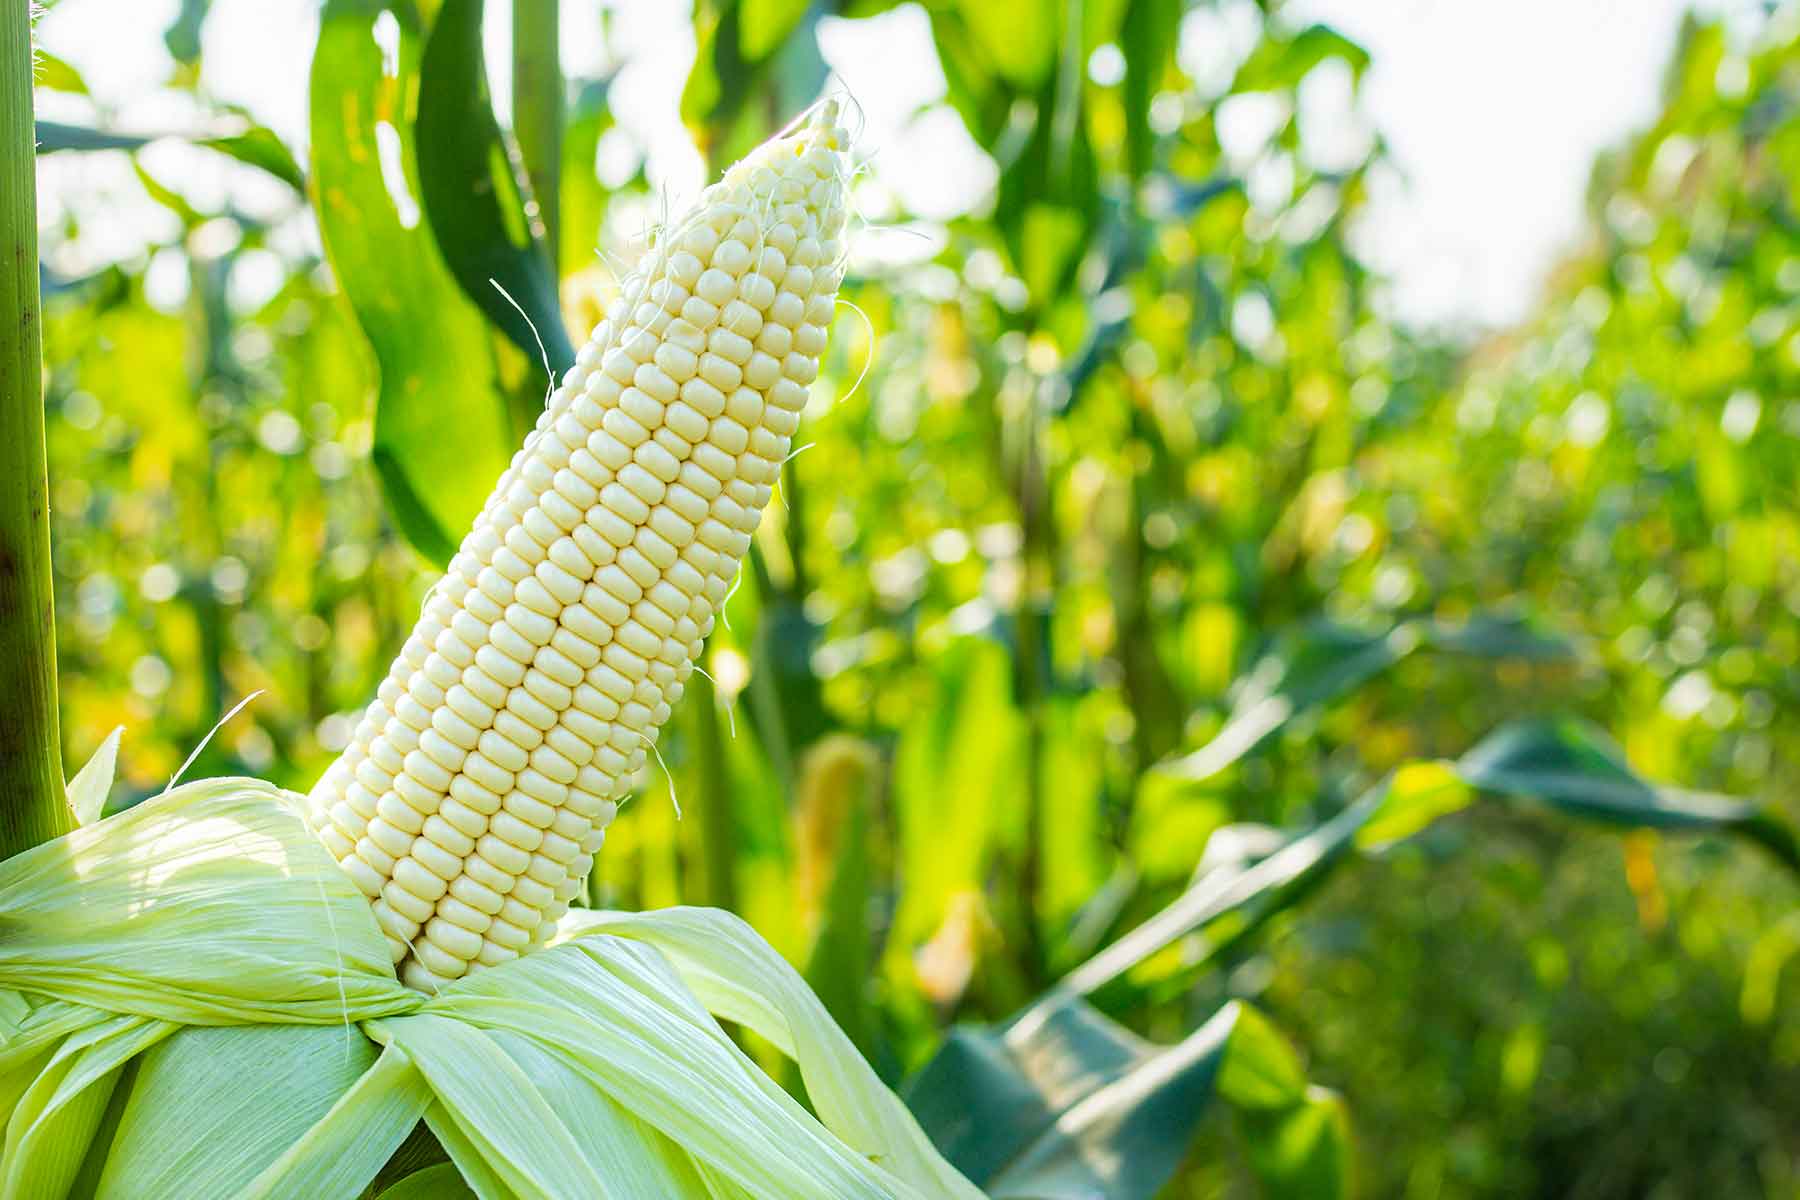
The National Agricultural Marketing Council (NAMC) projected the ending stock for 30 April 2023 of white and yellow maize to be less than the 2021/2022 season. According to the second maize forecast the three main maize producing areas, namely the Free State, Mpumalanga and North West are expected to produce 82,44% of the 2022/2023 crop.
The latest increase of 50 basis points (bps) came into effect on 30 March 2023. The repo rate is currently 7,75% and the prime rate is 11,25%.
The president declared the electricity crisis a state of national disaster during the state of the nation address on 09 February 2023. As a result, new regulations have been published to streamline certain procurement processes. Load shedding poses long term risks for the agricultural sector on a supply and input cost level. Cost-effective and sustainable alternative solutions must be considered in order to reduce the dependency on Eskom for electricity. Even more so now that tariff hikes of 18,65% have been approved.
According to the World Economic Forum (WEF) the number one short term risk is cost of living despite the ease in inflation.
Business climate: Key risk drivers
A few highlights regarding certain risk drivers are mentioned below.
According to Trading Economics South Africa’s annual inflation rate rose to 7,1% in March 2023 from 7% in the prior month, still above the upper limit of the South African Reserve Bank’s target range of 3% to 6%. Food and non-alcoholic beverages (14%) and transport (8.9%) were among the main drivers of overall inflation.
Brent crude futures fell below $85 per barrel on Wednesday 19 April. There are concerns that further US interest rate rises could hinder global economic growth and energy demand.
South Africa’s retail trade decreased with 0,5% from a year earlier in February 2023, following a downwardly revised 0,8% decrease in the previous month and compared with market estimates of a 0,3% decline. The third consecutive month of declines were mostly due to lower sales at general dealers and retailers in hardware, paint and glass.
According to Statistics SA, South Africa’s unemployment rate was at 32,7% in the fourth quarter of 2022, down from 32,9% in the prior period. This was the lowest jobless rate since Q1 of 2021. The labour force went up by 197 000 to 23,688 million. Among the different sectors construction and agriculture each shed 12 000 jobs. The expanded definition of unemployment, including people who have stopped looking for work, was at 42,6%, down from 43,1% in the third quarter.
The GDP growth for the fourth quarter of 2022 shrank by 1,3%. Seven of the ten activities declined in the fourth quarter, with the agricultural sector recording a decline of 3,3%.
The Safex price was considered profitable according to March 2023 white maize spot prices. Agricultural prices are forecast to decline by 5% in 2023 before stabilising in 2024. During mid-April 2023, the prices dropped as predicted. The projected decline in 2023 reflects a better-than-expected global wheat crop and the resumption of grain exports from Ukraine (although the maize crop is expected to contract materially during the 2022/2023 season). However, there are numerous upside risks to the price forecast.
- First, disruptions in exports from Ukraine or Russia, both key grain exporters, could once again interrupt global supplies, as they did in the initial stages of the war in Ukraine.
- Secondly, further increases in energy prices or disruptions in energy supplies (especially natural gas and coal, which are key inputs to fertilisers) could exert upward pressure on grain and edible oil prices.
- In the third place, adverse weather patterns can reduce yields; see surface temperatures are forecast to rise in February, moving toward an El Niño by May. The solar cycle is approaching its turning point said to be in 2025 which also indicative of less rainfall predicted for coming years. On the downside, weaker-than-expected growth, especially in China, could affect the prices of certain agricultural commodities such as maize and soybeans, which are used as animal feed.
The iron ore price saw an increase of $1,77 per metric ton from February to March. Prices for iron ore cargoes with a 63,5% iron ore content for delivery into Tianjin eased to below $118 per tonne, the lowest since 7 January.
The NWU Business School PUI declined significantly to 71,7 points in the first quarter compared to 53,2 points in Q4. Global and domestic factors outweighed the positive resulting in a significant increase of uncertainty. The PUI is the net outcome of positive and negative factors influencing the calibration of policy uncertainty over the relevant period. It is seen to have important implications for business confidence and the investment climate in the country.
Sources
https://openknowledge.worldbank.org/bitstream/handle/10986/38160/CMO-October-2022.pdf
https://tradingeconomics.com/commodity/brent-crude-oil
https://tradingeconomics.com/commodity/iron-ore
https://tradingeconomics.com/south-africa/gdp growth#:~:text=South%20Africa%20GDP%20Grows%201.2,expectations%20of%20a%200.7%25%20growth
https://www.statssa.gov.za/?page_id=737&id=1
https://tradingeconomics.com/south-africa/inflation-cpi
https://tradingeconomics.com/south-africa/unemployment-rate
NWU Business School Policy Uncertainty Index (PUI) 4Q 2022_09012023_pdf
Agbiz/IDC ACI drops in Q4, 2022
The Agricultural Business Chamber (Agbiz) quarterly conducts a survey in order to create an Agribusiness Confidence Index (ACI). The Agbiz/IDC ACI, which was released on 13 March 2023, reflects the perceptions of at least 25 Agribusiness decision-makers on the ten most important aspects influencing a business in the agricultural sector.
These ten aspects are:
- turnover;
- net operating income;
- market share;
- employment;
- capital investment;
- export volumes;
- economic growth;
- general agricultural conditions;
- debtor provision for bad debt; and
- financing cost.
These aspects are used by agribusiness executives, policymakers and economists to understand the perceptions of the agribusiness sector. It also serves as a leading indicator of the value of the agricultural output while providing a basis for agribusinesses to support their business decisions.
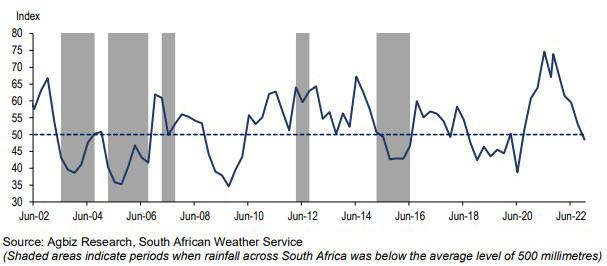
After a 4-point decline in Q4 2022, the Agbiz/IDC (ACI) deteriorated further by 5 points in Q1 2023 to 44. The current reading is the lowest since Q2 2020 when Covid-19 lockdown restrictions were first implemented. Notably, the first quarter reading is below the neutral 50-point level, implying that agribusinesses are downbeat about business conditions.
The persistent and intense episodes of load-shedding, higher input costs, rising protection in some export markets, rising interest rates, intensified geopolitical tensions which disrupted supply chains, and ongoing weaknesses in municipal service delivery, and network industries were again the key factors survey respondents cited as their primary concerns. This survey was conducted in the final two weeks of February, covering businesses operating in all agricultural subsectors across South Africa.
The graph below shows the Agribusiness Index from 2002 to middle 2022.
The ACI is comprised of ten subindices, of which seven declined in the first quarter of 2023. The turnover subindex fell by 9 point to 69, while the net operating income subindex fell by 2 points to 61 points. The rise in net operating income subindex mainly reflects better operating conditions in the grains and oilseeds businesses.
The employment subindex confidence increased by 12 points to 47. This is below the 50 neutral level and signals concern about employment levels.
Confidence in the capital investments subindex decreased with 7 points to 59. This is not a surprise as interest rates keep rising and load-shedding is persistent.
The subindex measuring the volume of exports sentiment rapidly declined by 13 points to 63. This is unsurprising given the solid export activity we observed in 2022, and there are hopes that it will continue this year, notwithstanding worries about crop conditions in some areas.
Confidence in the general economic conditions fell by 14 point to 11. This speaks to the challenging business conditions.
The general agricultural conditions subindex fell by 9 points to 31, which is the lowest level since the last quarter of 2019. This perhaps reflects the effects of excessive rains at the start of South Africa’s 2022/2023 summer crop season which threatened yield prospects.
The warm weather at the end of January helped improve conditions on farms. Then again, the rainfall from mid-February provided a much-needed breather and improved crop conditions.
The market share of the agribusiness’s subindex dropped by 10 points to 58. The decline was mainly driven by respondents in the horticulture and livestock industries.
The subindices of the debtor provision for bad debt and financing costs are interpreted differently from the abovementioned indices. A decline is viewed as a favourable development, while an uptick signals growing financial strain. In the first quarter, the subindex for debtor provision for bad debt was up by 2 points to 36. Financing costs subindex decreased by 1 point to 3 as there are still concerns about relatively higher interest rates.
In conclusion, there are growing concerns about the economic conditions of the agriculture sector. “Addressing the electricity crisis, and sector-focused issues such as biosecurity, opening up more export markets and dealing with inefficiencies in municipality service delivery are some of the key issues that will help improve sentiment and the fortunes of our agriculture and agribusiness sectors,” says Wandile Sihlobo. The likelihood of an El Niño approaching won’t be favourable for an already stressed agricultural sector.
Source: www.agbiz.co.za, Issued by Wandile Sihlobo, chief economist: Agbiz, 13 March 2023
Weather and climate
NATIONAL ASSESSMENT
La Niña has ended in the tropical Pacific Ocean. The El Niño-Southern Oscillation (ENSO) is now neutral. The chance for ENSO-neutral is 99% from March to May 2023. The chance for El Niño is 62% from as early as May. A strong El Niño is predicted for the coming rainfall season.
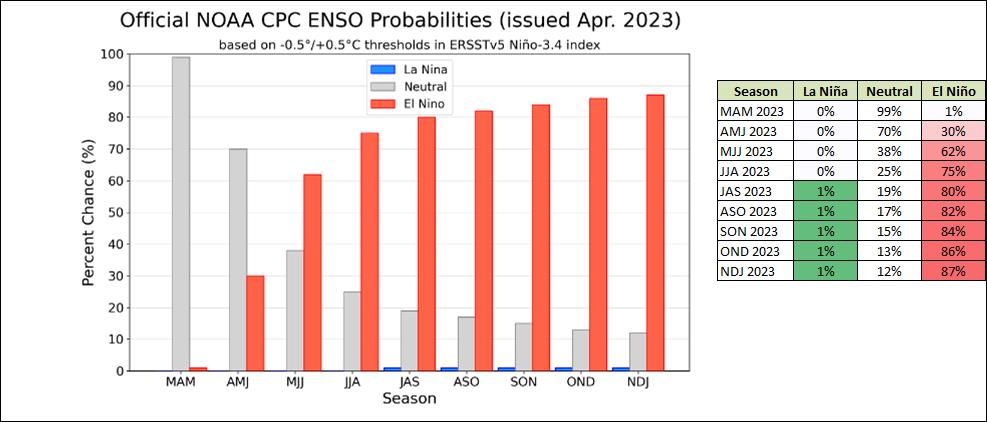
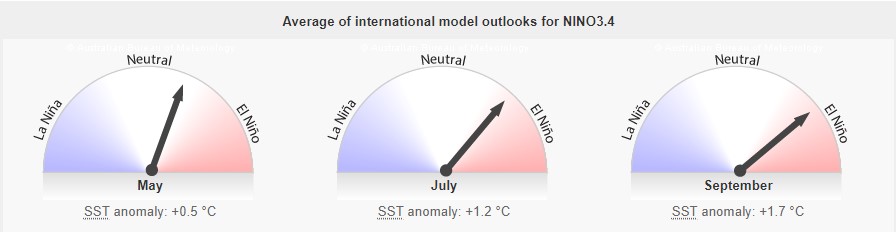
The Bureau’s ENSO Outlook is at an ENSO WATCH which means that there is a 50% chance of an El Niño in 2023. The current SSTs for May to September range from +0,5°C to +1,7°C. From July the indicators show that a El Niño will be present. Persistent values warmer than +0,8°C is typical of an El Niño.
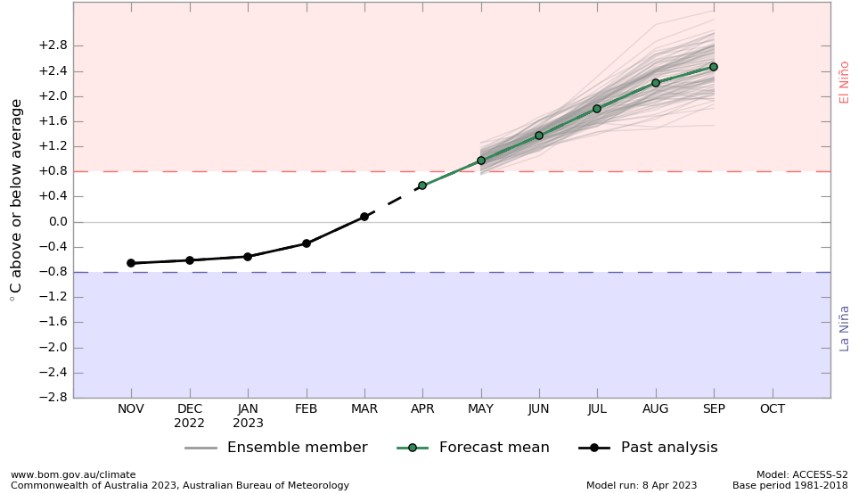
Source: Australian Government – Bureau of Meteorology
According to the above graph ENSO is still in a neutral phase, but ocean temperatures near the equator are slowly starting to get warmer. According to the graph it is likely that an El Niño will form in May. The upward trajectile of the graph shows that there will already be less rain than usual as temperatures rise.
The current view on 05 April 2023 is:
- Crops show an above-average potential, but the seed filling period still lies ahead which is a sensitive period for drought.
- Sunflower crops are in excellent condition and at this stage there are very few incidents of Sclerotinia.
- Soyabean crops are experiencing high drought stress, but the forecasted last rains for the season might change the situation.
- It looks like the rainfall season is passing as the cloud bands move over the intertropical convergence zone north of Zambia.
- Each week ENSO indicators are moving towards an El Niño and a strong El Niño is predicted for next season.
Source: Martiens du Plessis (05/04/2023)
SUNSPOTS
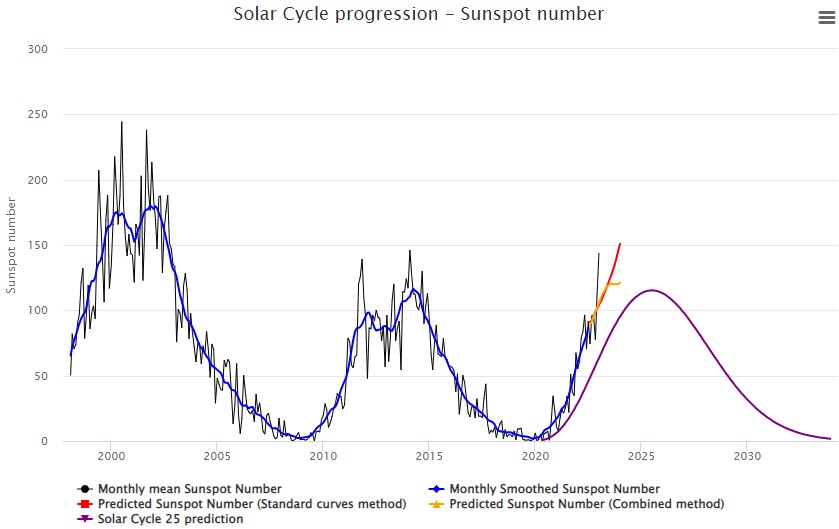
Sunspots are darker, cooler areas on the surface of the sun that arise due to disturbances in the sun’s magnetic field. Every eleven years, the number of spots dotting the surface of the sun increases and decreases and forms the solar cycle.
Sources
https://eos.org/articles/why-did-sunspots-disappear-for-70-years-nearby-star-holds-clues 10 June, 2022
https://www.sciencedirect.com/science/article/abs/pii/S136468262200116X#:~:text=It%20was%20observed%20that%20rainfall,an%20increasing%20effect%20on%20rainfall
https://www.space.com/solar-cycle-frequency-prediction-facts May 27,2022
According to science direct the rainfall rate is directly related to the sunspot number but shows different characteristics during solar maximum years. Though a lag correlation exists between sunspot number and rainfall, sunspots have an increasing effect on rainfall. Studies show that the more sunspots are present the higher the rainfall and the less sunspots the lower the rainfall.
ENSO occurs at irregular interval between three and seven years causing global climate system variation. Considering this event occurs periodically, it might be triggered by the eleven years of solar cycle as an energy source.
The graph below shows the eleven year solar cycles since before the 2000s. As the graph is in an upward trajectile higher rainfall can be expected – La Niña. As the graph reaches its turning point and moves in a downward trajectile less rainfall is expected characteristic of an El Niño.
The last three years were La Niña years and as the graph is approaching its forecasted turning point in 2025 an El Niño can be expected for the coming years. ENSO indicators are still currently in a La Niña phase but weakening.
One could make the assumption that ENSO-neutral conditions start to develop as the number of sunspots are close to reaching their maximum for the solar cycle and then turn towards El Niño as the sunspots get less and the graph is in a downward trajectile.
Market risk
GRAIN MARKET ANALYSIS
• Ending stock – national
Ending stock data is gathered from the NAMC. The estimates are reassessed and reported by the Grain and Oilseeds Supply and Demand Estimates Committee. The following is a projection of the April 2023 projected final ending stock for the 2022/2023 season in tonnages:
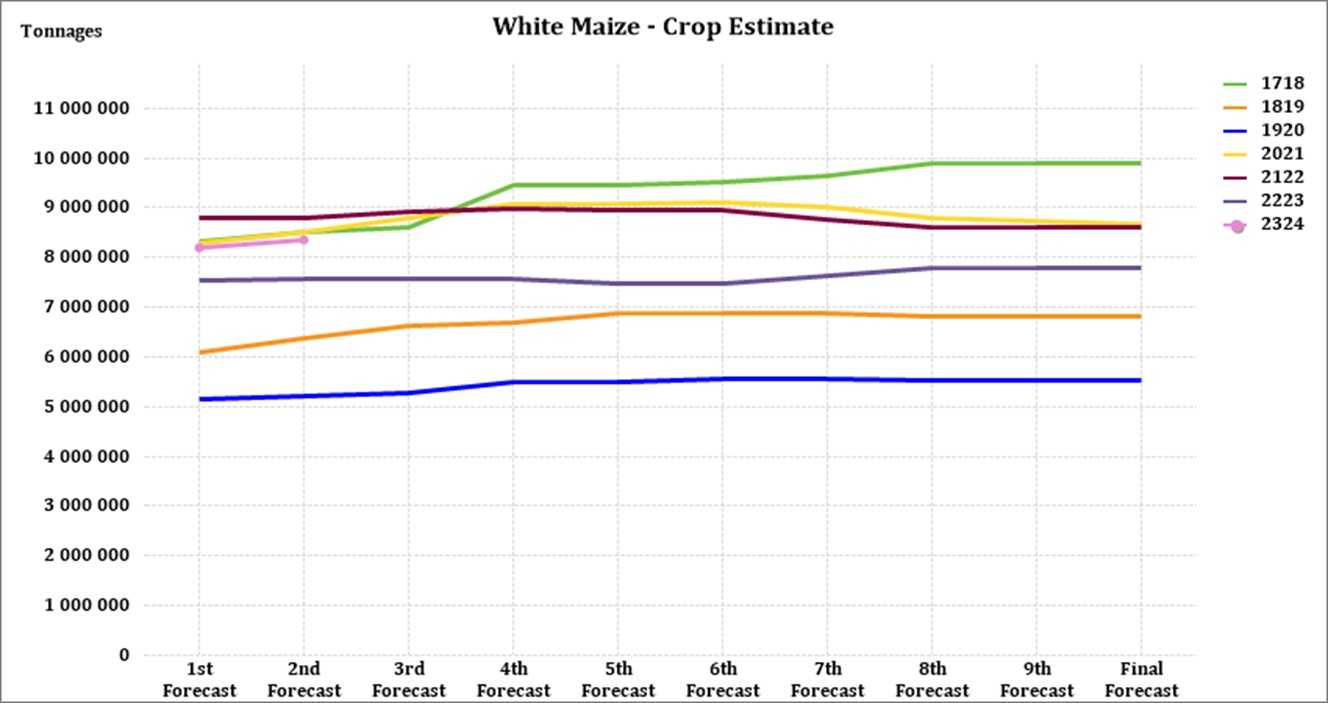
- White maize => 1 332 149 t
- Yellow maize => 705 822 t
The following is a summary of September 2023 ending stock estimates for the 2022/2023 season:
- Wheat => 568 973 t
The following is a summary of the February 2023 estimated ending stock for the 2022/2023 season:
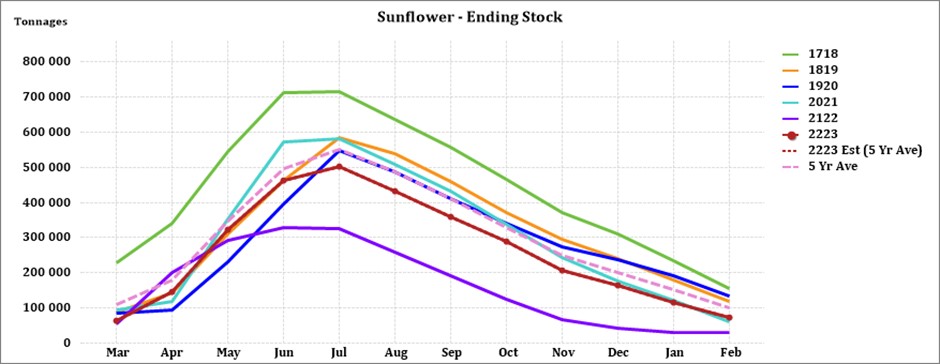
- Sunflower => 73 298 t
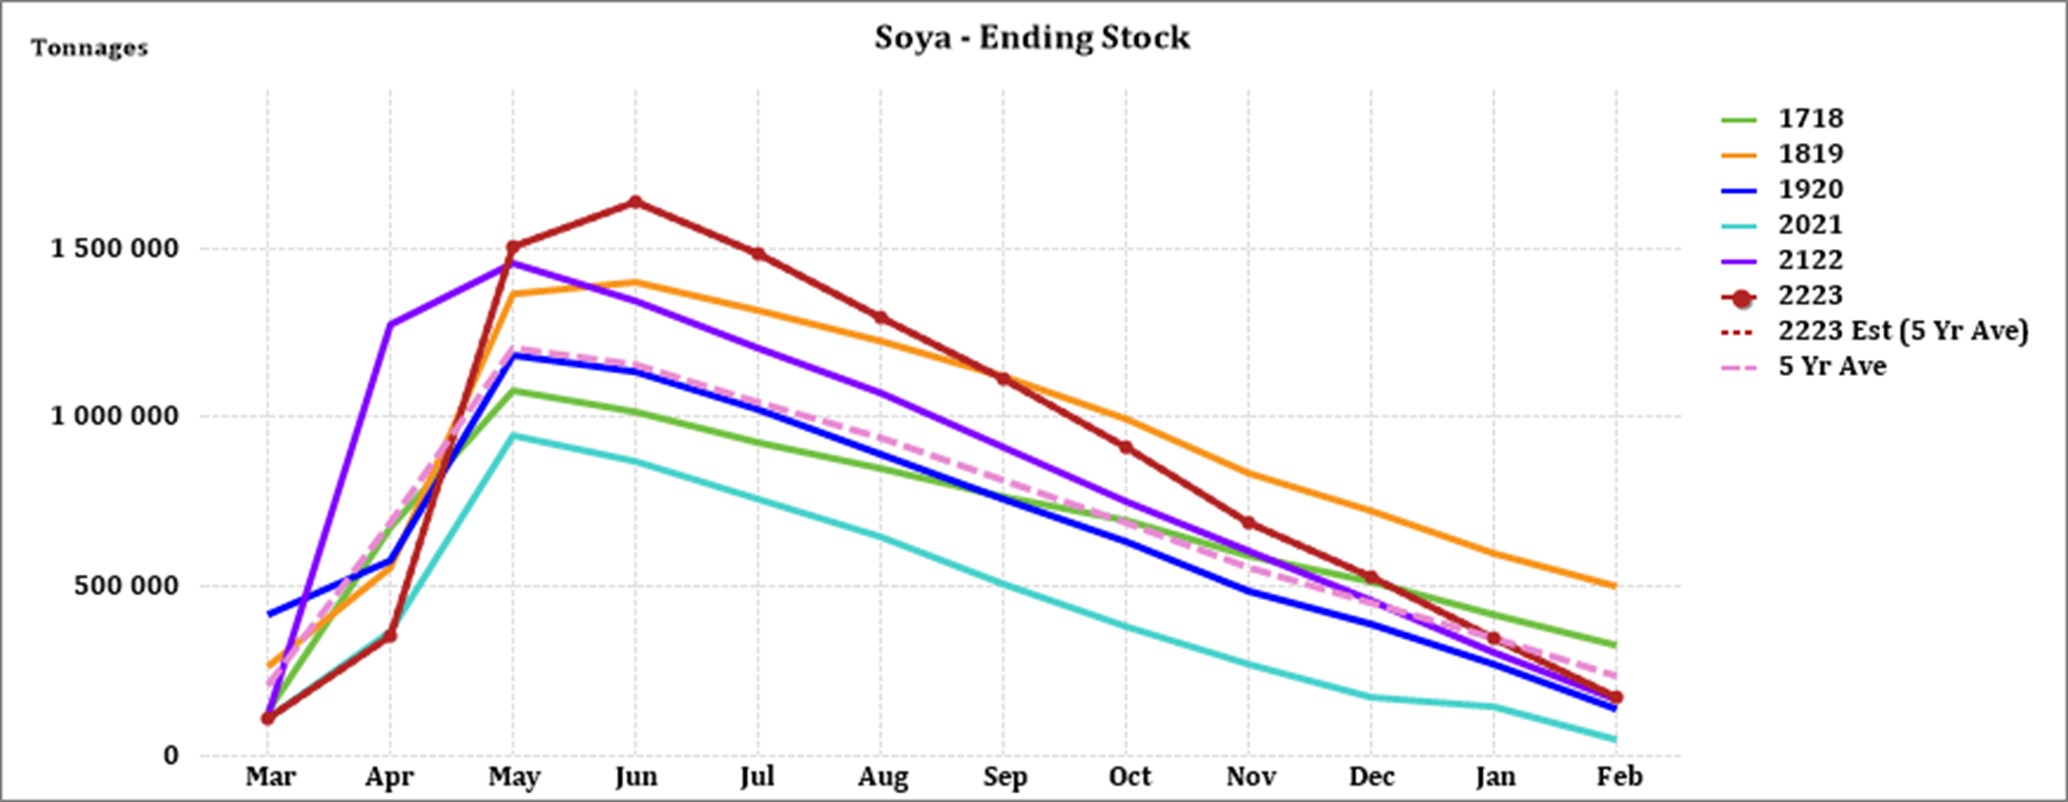
- Soybeans => 171 902 t
- Sorghum => 46 786 t
The graph below shows the estimated ending stock (based on a five-year average) for white maize in April 2023, which is 38 884 tons more than the 2021/2022 season. Yellow maize shows an estimated 155 755 tons increase in ending stock compared to the previous season.
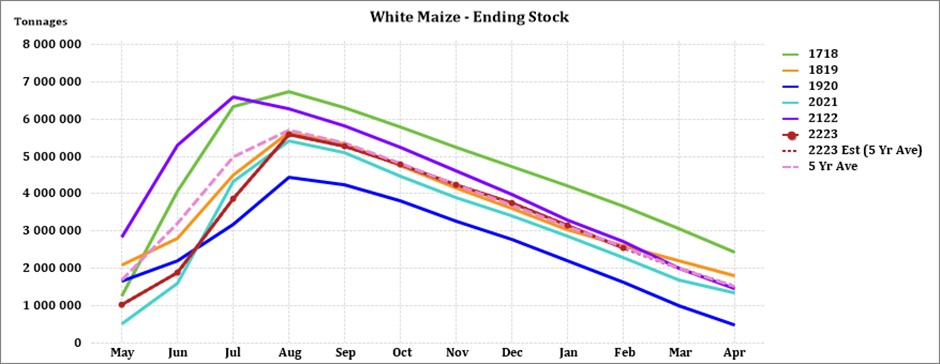
Source: Sagis
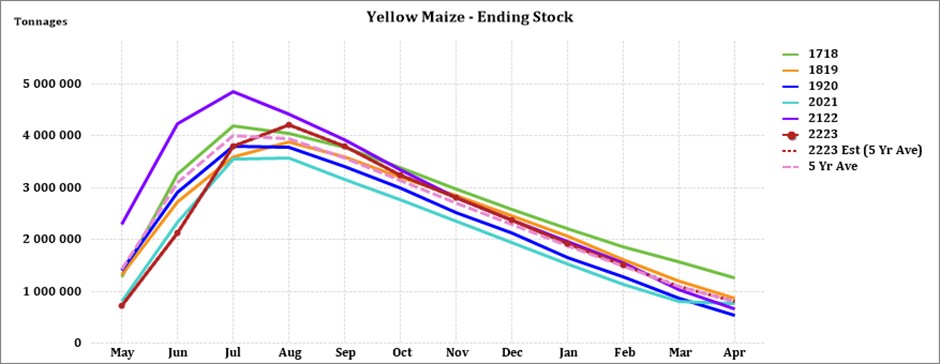
Source: Sagis
The final forecasted soybean ending stock for February 2023 is 3 515 tons more than February 2022.
Source: Sagis
The final forecasted sunflower ending stock is (41 508 tons) more than the previous season ending stock.
Source: Sagis
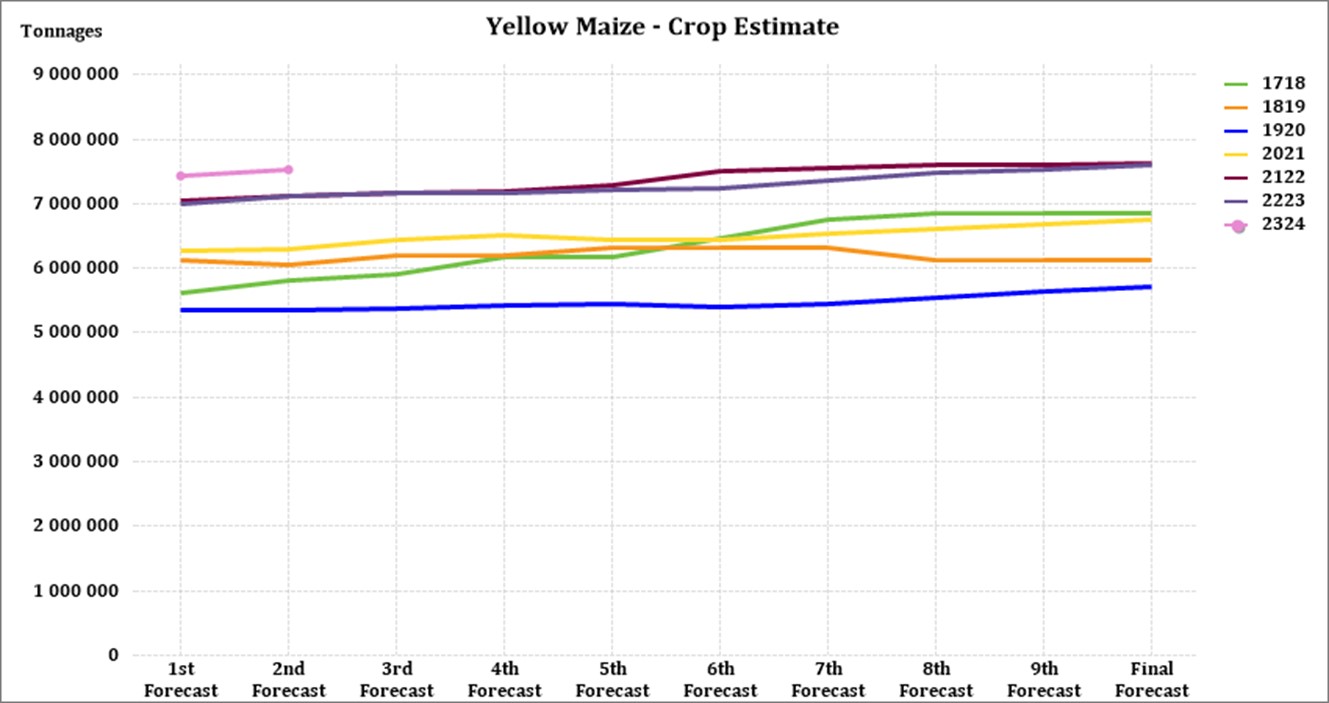
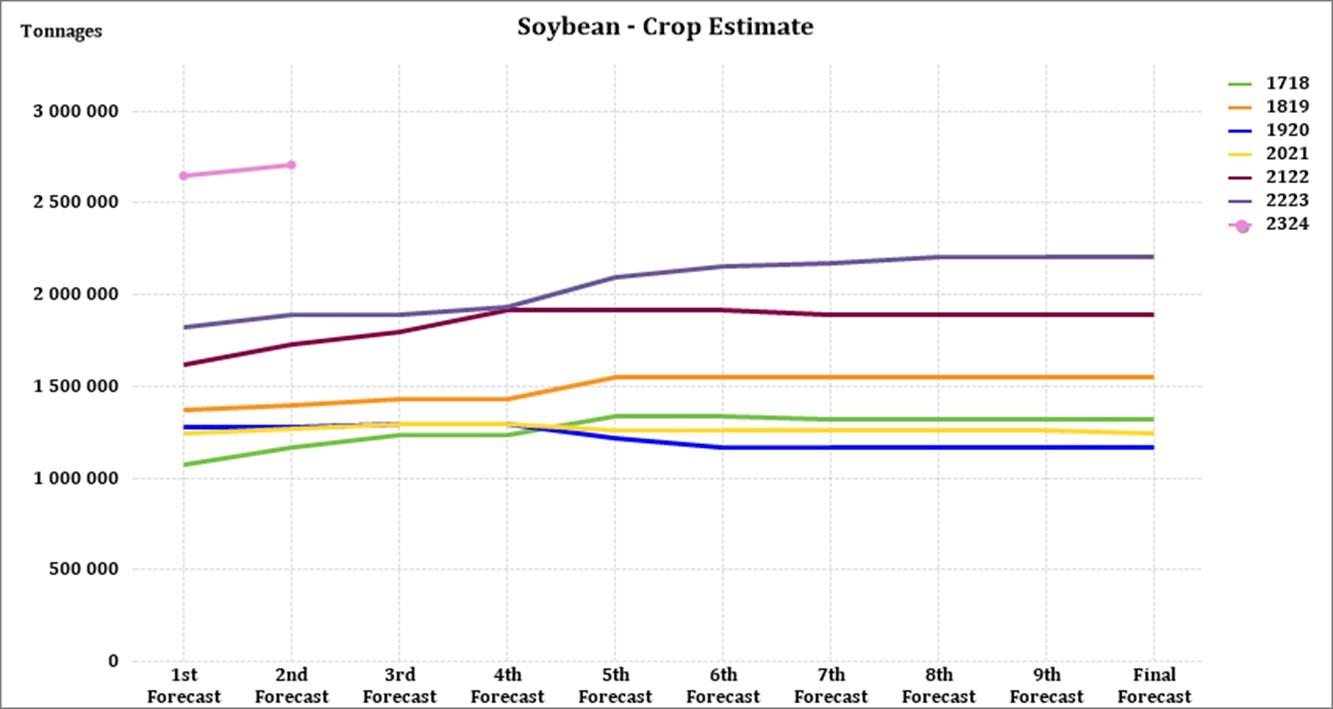
• Crop estimations
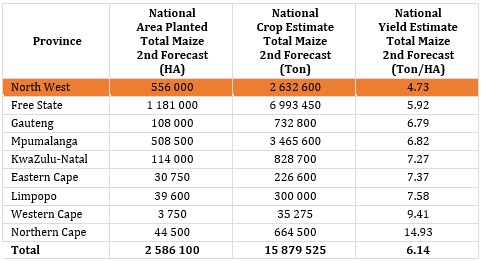
According to the Crop Estimate Committee (CEC) production forecast for 2023, the second area estimate for maize is 2,586 million ha, which is 1,4% less than the actual 2,623 million ha planted for the previous season.
For the second 2023 forecast, the area estimate for white maize is 1,521 million ha, which represents a decrease of 3,4% compared to the actual 1,575 million ha planted last season. In the case of yellow maize, the area estimate is 1,064 million ha, which is 1,6% more than the actual 1,048 million ha planted last season.
Source: CEC (Crop Estimates Committee)
Source: CEC (Crop Estimates Committee)
Source: CEC (Crop Estimates Committee)
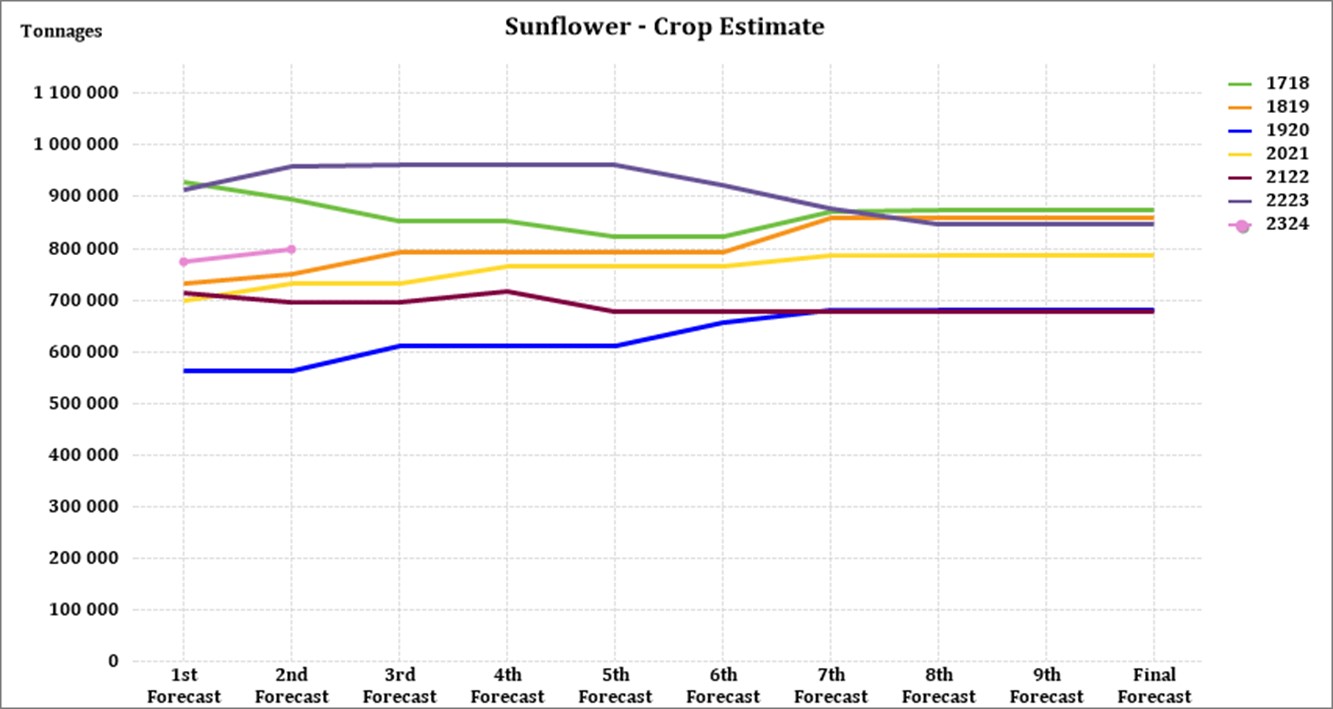
The second area estimate for sunflower seed is 555 700 ha, which is 17% less than the 670 700 ha planted the previous season.
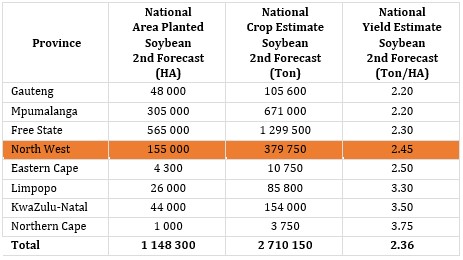
It is estimated that 1 148 300 ha have been planted to soybeans, which represents an increase of 24,10% compared to the actual 925 300 ha planted last season. This is the largest soybean area planted in the history of South Africa.
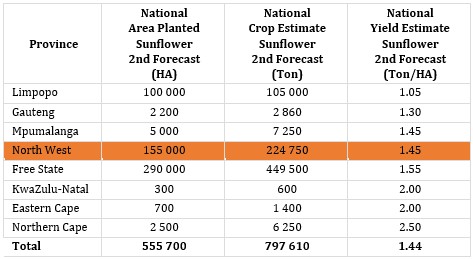
Source: CEC (Crop Estimates Committee)
Source: CEC (Crop Estimates Committee)
Source: CEC (Crop Estimates Committee)
Source: CEC (Crop Estimates Committee)
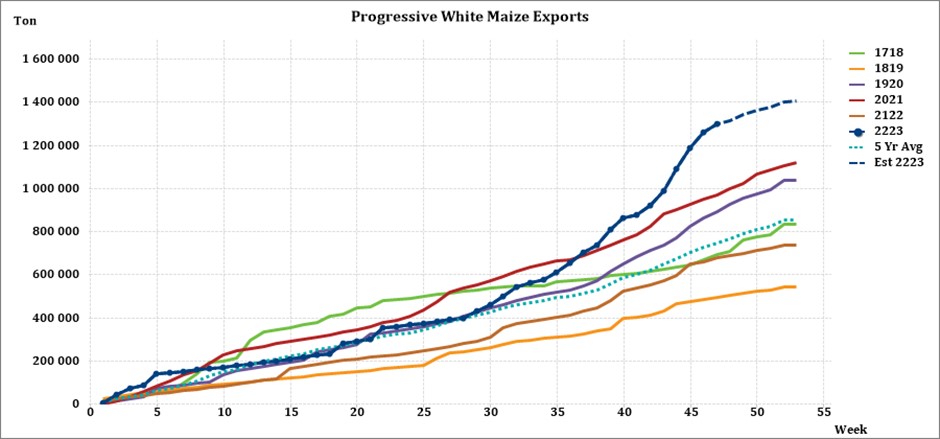
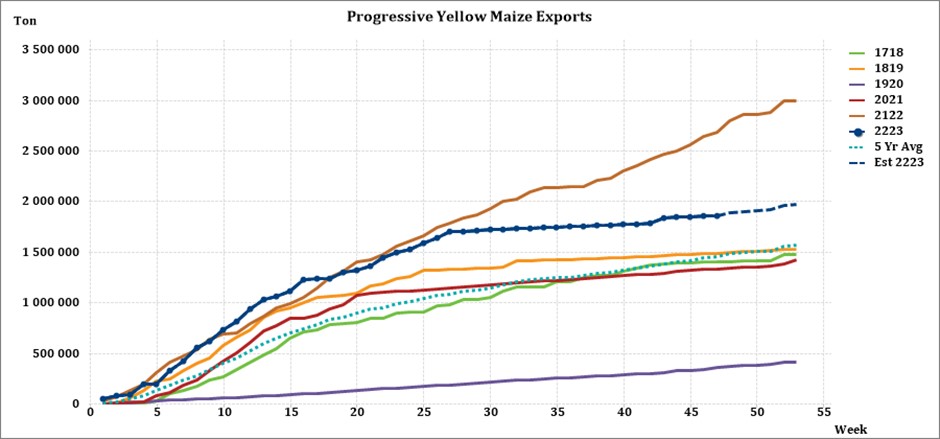
• Imports and exports – national
For the production season ending April 2023, 981 613 tons of white maize and 1 841 082 tons yellow maize have been exported to date (week 47 of 52) as seen in the graphs below. In the previous season, a record number of 2 991 129 tons yellow maize was exported. This was mainly due to South Africa’s competitive export parity prices compared to the rest of the world.
Source: Sagis
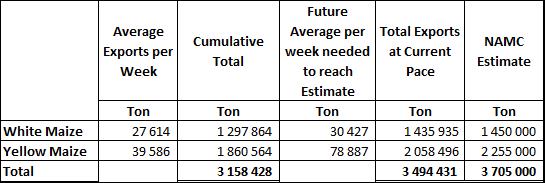
As seen in the table above, the average white maize exports per week are currently 27 614 tons. If theoretically, white maize exports remain at the current average per week then there would be 14 065 tons less white maize exports than anticipated.
The average yellow maize exports per week are currently 39 586 tons. If theoretically, yellow maize exports remain at the current average per week then there would be 196 504 tons less yellow maize exports than anticipated.
Source: Sagis
• Parity prices
South Africa is a small producer compared to other countries and is thus a price taker (meaning that we cannot influence world prices). Because of this, our local prices are normally between import and export parity, which is illustrated in the graph below. An import parity price is defined as the price which a buyer will pay to buy the product on the world market. This price will include all the costs incurred to get the product delivered to the buyer’s destination.
An export parity price is defined as the price that a local seller could receive by selling his product on the world market e.g., excluding the export costs. The price which the seller obtains is based on the condition that he delivers the product at the nearest export point (usually a harbour) at his own expense.
The graph below reflects the Safex price, import parity and export parity of yellow maize as well as the Safex price of white maize. The import and export parity prices for white maize are not released by Grain SA for this period.
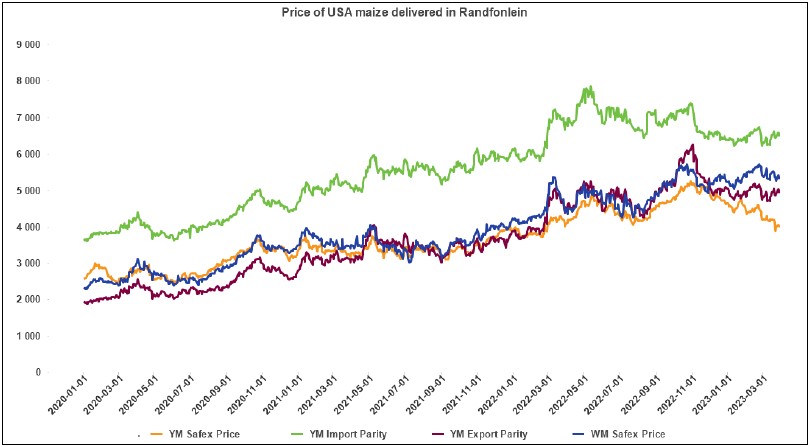
Source: Grain SA
• Producer deliveries – provincial
For the marketing year which is May to April (2022/2023) the Free State dominates the white maize which is used for human consumption and gristing. North West showed a decrease in white maize human consumption for the three month period ending January 2023 compared to the three-month period ending October 2022.
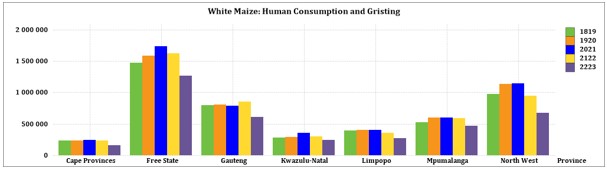
Source: Sagis
For the three month period ending January 2023 North West used the most white maize, for animal feed and industrial usage.
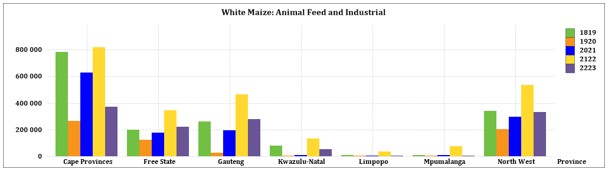
Source: Sagis
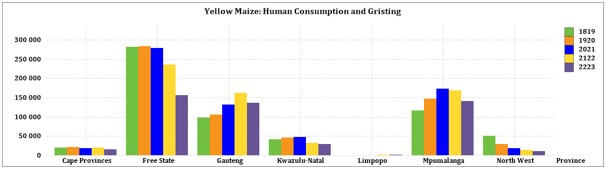
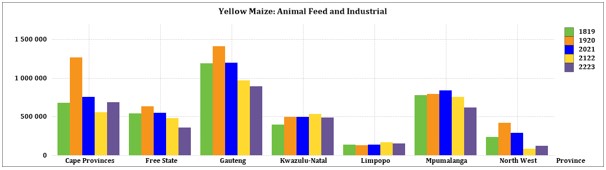
The Free State processed the most yellow maize for consumption and gristing during the three month period ending January 2023. For the same period Gauteng processed the most yellow maize for animal feed and industrial purposes.

Source: Sagis
The Free State processed the most yellow maize for consumption and gristing during the three month period ending January 2023. For the same period Gauteng processed the most yellow maize for animal feed and industrial purposes.
Source: Sagis
Source: Sagis
• Exchange rate
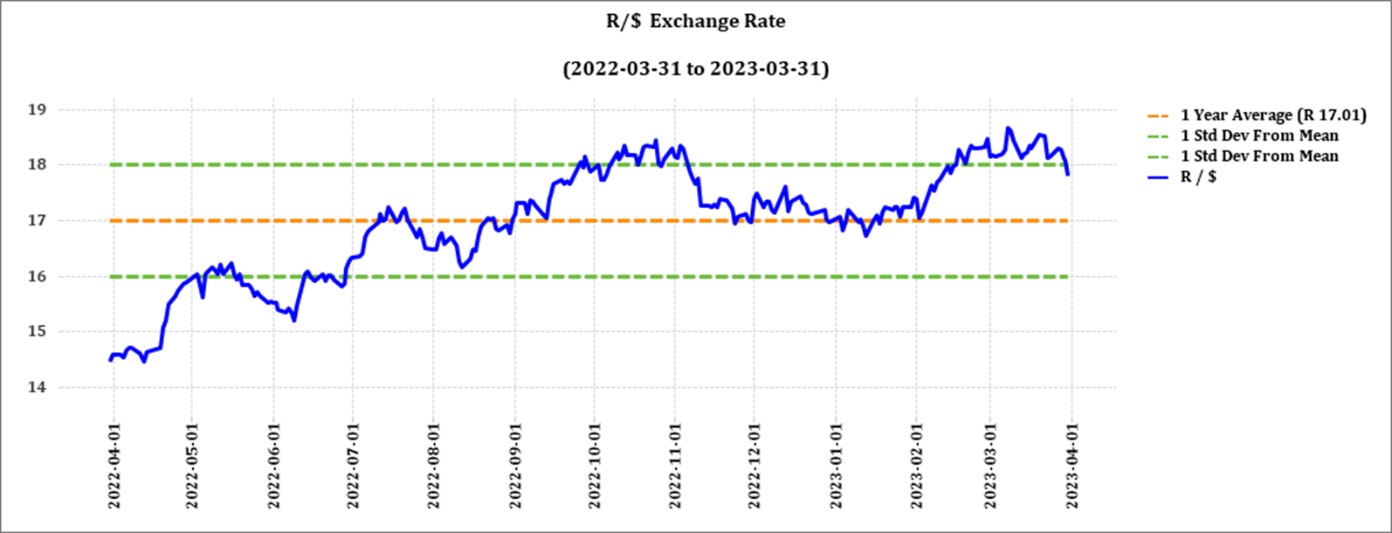
NWK Group is exposed to foreign exchange rate risk on various business areas, such as commodity prices and trade imports.
Source: Standard Bank, Corporate and Investment Banking & SARB
On a monthly average basis, the rand depreciated against the US dollar by 2,1% (R0,38) over the period February to March 2023. The one-year average for rand/US dollar as on March 2023 is R17,76. Moreover, the average rand/US dollar exchange rate for the period March was R18,27 compared to R17,90 in February.
Exchange rate forecast:
The graph below shows the actual USD/ZAR for 2022 Quarter 1 (Q1) to 2023 Quarter 2 (Q2) against the forecasted figures.
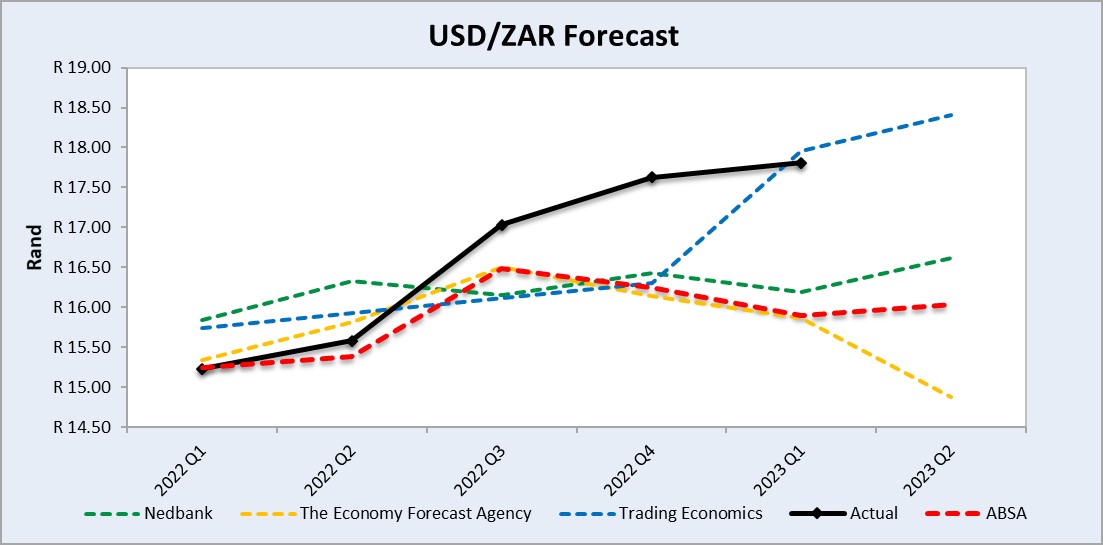
Source: Nedbank CIB; Absa; The Economic Forecast Agency; Trading Economics
• Interest rate risk
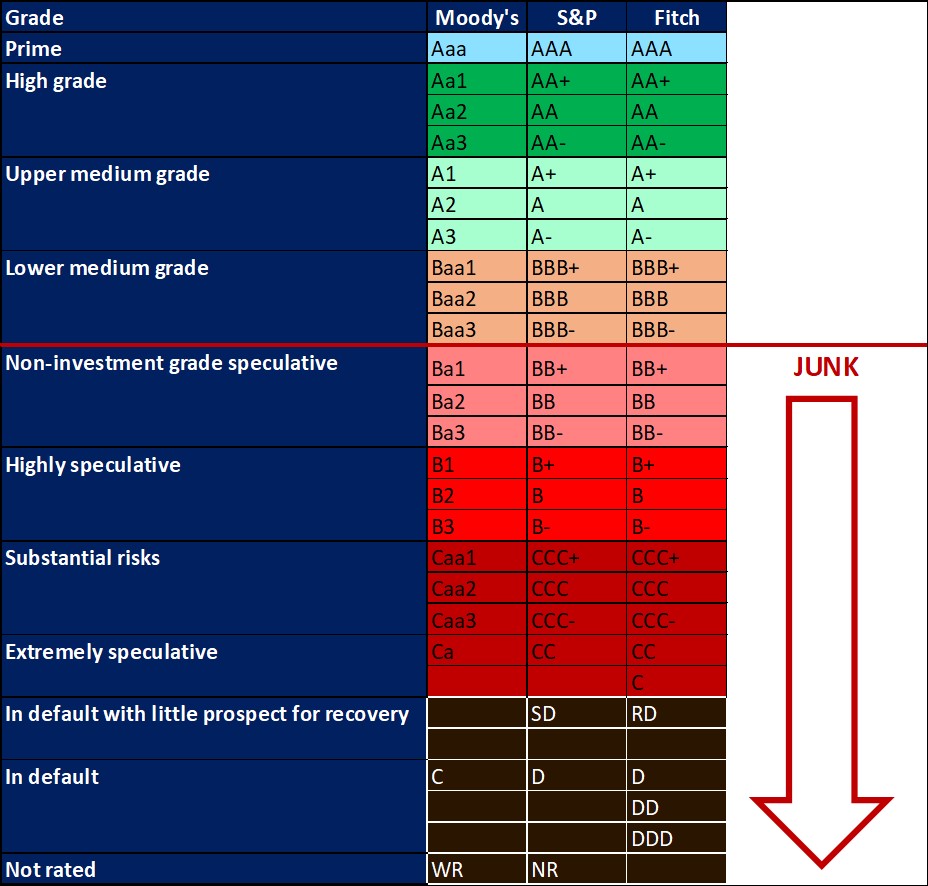
On 27 March 2020, Moody’s downgraded South Africa’s sovereign credit rating to sub-investment grade and placed a negative outlook on the rating. The key drivers for this downgrade include weak economic growth, continuous deterioration in fiscal strength, and slow progress on structural economic reforms. It is now the first time in post-apartheid South Africa where all major rating agencies, i.e.. Moody’s, Fitch and S&P, have South Africa’s credit ratings in sub-investment grade territory. More than a year later and Moody’s rating remains the same.
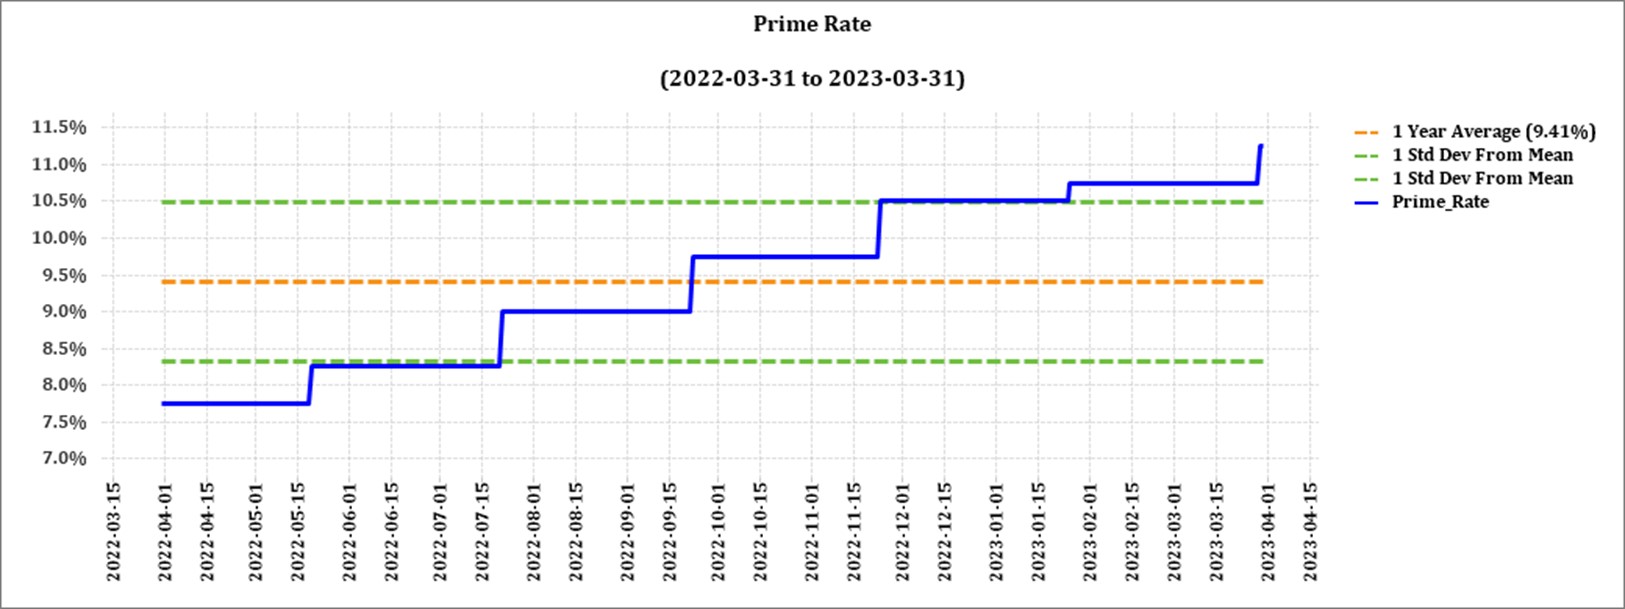
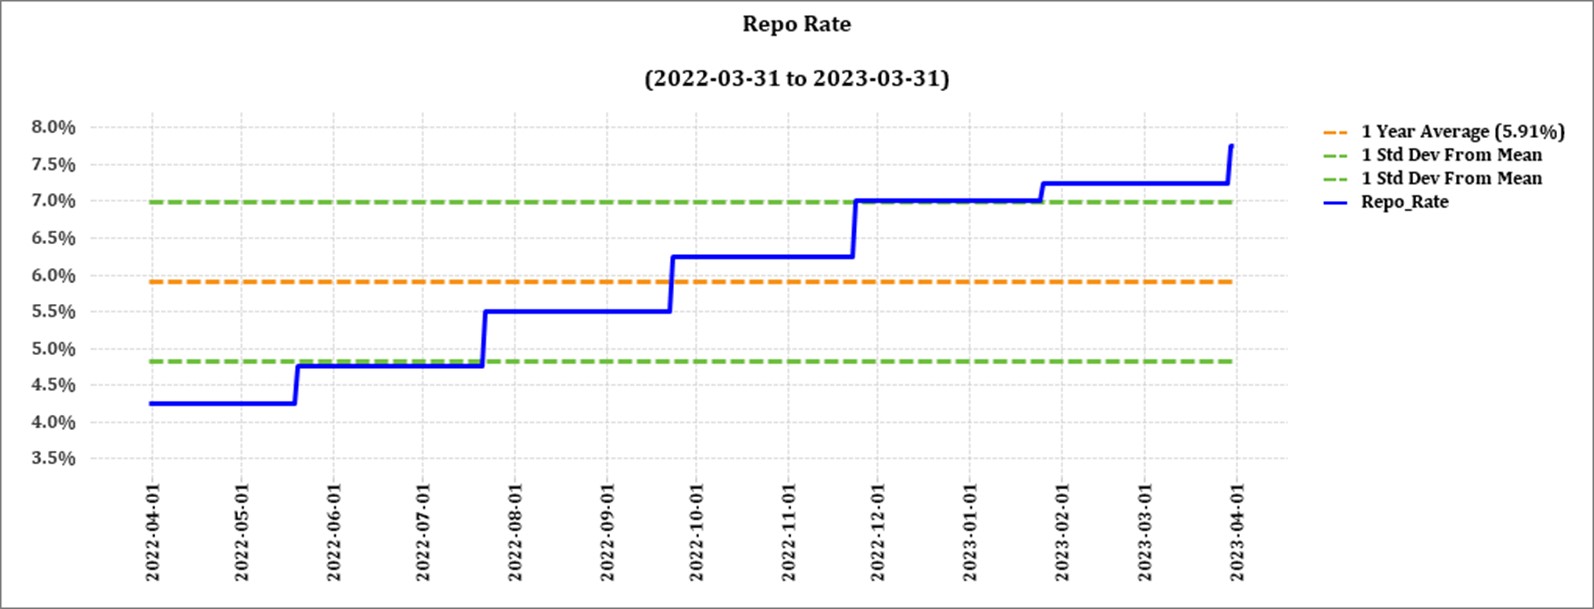
The latest increase of 50 basis points (bps) came into effect on 30 March 2023. The South African Reserve Bank made several interest rates cuts to bring relief to the economy after Covid-19, but since November 2021 borrowing costs rose again by a cumulative 425 bps and another hike is expected in May. The repo rate is currently 7,75% and the prime rate is 11,25%. The next MPC meeting date is 25 May 2023.
Interest rate movement:
- 27 January 2022: 7,50%
- 24 March 2022: 7,75%
- 19 May 2022: 8,25%
- 21 July 2022: 9,00%
- 22 September 2022: 9,75%
- 24 November 2022: 10,50%
- 26 January 2023: 10,75%
- 30 March 2023: 11,25%
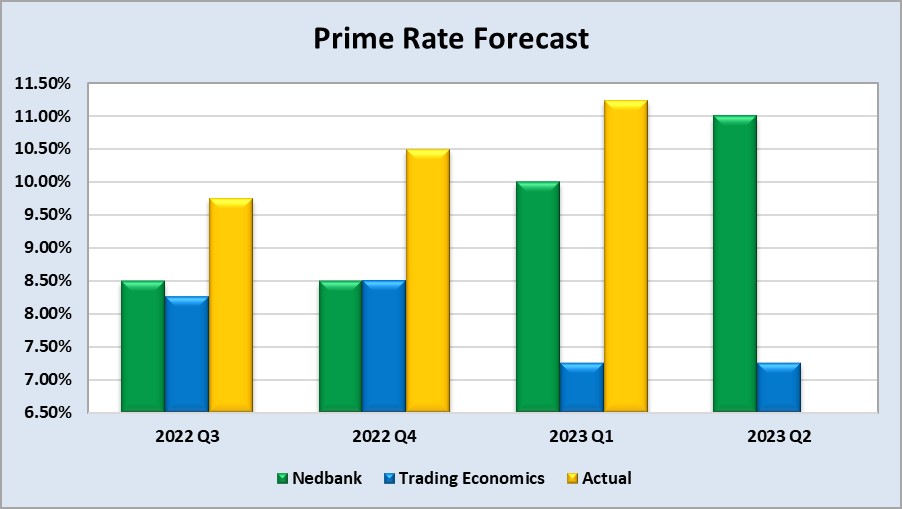
The following graph shows the prime rate forecast for 2022 Quarter 1 to 2022 Quarter 4. Q1, Q2 and Q3 experienced higher interest rates than anticipated by Nedbank and Trading Economics.
• Highlights in the agrochemical sector
Fertiliser prices have eased from their early 2022 peaks but we are still in a period of high fertiliser prices. The factors contributing to the high fertiliser prices have not gone away and the situation is currently ‘unstably stable’ according to Jason Minkhorst. Food insecurity, inflation, Ukraine war and China’s policy of export restrictions around fertiliser are still concerns. With the northern hemisphere’s planting season approaching and the demand for fertiliser there might be a rally in fertiliser prices.
Source: https://www.farmersweekly.co.nz/markets/fertiliser-prices-finally-show-signs-of-easing/
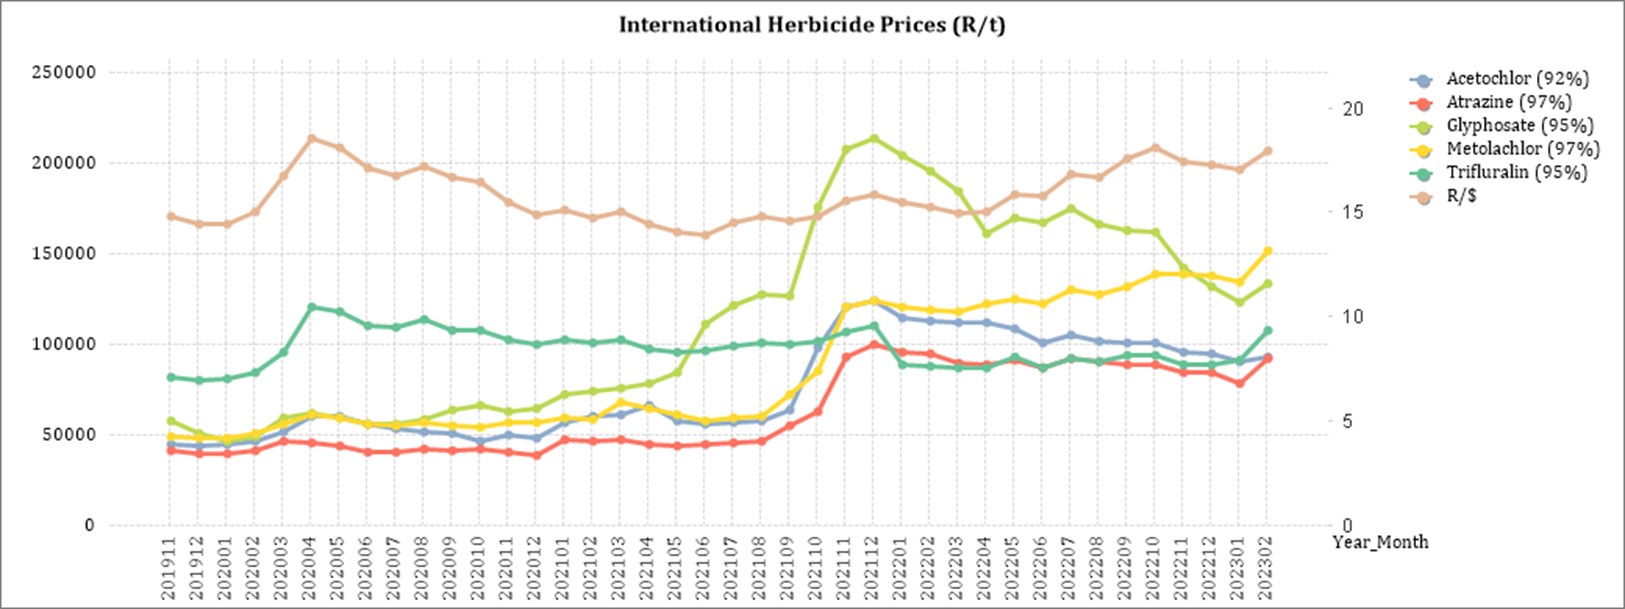
Herbicides
The following products are the main products regarding herbicides that may have an impact on input costs for producers:
- Glyphosate (95%)
- Acetochlor (92%)
- Atrazine (97%)
- Metolachlor (97%)
- Trifluralin (95%)
The following comparison is from the March 2023 Grain SA report which reports the previous month’s prices.
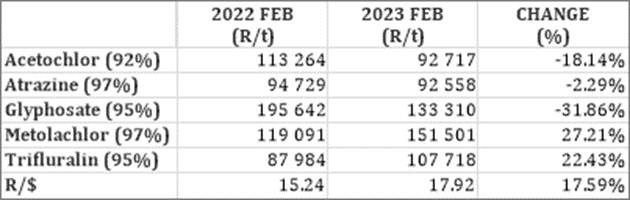
In comparison with the previous year’s prices, three of the five main products experienced a decrease in prices. Glyphosate had the biggest decrease with 31,86%.
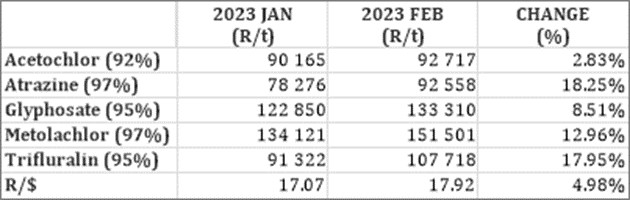
For the two months compared all of the products experienced a price increase.
The graph below shows the international herbicides prices (R/t) per product from November 2019 to February 2023.
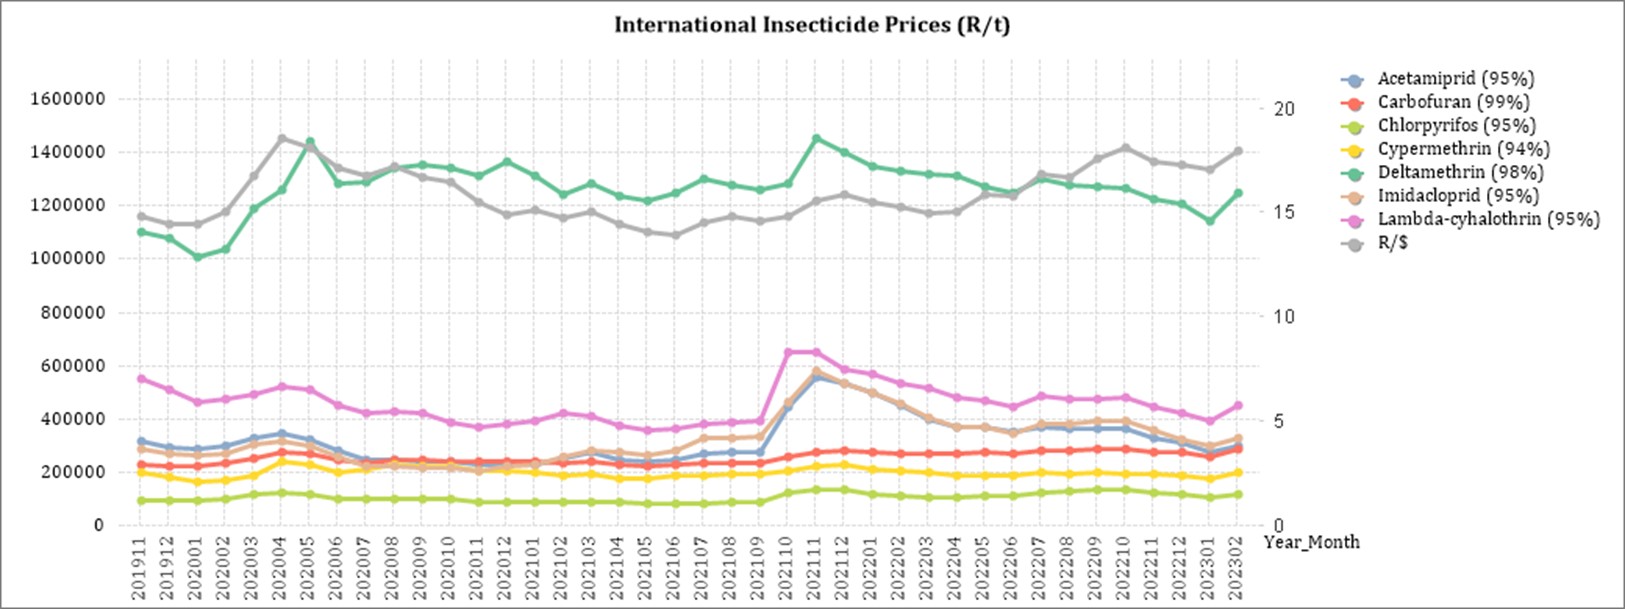
Insecticides
The following products are the main products regarding insecticides that may have an impact on input costs for producers,
Imidacloprid (95%)
Lambda-cyhalothrin (95%)
Carbofuran (99%)
Deltamethrin (98%)
Acetamiprid (95%)
Chlorpyrifos (95%)
Cypermethrin (94%)
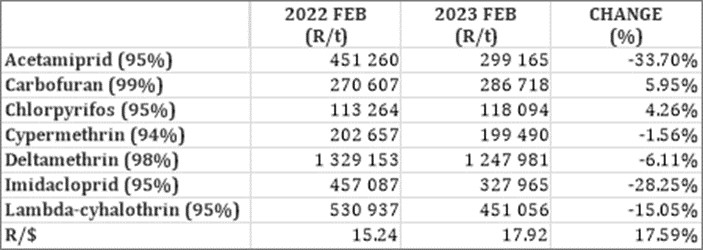
In comparison with the previous year’s prices, five of the products experienced a price decrease. The largest decrease was Acetamiprid with a decrease of 33,70% and Imidacloprid with 28,25%.
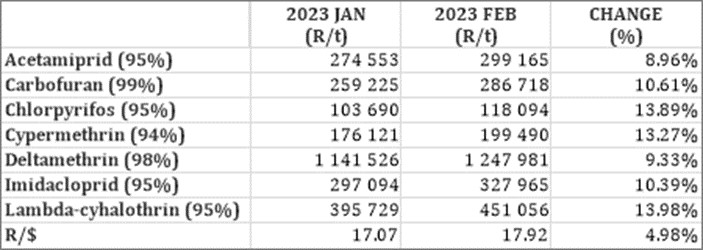
All of the products experienced slight price increases in February.
The graph below shows the international insecticide prices (R/t) per product from November 2019 to February 2023.
Fertiliser
The following fertiliser products are being analysed:
- Ammonia (Middle East)
- Urea (46%) (Eastern Europe)
- DAP (USA Gulf)
- KCL (CIS)
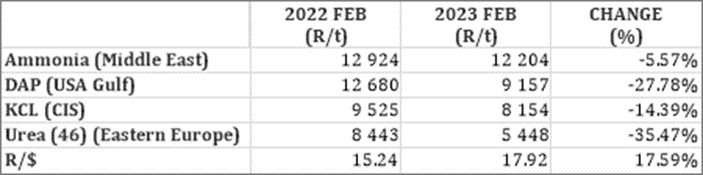
As seen in the table above, all of the main fertiliser products increased on a year-on-year basis. The biggest decrease, based on average international prices (R/t), was urea (35,47%).
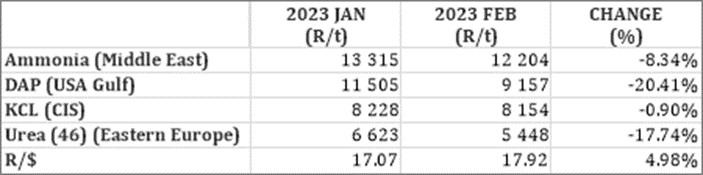
For the two months compared, all of the products experienced a decrease in price per ton. DAP experienced the biggest price decrease with 20,41%.
The graph below shows the International Fertiliser prices (R/t) per product from November 2019 to February 2023.
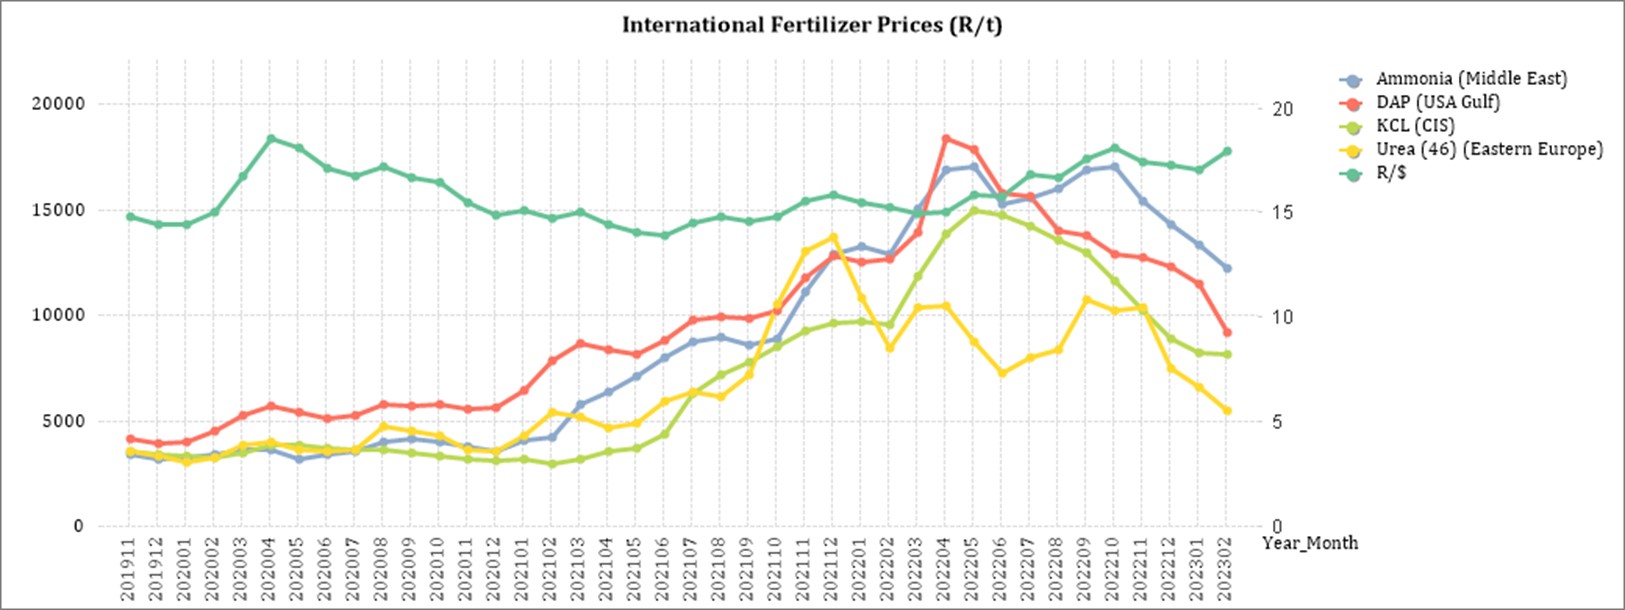
Sources: Grain SA – https://www.ft.com/content/4d746aa5-29e3-4796-b9e6-0b64c6865389
Urea market: Urea experienced a big price drop month to month which is unusual for this time of year.
Ammonium nitrate market (AN): The demand for ammonium remains low and suppliers are at risk of running out of storage space. If the product can’t be exported or shifted soon plants will have to idle due to a lack of storage space.
Phosphates: Phosphate prices rebounded in February and lower input costs are giving ammonium phosphate producers some relief.
Potash: The short-term outlook for potash prices is for further price declines. China seems to be confident that prices will drop and they have ample supply available.
Source: https://www.grainsa.co.za/upload/report_files/Chemical-and-Fertilizer-Report_Mrt-2023.pdf
- Economic impact of load shedding on the agricultural sector
Eskom and load-shedding
Modern farming businesses have become extremely dependent on electricity to run their irrigation, cooling, pumping stations, and mechanisation. Producers may need to find alternative power sources. These sources, while dependable, come at a cost. With increasing fuel costs and the big fuel consumption nature of generators, investing in a generator as a power source may not be a sustainable solution—especially for small-scale farmers who are sensitive to increasing variables costs. With even higher levels of load shedding expected in 2023 these input costs will soon be much higher.When producers fail to find alternative sources, they take the risk of forfeiting water quotas for irrigating purposes which can cause the business to go under.
Machinery and equipment are damaged and repairment comes to a standstill as a result of power outages. Producers may be forced to work after hours when there is electricity, leading to increased expenditure on overtime wages and increasing production costs. Some producers may not be able to afford this, given that production costs such as fertiliser and fuel have already increased a lot over the last few months.
According to economist Dawie Roodt, South Africa has been getting poorer for the past ten years on a per capita basis and one of the major contributors to this is a lack of electricity.
The producers’ production has a direct impact on their ability to repay loans. With increasing inflation and higher interest rates in South Africa, the repayment capacity of loans decreases and are less likely.
Nersa granted Eskom a 18,65% hike in electricity prices for the 2023/2024 tariff year. It will be effective from 1 April 2023. With load shedding already increasing input costs in many sectors due to generators and other energy sources being expensive to run, the latest electricity increase is going to cripple producers even further and threaten food security.
Sources
https://businesstech.co.za/news/energy/602470/experts-give-bleak-outlook-for-load-shedding-in-south-africa-report/
https://maroelamedia.co.za/nuus/sa-nuus/private-verskaffers-kan-kragrevolusie-veroorsaak/
https://maroelamedia.co.za/nuus/sa-nuus/tshwane-bekommerd-oor-beurtkrag-wipwaentjierit/
https://www.businesslive.co.za/bd/national/2023-01-12-power-cuts-are-sowing-the-seeds-of-food-crisis-say-farmers/
https://www.chaifm.com/podcast/2022-07-06-christo-van-der-rheede
https://www.news24.com/news24/community-newspaper/paarlpost/electricty-tariff-hike-will-hinder-agriculture-20230113
• State of the nation address (SONA)
On Thursday, 09 February 2023, President Cyril Ramaphosa delivered the state of the nation address and made two important announcements. A National State of Disaster has been declared in response to dealing with the energy crisis and the proposal to appoint a Minister of Electricity is made. It is important that the decision to declare a National State of Disaster be taken seriously and treated with the necessary controls in order to prevent corruption. Whether the appointment of a Minister of Electricity will be the answer to the electricity crisis is debateable.
Resolving the energy crisis is essential for South Africa’s GDP growth and combating the socioeconomic challenges. It is clear from the SONA that current tactic to resolve the energy crisis is not effective. Change has to be enforced and parties should be held accountable for not delivering quality timely services.
On 22 February 2023, Minister of Finance Enoch Godongwana, also delivered the budget speech. A key takeaway from the speech is the tax incentives to businesses and households to install solar panelling, although it will only be implemented for a year effective from 1 March 2023. Businesses will receive a 125% tax incentive on qualifying investment costs for a two-year window period. There will be no limit to the qualifying cost for such investment. The threshold for households on the other hand appears to be quite conservative as individuals will be able to claim 25% of the cost spent on solar panels limited to an amount of up to R15 000.
The new regulation was published and effective on 27 February 2023. The state of disaster regulation will only apply for the duration of the state of disaster. The regulations will in essence:
- Allow ministers to grant exemptions from load shedding or reduce load shedding schedules.
- Exempt Eskom from provisions of the National Environmental Act.
- Grant access to emergency procurement procedures to secure funding.
- Allow Eskom to import electricity from neighbouring countries.
- Facilitate the sale of electricity generated by individuals, the state, or private groups by allowing them to license as distributors, etc.
The full regulations can be found on the Government Gazette.
Global risks – World Economic Forum
The Global Risk Report released by the WEF displays the top global risks over the short and long-term. The top 5 short term global risks ranked by severity over two years are:
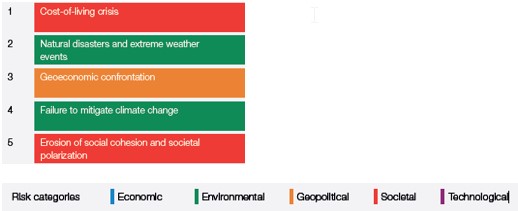
The cost of living is already at worrying levels with the FAO Price Index reaching the highest level in March 2022 since its inception in 1990. What is interesting to see is that the current number one global risk, cost-of-living crisis, will only be the 15th highest risk in the long-term.
Global inflation is rising and uncertainty looms over when the Russian/Ukraine war will end and when food exports, inflation and interest rates will start to stabilise or ease. Rising energy prices and a shortage of energy supply pose a further threat to the cost of living. According to the WEF there is a material possibility of a global food supply crisis occurring in 2023. This can lead to a humanitarian crisis with a up flair in protests and political unrests.
The top 5 long term global risks (ten years) ranked by severity are:
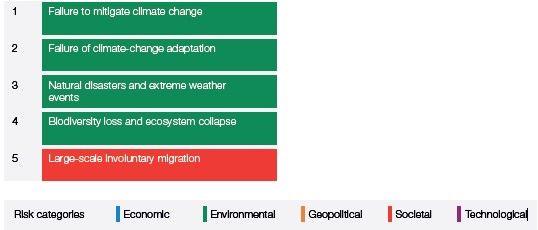
The number one long term risk namely failure to mitigate climate change refers to the failure of governments, businesses and individuals to enforce, enact or invest in effective climate-change mitigation measures, such as the decarbonization of economic activity. It is seen as the global risk that we are the least prepared for.
Pressure on energy-importing countries to invest in cleaner renewable energy sources have already limited progress on climate change mitigation due to geopolitical tensions and economic pressures. A good example of progress almost being reversed is the EU spending €50 billion on new and expanded fossil-fuel infrastructure and some countries restarting coal power stations instead of investing in cleaner sources. Progress to mitigate climate change is slow and short-term goals are often pursued without consideration of the long-term effects.
Source: WEF_Global Risks Report 2023 pdf
The impact of South Africa being grey-listed
The Financial Action Task Force (FATF) grey list refers to the FATF’s practice of publicly identifying countries with strategic Anti- Money Laundering and Countering the Financing of Terrorism (AML/CFT) deficiencies.
In summary, the grey listing of a country means that its government has adopted an action plan to address to deficiencies identified during its mutual evaluation after an observation period, and to implement such action plan within a defined time period, and with FATF monitoring such implementation.
There are a number of impacts on a country’s economy that has been grey listed. A few of them are:
- Reputation damage: According to Treasury the most significant implication to a country that is grey-listed is the reputational damage to the country, as its effectiveness in combatting financial crimes like corruption and money-laundering as well as terror financing are deemed to be below international standards.
- Challenges for SA business wishing to access international financial services: One of the biggest risks is related to the withdrawal of banking and payments services necessary for trade, remittance, and other transfers and economic growth. Cross-border transactions will endure more red tape.
It should be noted that FATF does not require enhanced due diligence measures to be applied, but rather that all jurisdictions take account of it in their risk analysis. - Enhanced reporting requirements when transacting: This will make South Africa less competitive in a global market as it will take a lot more time to do business due to extra paperwork and due diligence.
- Higher direct costs: If greater due diligence has to be performed it will come at a cost or investors might demand a higher rate of return when investing in South African institutions.
- Reduction in foreign direct investment: Being seen as a high-risk investment destination, some investors may not be allowed to invest in the country anymore and withdraw investments in the country.
However, with this being said, South Africa is a large exporter of raw materials and the world depends on us to continue providing those raw materials. South Africa also has a highly regarded financial sector and many offshore platforms will continue to operate as usual.
Before South Africa was grey-listed the world knew we were a high-risk jurisdiction to do business with and they treated us as such. Thus, being grey-listed is not such a shock to the world and our economy as one might think. On the bright side, Finance Minister Enoch Godongwana is confident that South Africa will implement the action plan timeous and be removed from the grey-list by mid-2024. Mauritius was removed from the list after 18 months.
Sources
https://businesstech.co.za/news/business-opinion/669803/its-time-to-be-realistic-about-south-africas-greylisting/
https://www.sableinternational.com/blog/south-africa-s-greylisting-what-does-it-mean
https://www.treasury.gov.za/comm_media/press/2023/2023022501%20FATF%20Grey%20Listing%20Fact%20Sheet.pdf
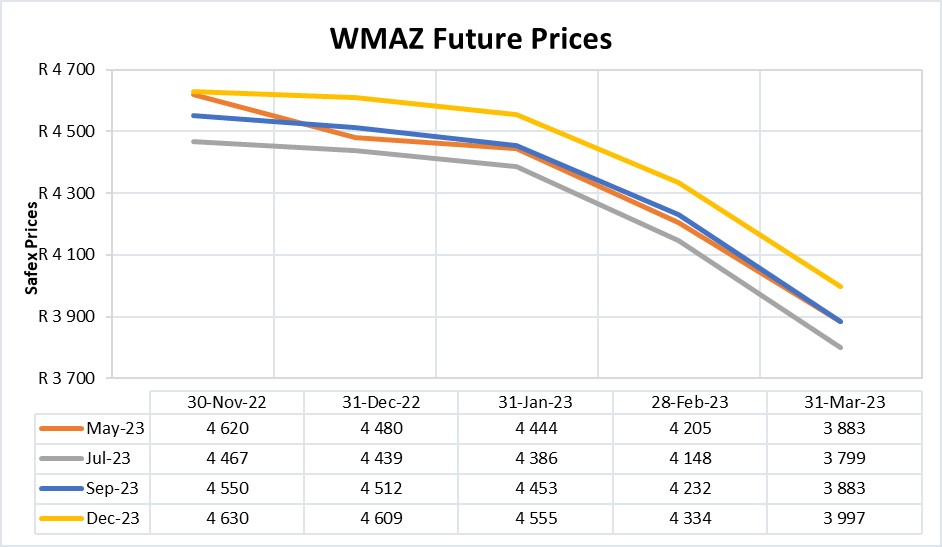
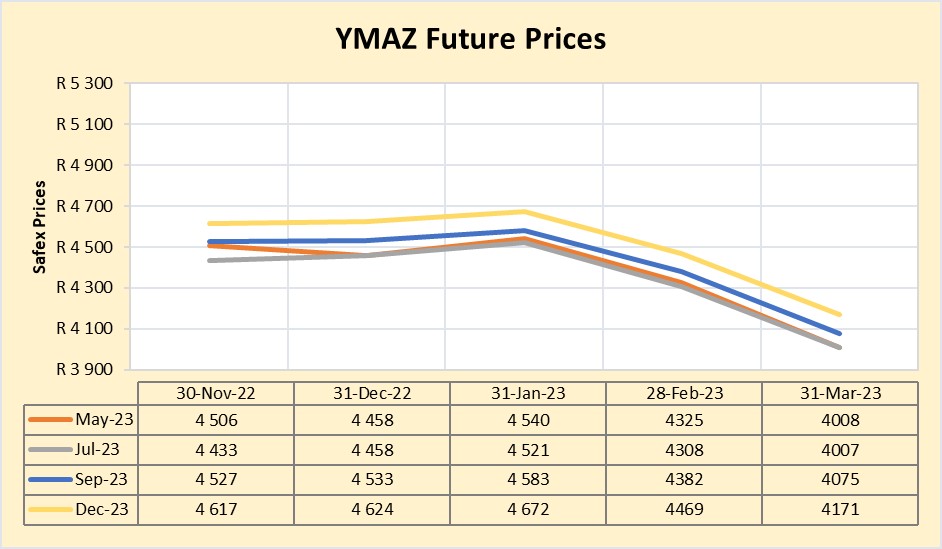
FUTURE PRICES
The graphs below illustrate the market sentiment for maize, in the form of future contracts, for the upcoming contract months. The market sentiment is the expectation of supply and demand fundamentals relating to white and yellow maize in South Africa.
Source: Sagis/JSE
Source: Sagis/JSE
The biggest factor contributing to the lower corn prices is the decline in CBOT corn prices, amidst the weaker rand. As the season progresses prices might start to rise again. The USDA forecast the world ending stock to be 3% less than in 2021/2022 and Argentina is currently experiencing a drought.
Factors to keep an eye on are the USA export rate, demand for ethanol and the Brazilian planting rate. South Africa’s new season looks positive and it seems that Africa will once again have a high demand for maize which will support prices.
Source: Juan Coertze, NWK Ltd
Fraud risk
FRAUD AWARENESS
Here are three fraud prevention tips:
Always take your time in making a decision. Avoid making decisions where someone demands an urgent answer or claims that the deal will only be available for the remainder of this phone call. Take your time and do your homework before making decisions.
Don’t buy from an unfamiliar company. Read reviews and ask others if they have heard of this company or what their experience was buying from them. If you can’t get any information or it is mostly negative it is best to rather use a reputable and familiar company.
Never sign blank insurance claim forms. This goes for any blank forms for that matter. Do not open yourself up for fraudulent transactions. Make sure you know what you are signing and that you are comfortable with the content.
Source: https://www.ncoa.org/article/22-tips-for-seniors-to-avoid-scams


