The NWK Limited external factors report provides an overview of the main external factors that NWK and its clients are exposed to at a specific point in time. This report opts to aid in a timely basis to foresee external market and other factors that may have an impact on any business and clients. The main focus of this document is to have a closer look at external factors that can affect any business and our customers.
Executive summary
Unfortunately, the inflation rate rose with 0,5% to 5,9% in October. Retail trade decreased with 0,5% in August on a year-to-year basis. The unemployment rate eased slightly to 32,6% in the second quarter of 2023. The GDP growth for the second quarter was 0.6%. The Policy Uncertainty Index eased to 71,8 points in Q3 from a record high of 76,2 in Q2.
The National Agricultural Marketing Council (NAMC) projected the ending stock for 30 April 2024 of white and yellow maize to be less than the 2022/2023 season. According to the ninth maize forecast the three main maize producing areas, namely the Free State, Mpumalanga and North West are expected to produce 83% of the 2022/2023 crop.
During the previous Monetary Policy Committee (MPC) meeting held on 23 November the committee once again decided that interest rates will remain unchanged. The repo rate is currently 8,25% and the prime rate 11,75%.
Load shedding poses long term risks for the agricultural sector on a supply and input cost level. Cost-effective and sustainable alternative solutions must be considered in order to reduce the dependency on Eskom for electricity. With fuel prices sky rocketing and producers being more and more reliant on generators for electricity this is a disaster.
According to the World Economic Forum (WEF) the number one short term risk is cost of living.
Business climate: Key risk drivers
A few highlights regarding certain risk drivers are mentioned below.
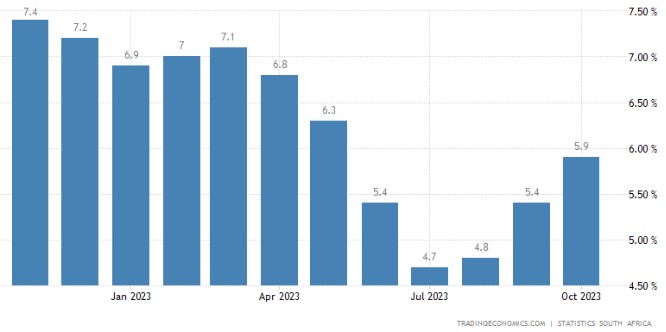
According to Trading Economics South Africa’s annual inflation rate rose to 5,9% in October of 2023 from 5,4% in the prior month, verging on the upper limit of the South African Reserve Bank’s inflation target range of 3% to 6%.
Brent crude oil monthly average prices decreased by $3,13 per barrel from September to October. South Africa’s retail trade decreased with 0,5% from a year earlier in August. This is the ninth-consecutive month of decline in retail activity. According to Statistics SA, South Africa’s unemployment rate eased slightly to 31,9%.
The GDP growth rate rose to 0,6% on quarter for the second quarter in 2023. Eight of the ten activities picked up in the first quarter.
The local Safex price was considered to be at break-even point according to October 2023 white maize spot prices. According to the World Bank’s grain price index maize prices declined 18% in the third quarter. Ukraine had a bumper harvest in 2023, with maize production increasing by 4% compared to 2022.
Despite repeated attacks on its ports, grain shipments continued to flow out of Ukraine, primarily through the Danube River. Global supply of maize and soybeans for the 2023/2024 season is forecast to be much higher than the 2022/2023 season.
Adverse weather patterns can reduce yields and also affect the Safex price; during October sea-surface temperatures rose further, moving toward an El Niño until at least February 2024. The impact of El Niño on yields and prices varies across geographies, crops, and seasons. Historically, El Niño is associated with rising prices of agricultural commodities. For example, El Niño reduces the global average yield for maize by 2,3% while it increases soybean yields by 3,5% (Iizumi et al. 2014).
South Africa’s new season looks positive and it seems that Africa will once again have a high demand for maize which will support prices. The solar cycle is also approaching its turning point in 2025, which also indicates less rainfall predicted for coming years.
The Iron ore price saw a decrease of $1,63 per metric ton from September to October. Prices for iron ore cargoes with a 63,5% iron ore content for delivery into Tianjin eased slightly from the eight-month high of $133 per tonne on 15 November.
The Policy Uncertainty Index (PUI) eased to 71,8 points in Q3 from a historical high of 76,2 points in Q2. While several contrary factors kept the PUI elevated, there were apparently enough positive ones to bring the PUI slightly lower although remaining well in the negative territory. The PUI is the net outcome of positive and negative factors influencing the calibration of policy uncertainty over the relevant period. It is seen to have important implications for business confidence and the investment climate in the country.
Sources
https://tradingeconomics.com/south-africa/inflation-cpi
https://tradingeconomics.com/commodity/brent-crude-oil
https://tradingeconomics.com/south-africa/unemployment-rate
https://www.agbiz.co.za/content/open/21-august-2023-agri-market-viewpoint-747
https://tradingeconomics.com/south-africa/gdp growth#:~:text=South%20Africa%20GDP%20Grows%201.2,expectations%20of%20a%200.7%25%20growth
https://www.statssa.gov.za/?page_id=737&id=1
https://tradingeconomics.com/commodity/iron-ore
https://openknowledge.worldbank.org/server/api/core/bitstreams/27189ca2-d947-4ca2-8e3f-a36b3b5bf4ba/content
PUI_2023Q3_29 September 203.pdf
Agbiz/IDC ACI deteriorated further in Q1, 2023
The Agricultural Business Chamber (Agbiz) quarterly conducts a survey in order to create an Agribusiness Confidence Index (ACI). The Agbiz/IDC ACI, which was released on 19 September 2023, reflects the perceptions of at least 25 agribusiness decision-makers on the ten most important aspects influencing a business in the agricultural sector.
These ten aspects are:
- turnover;
- net operating income;
- market share;
- employment;
- capital investment;
- export volumes;
- economic growth;
- general agricultural conditions;
- debtor provision for bad debt; and
- financing cost.
These aspects are used by agribusiness executives, policymakers and economists to understand the perceptions of the agribusiness sector. It also serves as a leading indicator of the value of the agricultural output while providing a basis for agribusinesses to support their business decisions.
After remaining below the 50-point mark for three consecutive quarters, the Agbiz/IDC Agribusiness Confidence Index (ACI) rebounded by 6 points from Q2 2023 to 50 in Q3 2023. This improvement indicates that agribusinesses are cautiously adapting to the challenging operating business conditions in the country stemming from the numerous long-standing challenges such as deteriorating infrastructure, failing municipalities, intensified geopolitical tension, and persistent episodes of load-shedding.
The readings above the neutral 50-point mark imply that agribusinesses are optimistic about business conditions in South Africa. This survey was conducted between the last week of August and the first week of September, covering businesses operating in all agricultural subsectors across South Africa.
The graph below shows the Agribusiness Index from 2002 to middle 2022.
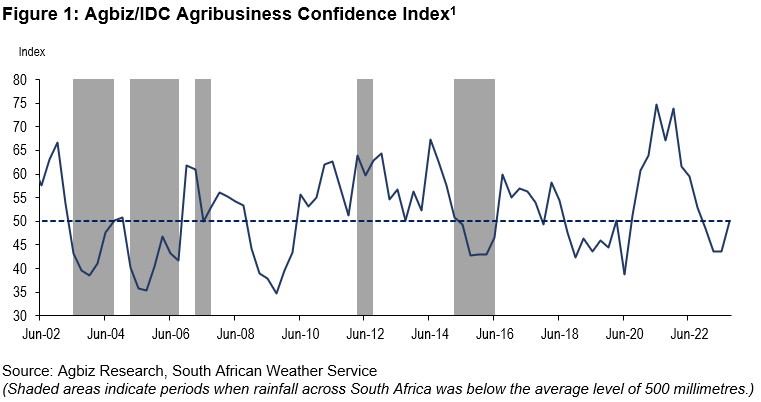 The ACI is comprised of ten subindices, of which seven declined in the first quarter of 2023. The turnover subindex is up by nine points to 74 while the net operating income subindex rose by 4 points to 59 points. Firms in the summer and winter grains, financial services and livestock mainly underpinned this optimism. The sentiment mostly mirrors the benefits of an ample agricultural harvest in the 2022/2023 season.
The employment subindex lifted by 11 points to 59. This optimism is unsurprising as the sector recently registered an improvement in jobs. For example, about 894 000 people were employed in primary agriculture in the second quarter, up 1% q/q and 2% y/y. This is the highest farm employment level since the last quarter of 2016 and is well above the long-term agricultural employment of 780 000.
Confidence in the general economic conditions increased by 16 points to 26. The recent positive growth figures for the year’s second quarter perhaps influenced the sentiment.
The general agricultural conditions subindex rose 8 points to 56 in Q3 2023. Favourable production conditions in the winter grains regions of the country mainly supported this increase. Still, there are growing concerns about the upcoming 2023/2024 summer crop season due to the expected El Niño, although we suspect its impact will likely be mild.
The market share of the agribusiness subindex is up 2 points from Q2 to 59. The respondents that mainly underscored this improvement were primarily in the summer and winter grains, while other subsectors maintained an unchanged view from the last quarter.
The subindices of the debtor provision for bad debt and financing costs are interpreted differently from the abovementioned indices. A decline is viewed as a favourable development, while an uptick signals growing financial strain.
In the third quarter, the subindex for debtor provision for bad debt was up by 8 points to 41, which is unfavourable and signals a possible pressure in financing as businesses are possibly increasing borrowing to finance the alternative energy sources. Meanwhile, the financing costs indices fell by 1 point to 6, signalling that companies likely believe the interest rate hike cycle has ended.
In conclusion, the Agbiz/IDC ACI’s Q3 results show a slightly upbeat mood after the past three-quarters of deterioration in sentiment. “Still, the long-standing challenges of weakening municipalities, deteriorating roads, rising crime, inefficient logistics, and persistent load-shedding remain the major challenges that could undermine the sector’s long-term growth. These are aspects that both the government and private sector should collaboratively work to resolve to attract investments,” says Wandile Sihlobo, chief economist of the Agricultural Business Chamber of SA (Agbiz).
Source: www.agbiz.co.za, Issued by Wandile Sihlobo, chief economist: Agbiz, 19 September 2023
Weather and climate
NATIONAL ASSESSMENT
The El Niño-Southern Oscillation (ENSO) is now in an El Niño phase at 100%. The chance of an El Niño still being present in April 2024 is 58%.
A strong El Niño is predicted for the coming rainfall season as the likelihood percentages vary from 100% to 89% until Fevruary 2024. The impact of El Niño on the coming 2023/2024 season is predicted to not have such a severe impact as the previous three years experienced above-average rainfall, allowing for enough soil moisture to still produce average to above-average yields. The impact on the 2024/2025 season will be analysed based on the 2023/2024 rainfall received.
The latest Climate Watch issued by the SA Weather Service predicts below-normal rainfall during the Nov-Dec-Jan and Dec-Jan-Feb seasons over the western and central parts of the country, with the highest probabilities of below-normal rainfall over the far-western parts of the country. Predictions still favour above-normal rainfall conditions over the north-eastern parts of the country, even with an El Niño in place. Bottom line, South Africa might face a strong El Niño with a very hot summer.
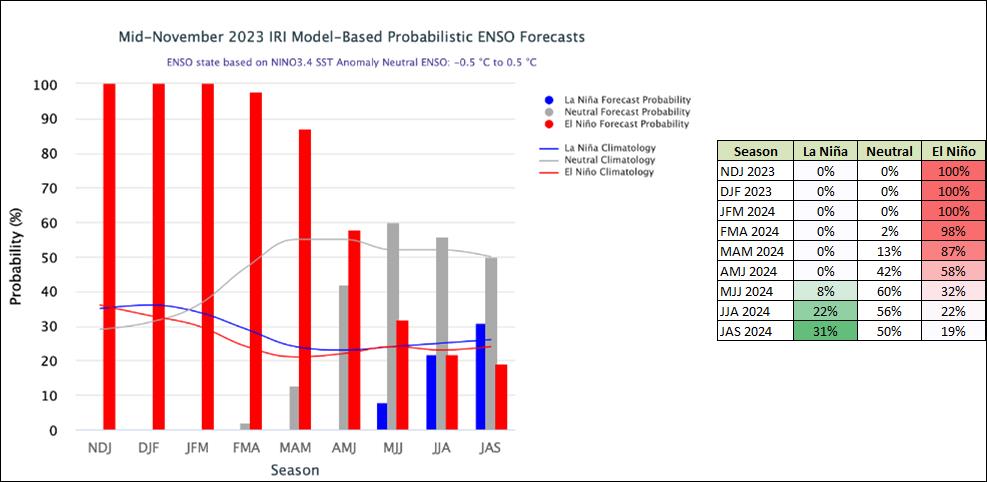
The Burea’s ENSO Outlook is at El Niño Alert which means that El Niño is anticipated to continue through spring. The current SSTs for December to April range from +2,1°C to +1,2°C. Indicators show that an El Niño will be present up until at least March. Persistent values warmer than +0,8°C are typical of an El Niño.

According to the graph below, ENSO is in an El Niño phase, and ocean temperatures near the equator are slowly starting to get warmer. The upward trajectory of the graph shows that there will be less rain than usual as temperatures rise.
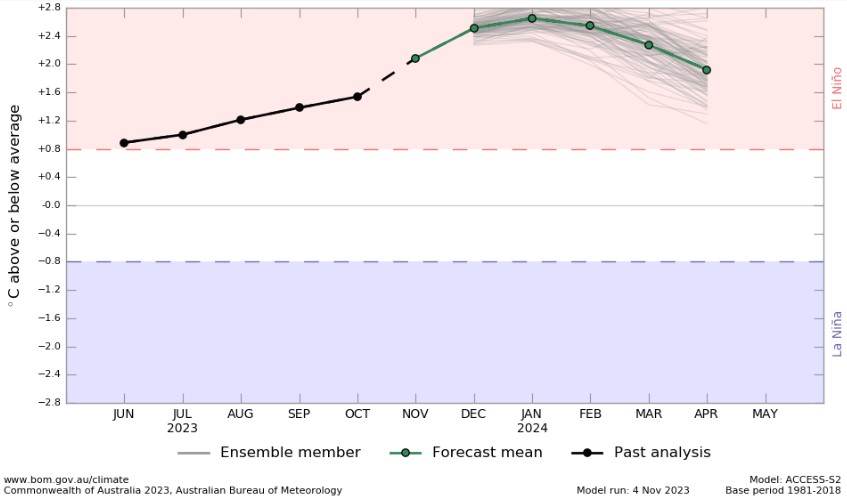
Source: Australian Government – Bureau of Meteorology
SUNSPOTS
Sunspots are darker, cooler areas on the surface of the sun that arise due to disturbances in the sun’s magnetic field. Every eleven years, the number of spots dotting the surface of the sun increases and decreases and forms the solar cycle.
Sources
https://www.sciencedirect.com/science/article/abs/pii/S136468262200116X#:~:text=It%20was%20observed%20that%20rainfall,an%20increasing%20effect%20on%20rainfall
https://www.space.com/solar-cycle-frequency-prediction-facts May 27,2022.
https://eos.org/articles/why-did-sunspots-disappear-for-70-years-nearby-star-holds-clues 10 June, 2022.
According to science direct the rainfall rate is directly related to the sunspot number but shows different characteristics during solar maximum years. Though a lag correlation exists between sunspot number and rainfall, sunspots have an increasing effect on rainfall. Studies show that the more sunspots are present the higher the rainfall and the less sunspots the lower the rainfall.
ENSO occurs at irregular interval between three and seven years causing global climate system variation. Considering this event occurs periodically, it might be triggered by the eleven years of solar cycle as an energy source.
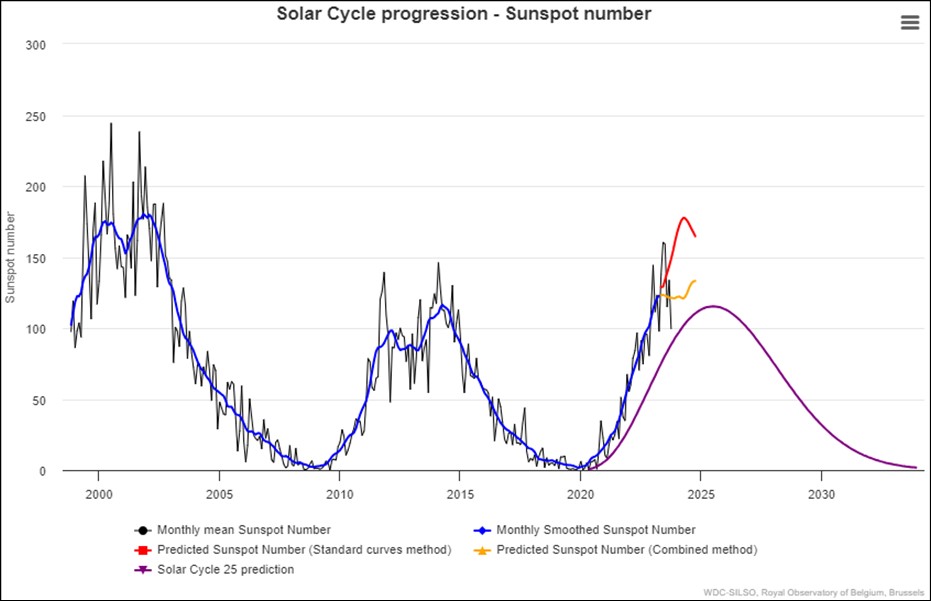
The graph below shows the eleven year solar cycles since before the 2000s. As the graph is in an upward trajectile higher rainfall can be expected – La Niña. As the graph reaches its turning point and moves in a downward trajectile less rainfall is expected characteristic of an El Niño.
The last three years were La Niña years and as the graph is approaching its forecasted turning point in 2025 an El Niño can be expected for the coming years. ENSO indicators are currently at ENSO-alert levels as the current El Niño is expected to continue through to spring. In September and October 2023, the actual monthly mean sunspot numbers were less than the predicted values (standard curves method), indicating that the current phase of decreasing sunspots is associated with less rainfall. For September the actual monthly mean sunspot numbers were higher than the predicted values (combined method).
One could assume that ENSO-neutral conditions start to develop as the number of sunspots is close to reaching their maximum, the turning point on the graph, and then turn towards El Niño as the sunspots get less and the graph move downwards.
Market risk
GRAIN MARKET ANALYSIS
• Ending stock – national
Ending stock data is gathered from the NAMC. The estimates are reassessed and reported by the Grain and Oilseeds Supply and Demand Estimates Committee. The following is the projected ending stock for April 2024 in tonnages for the 2023/2024 season:
- White maize => 1 675 200 t
- Yellow maize => 1 311 257 t
The following is a summary of September 2023 ending stock estimates for the 2022/2023 season:
- Wheat => 557 457 t
The following is a summary of the February 2024 projected final ending stock for the 2023/2024 season:
- Sunflower => 86 457 t
- Soybeans => 359 447 t
- Sorghum => 22 436 t
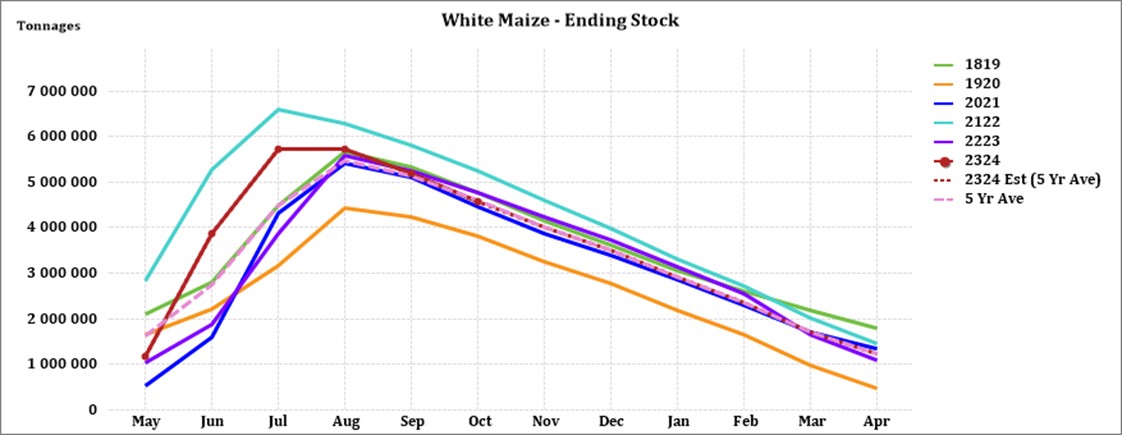
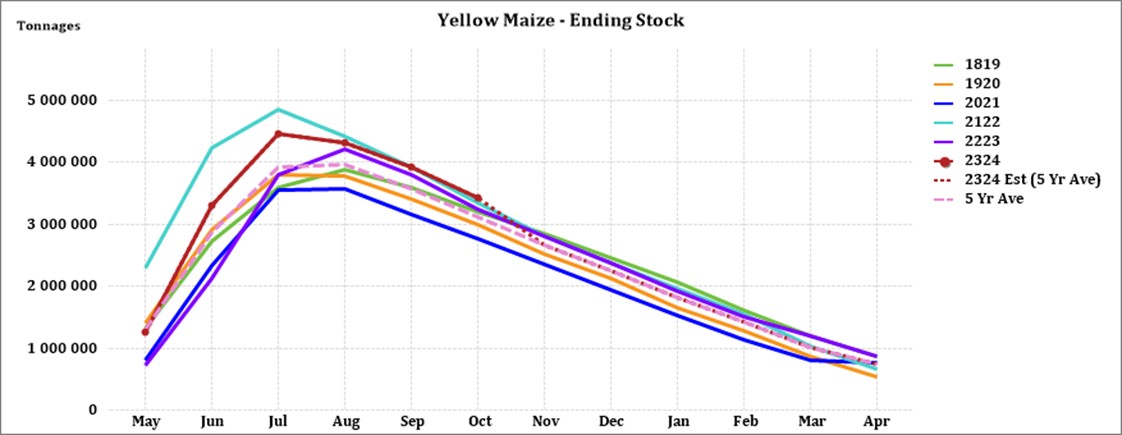
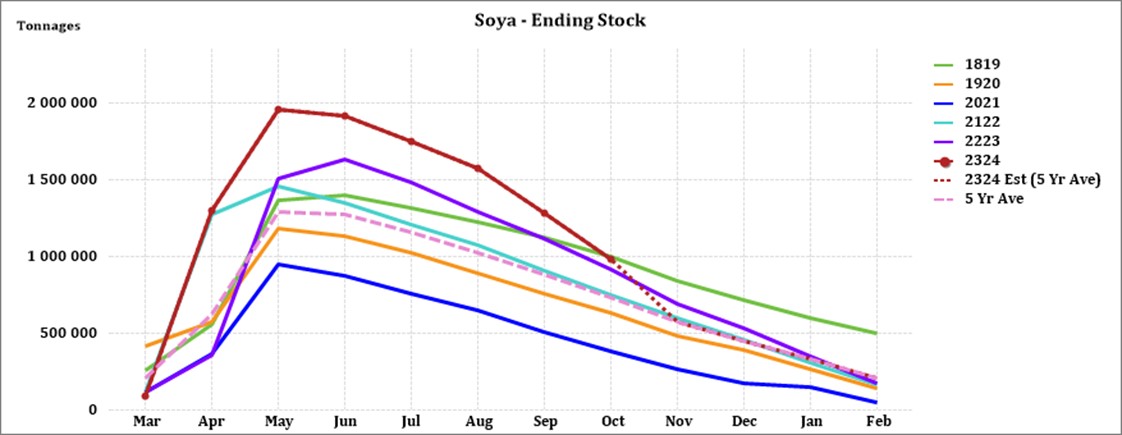
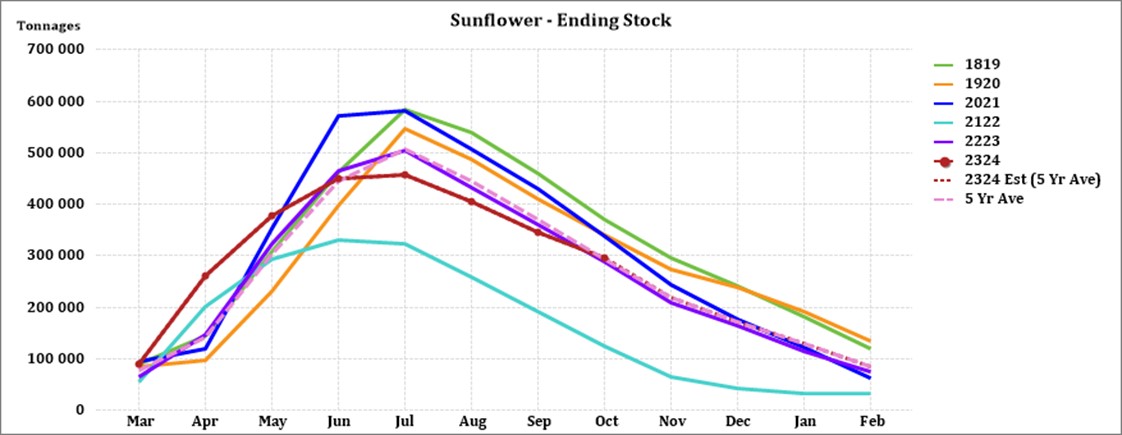
The graphs below show the predicted ending stock for the different commodities according to SAGIS data. A five-year average has been calculated to determine the estimated ending stock for the current season. The predicted white maize in April 2024, is 152 578 t more than the final for the 2022/2023 season. Yellow maize shows a 134 761 t decrease in ending stock compared to the previous season.
Source: Sagis
Source: Sagis
Source: Sagis
The forecasted soybean ending stock for February 2024 is 33 510 t more than February 2023.
Source: Sagis
The forecasted sunflower ending stock is 10 835 t more than the previous season ending stock.
• Crop estimations
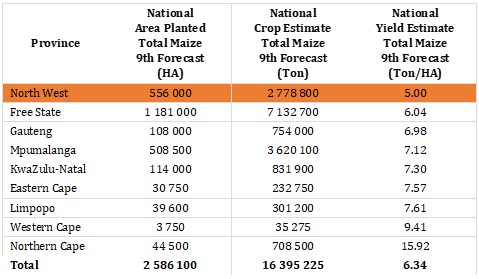
According to the Crop Estimate Committee (CEC) production forecast for 2023, the area estimate for maize is 2,586 million ha, which is 1,4% less than the actual 2,623 million ha planted for the previous season.
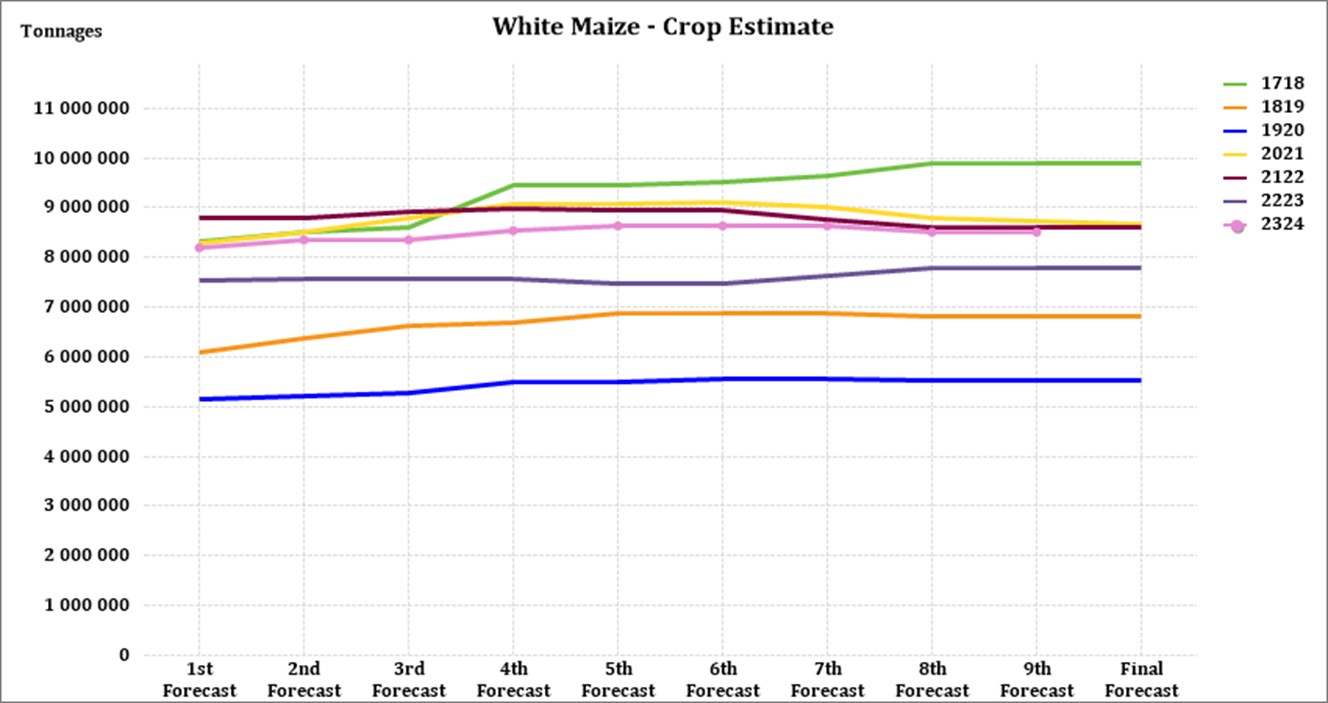
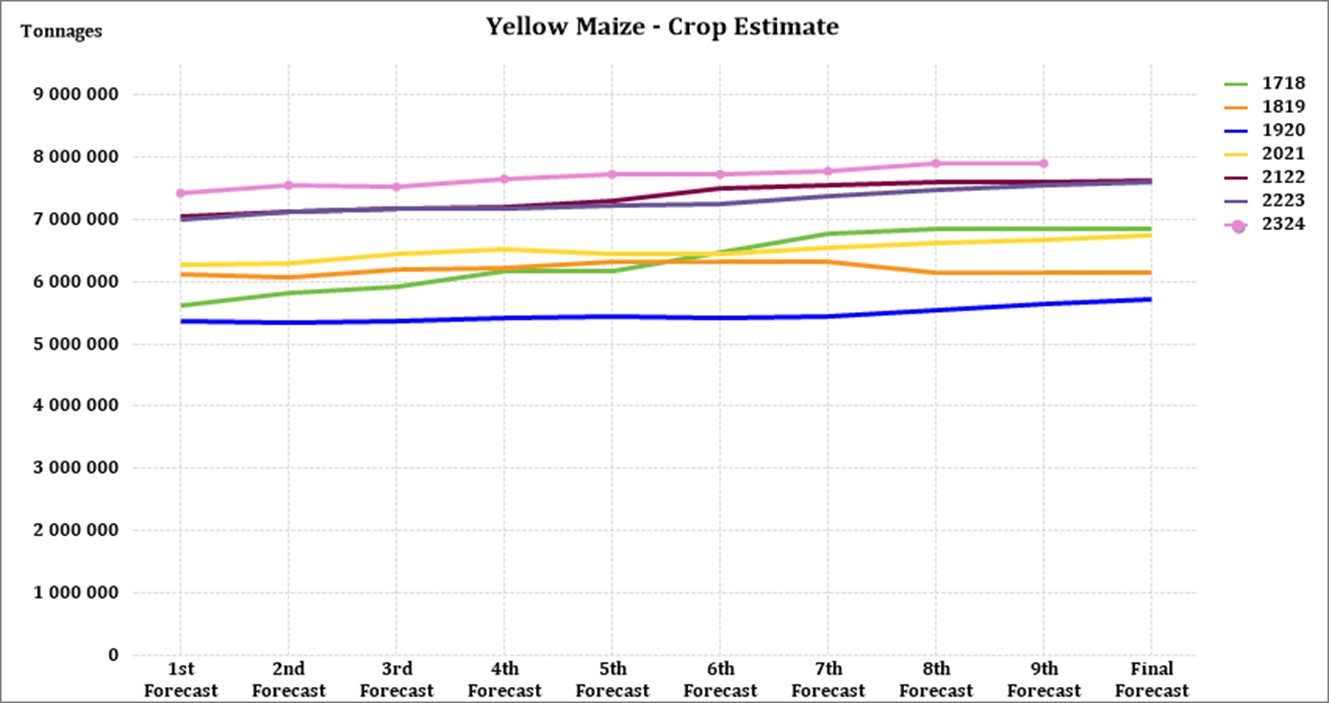
Although less hectares are planted to maize the harvest is estimated at 16,4 million t, 6% higher than the previous season’s harvest and the second-largest harvest on record.
Source: CEC (Crop Estimates Committee)
Source: CEC (Crop Estimates Committee)
Source: CEC (Crop Estimates Committee)
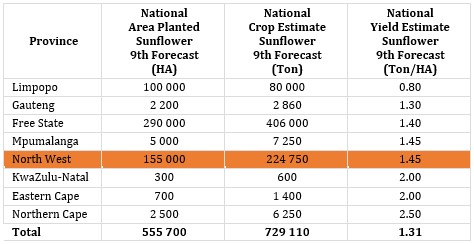
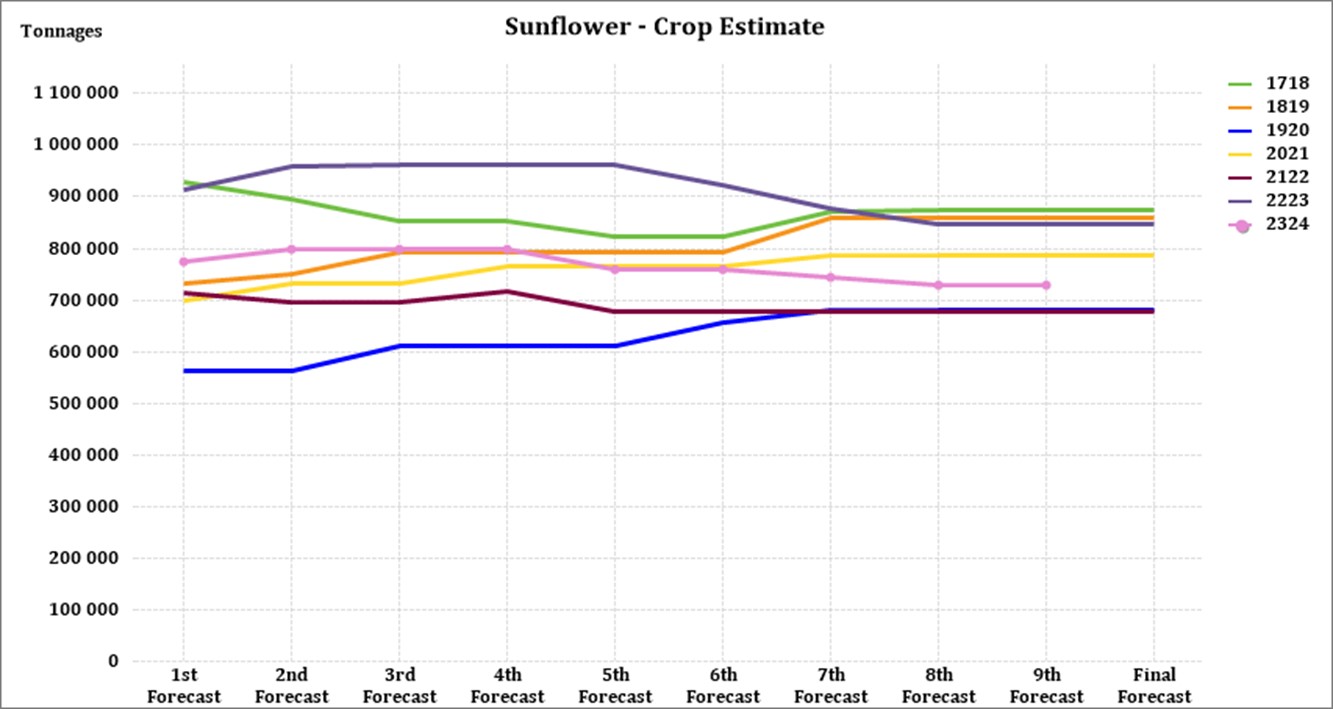
The area estimate for sunflower seed is 555 700 ha, which is 17% less than the 670 700 ha planted the previous season.
Source: CEC (Crop Estimates Committee)
Source: CEC (Crop Estimates Committee)
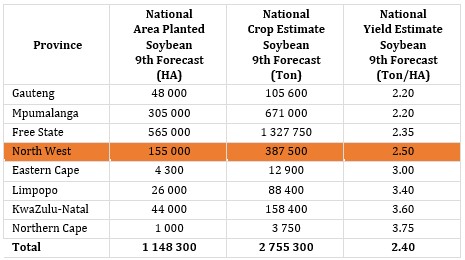
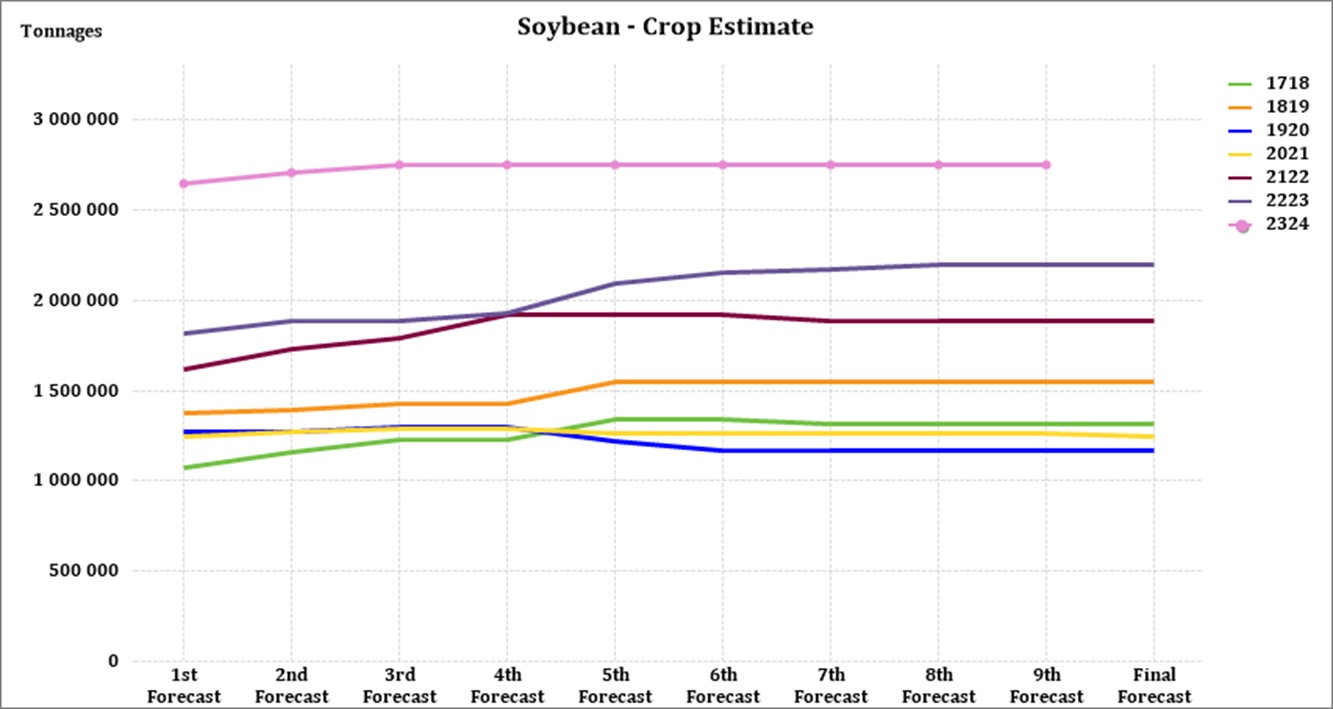
It is estimated that 1 148 300 ha have been planted for soybeans, which represents an increase of 24,1% compared to the actual 925 300 ha planted last season. This is the largest soybean area planted in the history of South Africa. The final harvest forecast for soybeans is 2,75 million tons which is a record high.
Source: CEC (Crop Estimates Committee)
Source: CEC (Crop Estimates Committee)
• Imports and exports – national
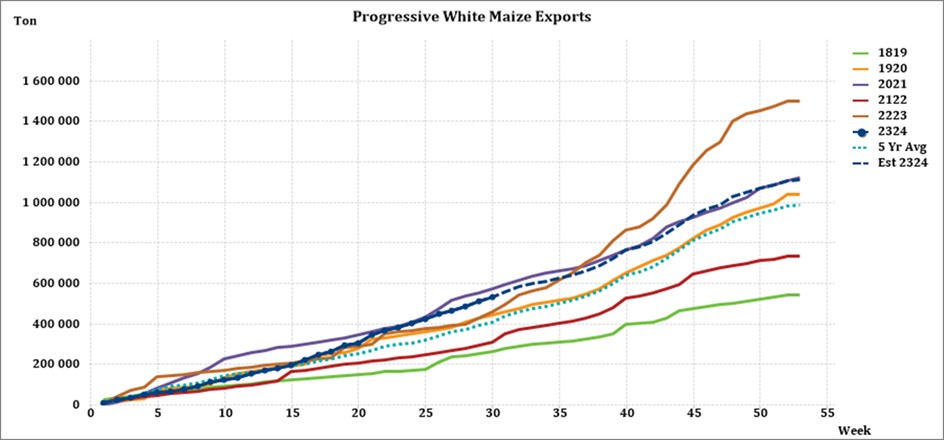
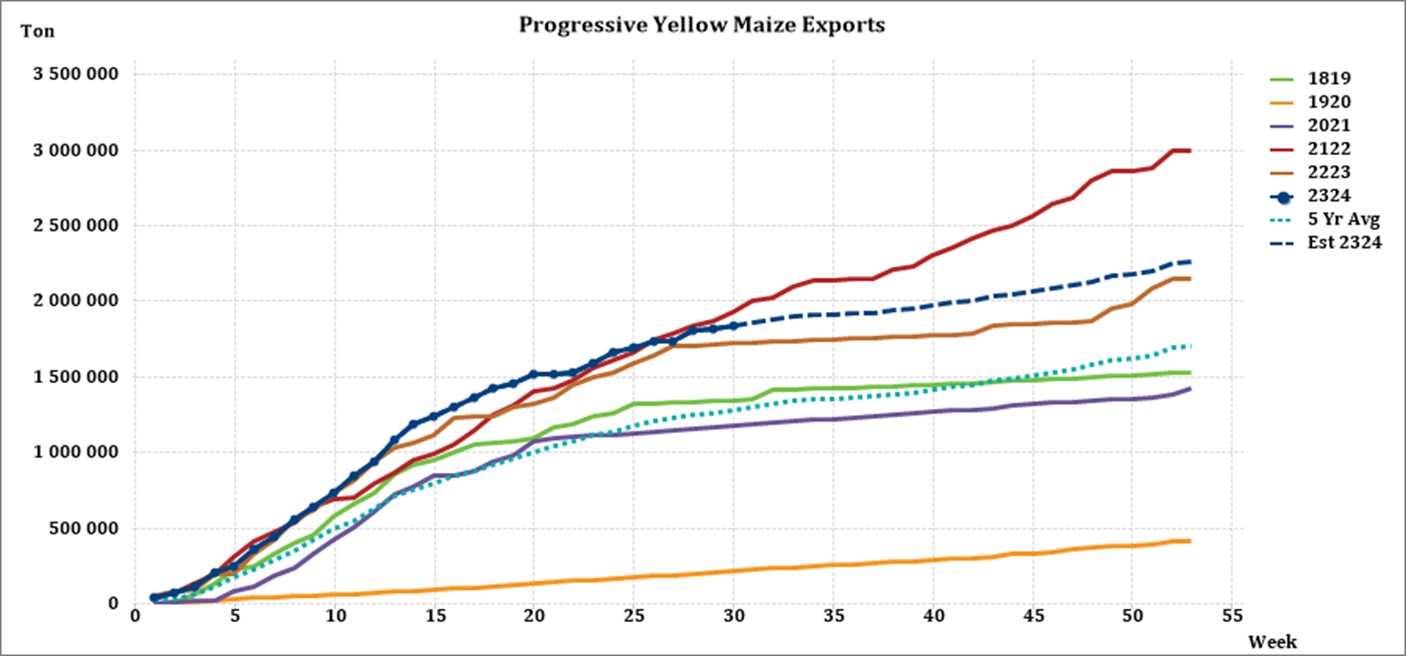
For the production season ending April 2024, 348 566 t of white maize and 1 522 115 t of yellow maize have been exported to date (week 30 of 52) as seen in the graphs below. In the 2021/2022 season, a record number of 2 991 129 t yellow maize was exported. This was mainly due to South Africa’s competitive export parity prices compared to the rest of the world.
Source: Sagis

As seen in the table above, the average white maize exports per week are currently 17 772 t. If theoretically, white maize exports remain at the current average per week then there would be 185 842 t less white maize exports than anticipated.
The average yellow maize exports per week are currently 61 153 t. If theoretically, yellow maize exports remain at the current average per week then there would be 944 979 t more yellow maize exports than anticipated.
Source: Sagis
• Parity prices
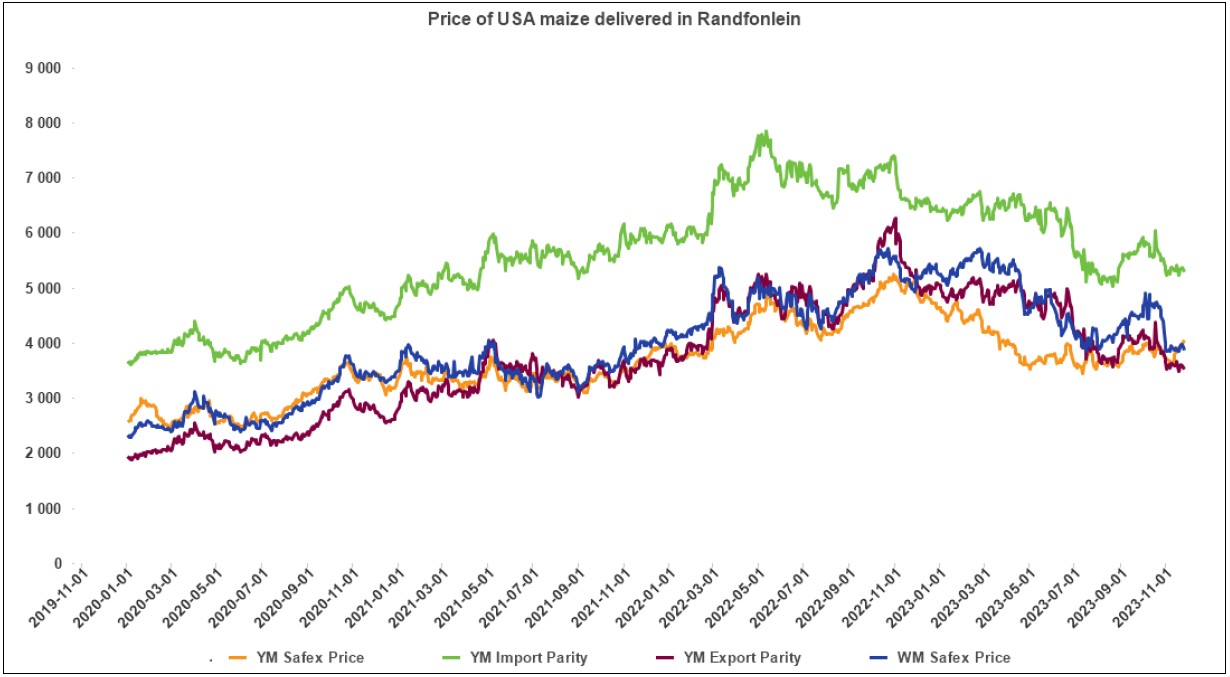
South Africa is a small producer compared to other countries and is thus a price taker (meaning that we cannot influence world prices). Because of this, our local prices are normally between import and export parity, which is illustrated in the figure below. An import parity price is defined as the price which a buyer will pay to buy the product on the world market. This price will include all the costs incurred to get the product delivered to the buyer’s destination.
An export parity price is defined as the price that a local seller could receive by selling his product on the world market e.g., excluding the export costs. The price which the seller obtains is based on the condition that he delivers the product at the nearest export point (usually a harbour) at his own expense.
The graph below reflects the Safex price, import parity and export parity of yellow maize as well as the Safex price of white maize. The import and export parity prices for white maize is not released by Grain SA for this period.
Source: Grain SA
• Producer deliveries – provincial
For the marketing year which is May to April (2023/2024), the Free State province dominates the white maize that is used for human consumption and gristing. North West consumed the second most white maize produced for human consumption for the three months August to October 2023.

Source: Sagis
The Cape Provinces used the most white maize for animal feed and industrial usage with North West using the second most.

Source: Sagis
The Free State processed the most yellow maize for consumption and gristing for the three month period August to October 2023 which is more than for the same period in the previous year. For the same period, Gauteng processed the most yellow maize for animal feed and industrial purposes.

Source: Sagis

Source: Sagis
Maize used for human consumption recorded notable increases on the back of a tougher economic climate and more recently a change in relative prices of staples.
Source: https://absaagritrends.co.za/grains-and-oilseeds/
• Exchange rate
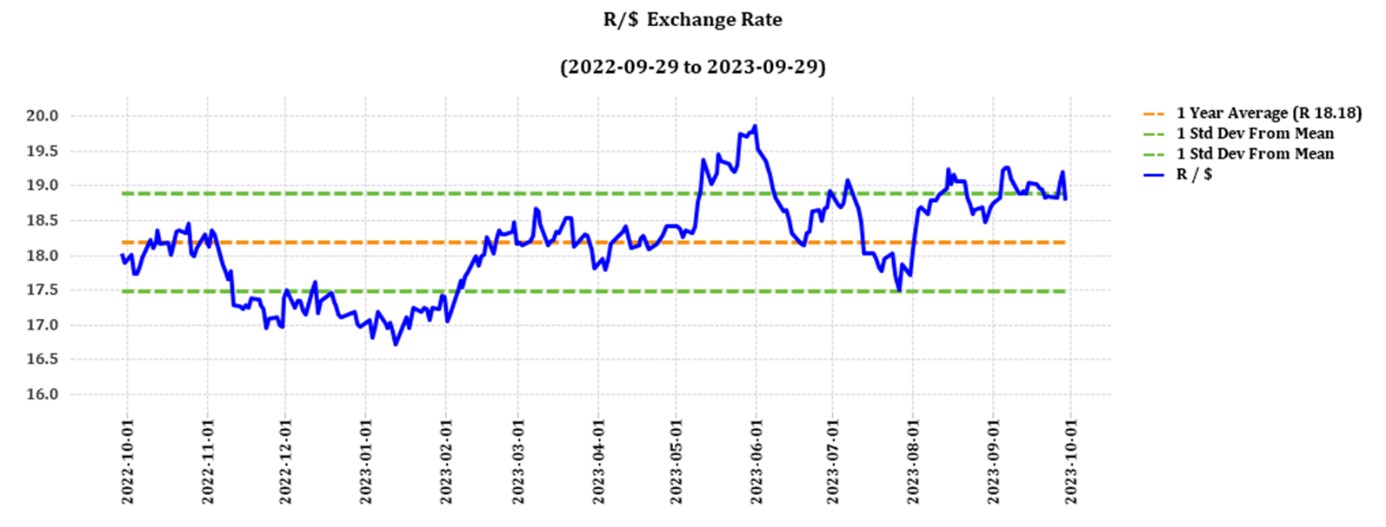
NWK Group is exposed to foreign exchange rate risk on various business areas, such as commodity prices and trade imports.
Source: Standard Bank, Corporate and Investment Banking & SARB
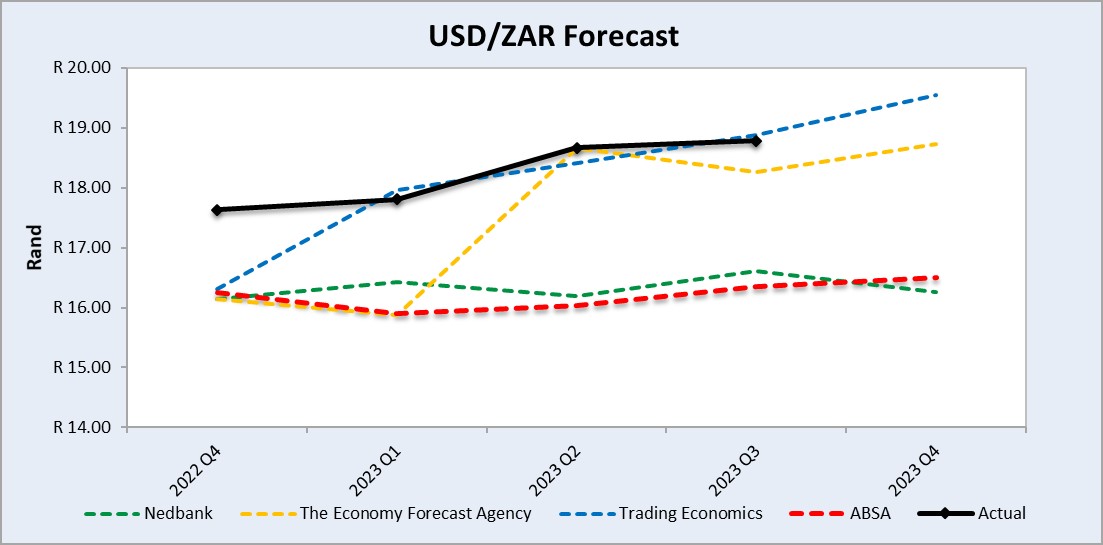
On a monthly average basis, the rand appreciated against the US dollar by 2,69% (0,51c) over the period October to November. The one-year average for rand/US dollar as on November 2023 is R18,45. Moreover, the average rand/US dollar exchange rate for November was R18,54 compared to R19,05 in October.
Exchange rate forecast:
Source: Nedbank CIB; Absa; The Economic Forecast Agency; Trading Economics
The graph above shows the actual USD/ZAR for 2022 Quarter 4 (Q4) to 2023 Quarter 4 (Q4) against the forecasted figures.
• Interest rate risk
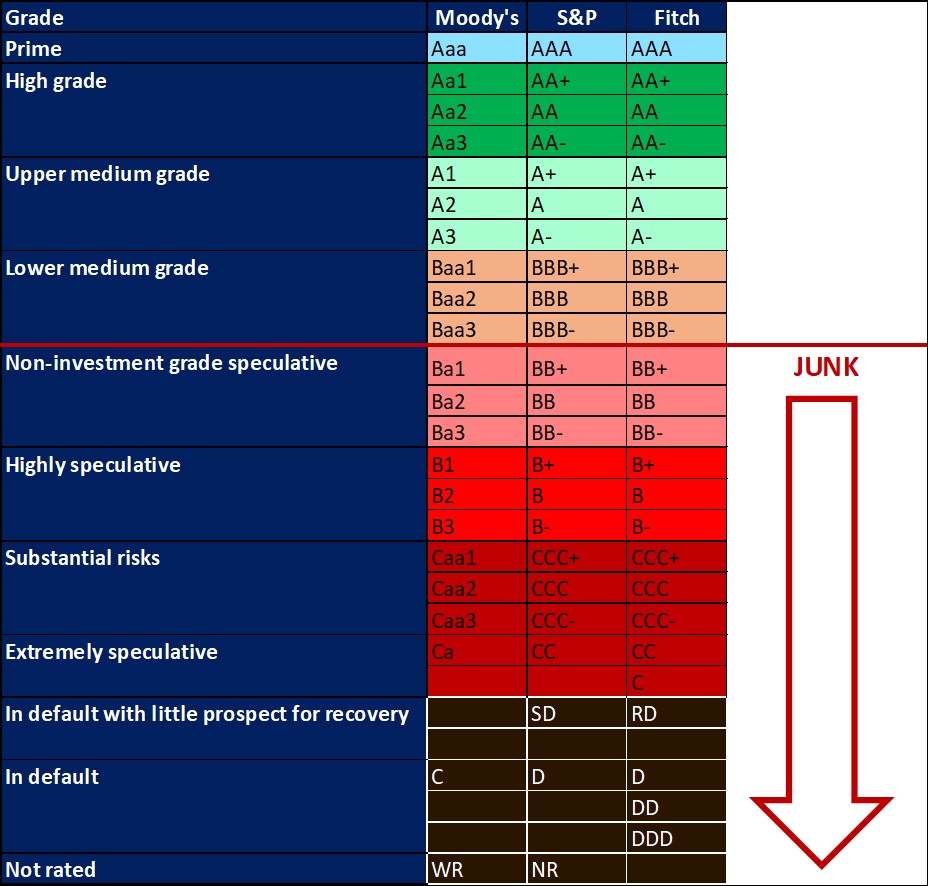
On 27 March 2020, Moody’s downgraded South Africa’s sovereign credit rating to sub-investment grade and placed a negative outlook on the rating. The key drivers for this downgrade include weak economic growth, continuous deterioration in fiscal strength, and slow progress on structural economic reforms. It is now the first time in post-apartheid South Africa that all major rating agencies, i.e., Moody’s, Fitch, and S&P, have South Africa’s credit ratings in sub-investment grade territory. More than a year later and our Moody’s rating remains the same.
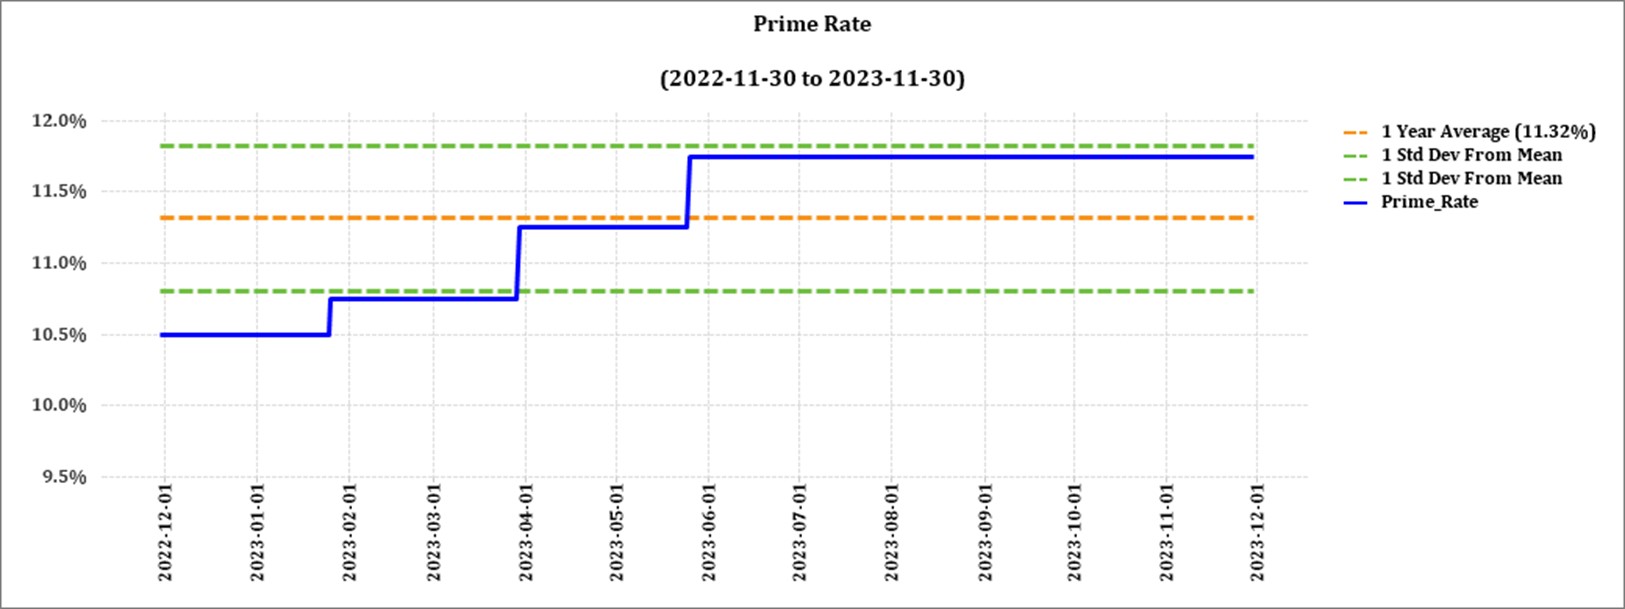
During the previous Monetary Policy Committee (MPC) meeting held on 23 November the committee decided that interest rates will remain unchanged. The repo rate is currently 8,25% and the prime rate is 11,75%. The South African Reserve Bank made several interest rates cuts to bring relief to the economy after Covid-19, but since November 2021 borrowing costs rose again by a cumulative 475 bps.
Interest rate movement:
- 22 September 2022: 9,75%
- 24 November 2022: 10,50%
- 26 January 2023: 10,75%
- 30 March 2023: 11,25%
- 25 May 2023: 11,75%
- 20 July 2023: 11,75%
- 21 September 2023: 11,75%
- 23 November: 11,75%

Source: Nedbank CIB; Trading Economics
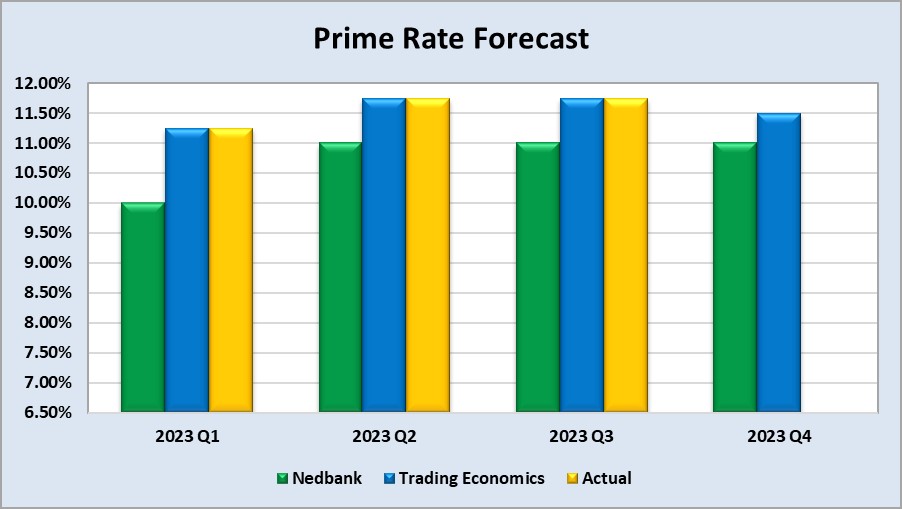
The following graph shows the prime rate forecast for 2023 Quarter 1 to 2023 Quarter 4. Both Q1 and Q2 experienced higher interest rates than anticipated by Nedbank.
Source: Nedbank CIB; Trading Economics.
As the inflation rate is a driver for increases and decreases in interest rates the current rate and forecast have to be assessed to foresee further increases in the interest rate.
Current
South Africa’s annual inflation rate accelerated for the third successive month to 5,9% in October 2023, up from 5,4% in September and well above market forecasts of 5,5%, verging on the upper limit of the Reserve Bank’s 3% to 6% inflation target range. Main upward pressure came from prices of food and non-alcoholic beverages (+8,7%); transportation (+7,4%); health (+6,4%) and restaurants and hotels (+6,3%). On a monthly basis, consumer prices rose by 0,9% surpassing market estimates.
Source: Statistics South Africa
Inflation rate forecast
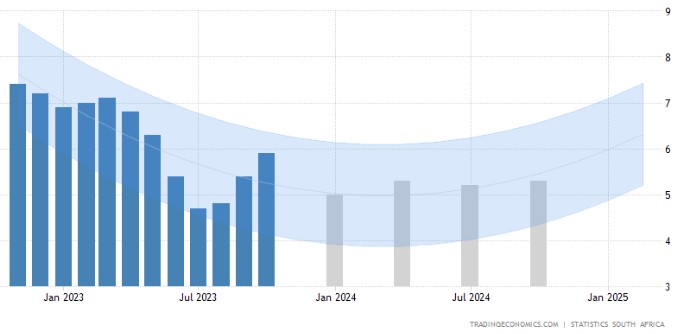
According to Trading Economics’ global macro models and analysts’ expectations the inflation rate in South Africa is expected to be 5% by the end of this quarter, according to Trading Economics global macro models and analysts’ expectations. In the long-term, the South Africa inflation rate is projected to trend around 5,1% in 2024 and 4,5% in 2025, according to their econometric models.
• Highlights in the agrochemical sector
Between 30% and 50% of a grain and oilseed producer’s existing input costs are spent on fertiliser. International fertiliser prices continue to decrease.
According to Chief Economist at Agbiz, Wandile Sihlobo, the 2023/2024 summer crop production season is starting this month, and the farmers’ focus is on input costs. Although various input cost prices, such as fertiliser and agrochemicals, have softened in recent months, the current price levels are still well above long-term levels, thus adding pressure on farmers’ finances in an environment where commodity prices have declined somewhat.
A resilient global market has reacted to drive down the cost of fertilizer from record highs reached when Russia invaded Ukraine in February 2022. Fertilizer prices have since fallen (as of September 2023) by over 40%.
Sources:
https://sagrainmag.co.za/2023/04/13/kunsmispryse-se-neus-wys-effens-afwaarts/
https://wandilesihlobo.com/2023/10/09/sa-agricultural-machinery-sales-continued-to-slow-in-september-2023/
https://farmersforum.com/good-news-fertilizer-prices-down-40-per-cent/
Herbicides
The following products are the main products regarding herbicides that may have an impact on input costs for producers.
- Glyphosate (95%)
- Acetochlor (92%)
- Atrazine (97%)
- Metolachlor (97%)
- Trifluralin (95%)
The following comparison is from the November 2023 Grain SA report which reports the previous month’s prices.

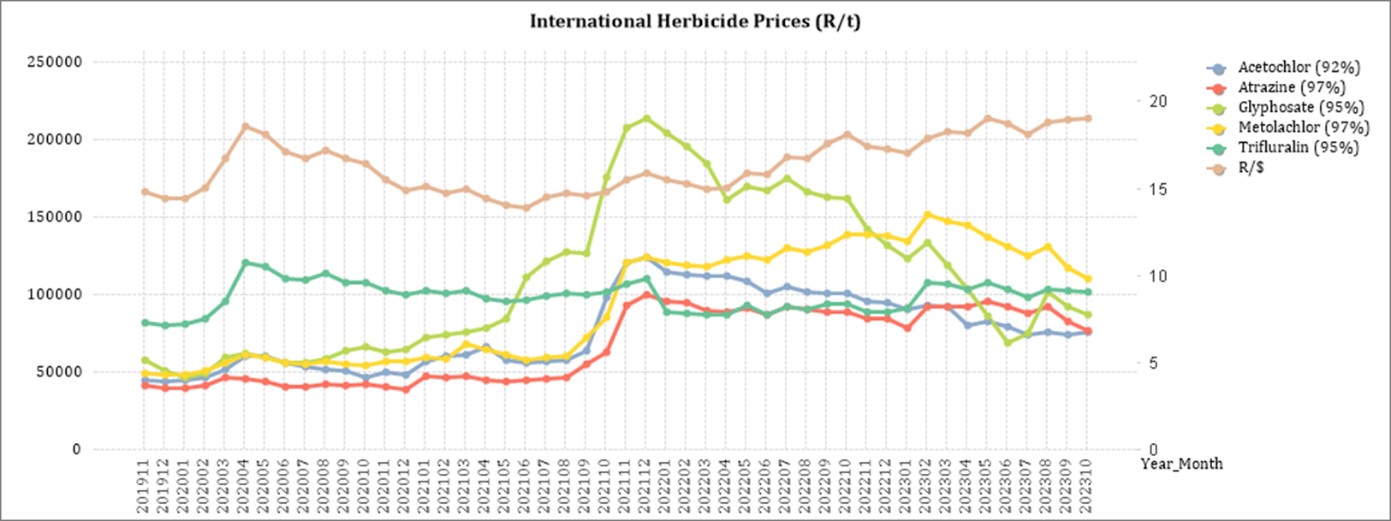
In comparison with the previous year’s prices, four of the five main products experienced a decrease in prices. Glyphosate had the biggest decrease with 46,4%.

For the two months compared four of the five products experienced a price decrease. Atrazine had the highest decrease of 7,39%.
The graph below shows the international herbicides prices (R/t) per product from November 2019 to October 2023.
Insecticides
The following products are the main products regarding insecticides that may have an impact on input costs for producers.
Imidacloprid (95%)
Lambda-cyhalothrin (95%)
Carbofuran (99%)
Deltamethrin (98%)
Acetamiprid (95%)
Chlorpyrifos (95%)
Cypermethrin (94%)
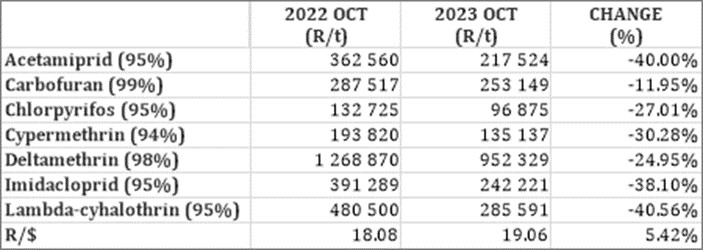
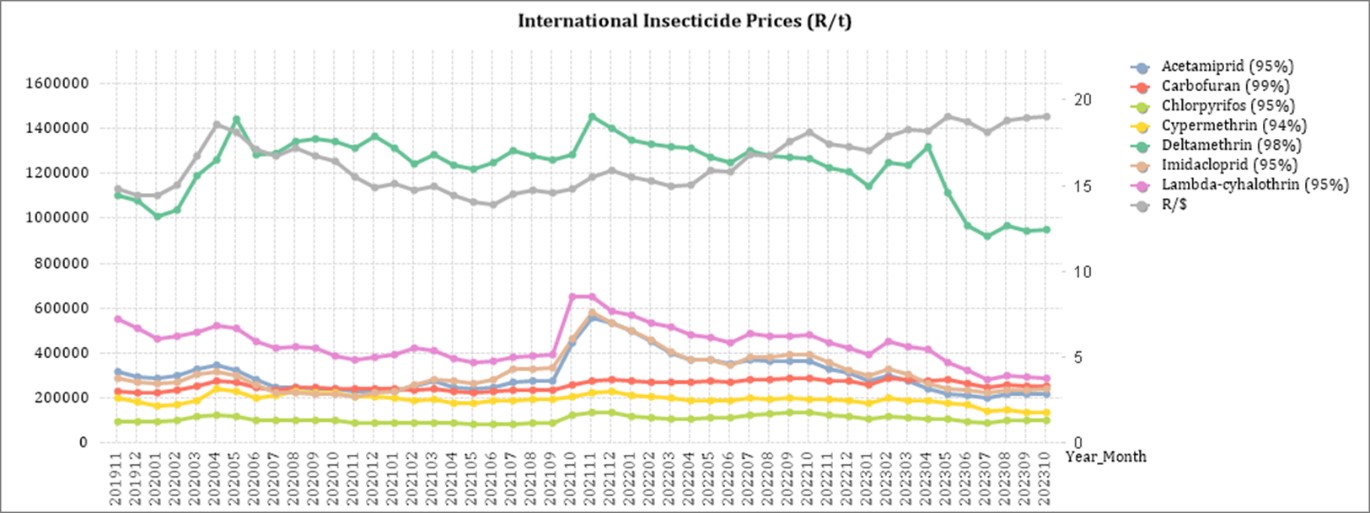
In comparison with the previous year’s prices, all of the products experienced a price decrease once again. The largest decrease was Lambda-cyhalothrin with 40,56% and Acetamiprid with 40%.
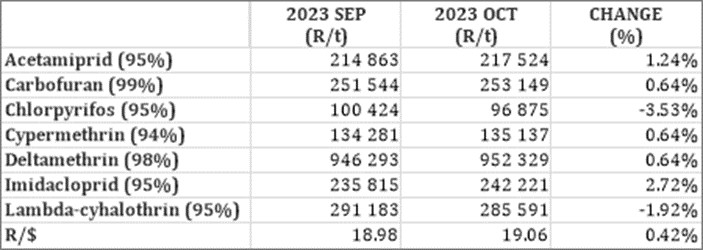
Two of the seven products experienced a price decrease on a month-to-month basis. The largest decrease was for Chlorpyrifos with 3,53%.
The graph below shows the international insecticide prices (R/t) per product from November 2019 to October 2023.
Fertiliser
The following fertiliser products are being analysed:
- Ammonia (Middle East)
- Urea (46%) (Eastern Europe)
- DAP (USA Gulf)
- KCL (CIS)

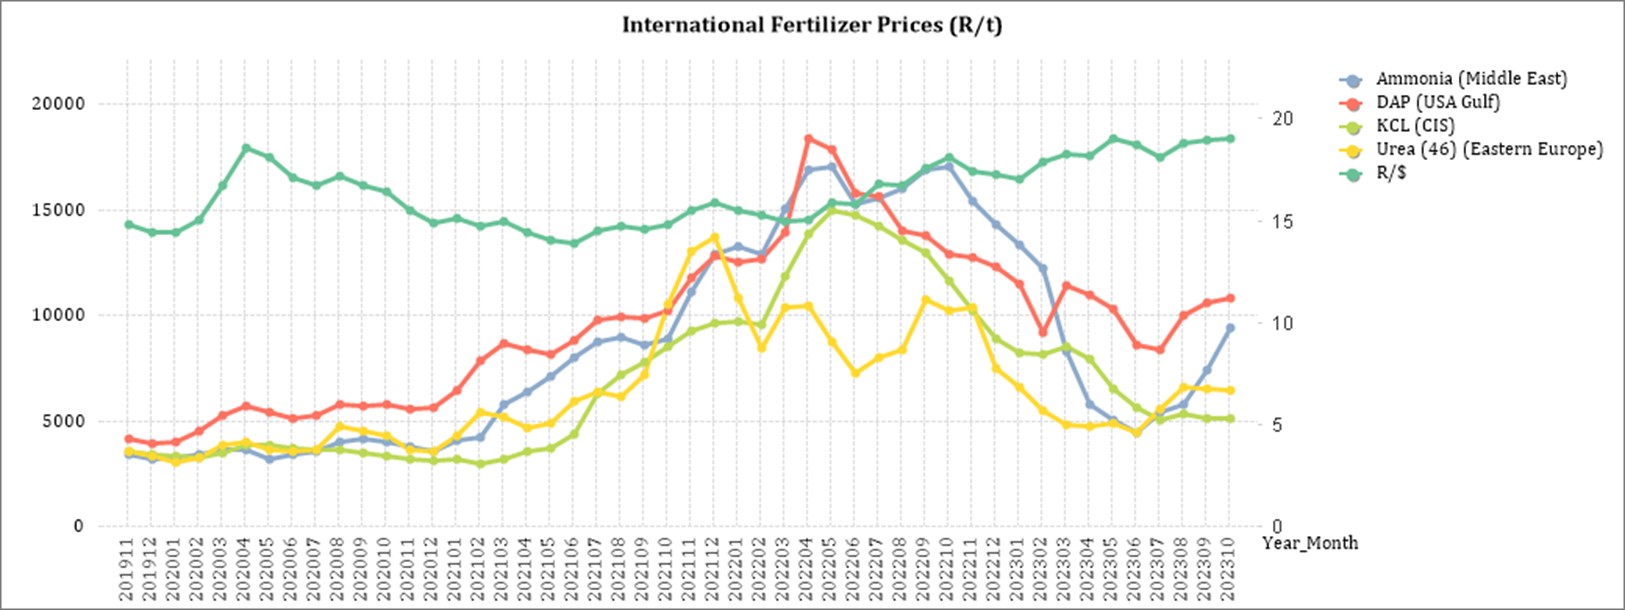
As seen in the table above all of the main fertiliser products decreased on a year-on-year basis once again. The biggest decrease, based on average international prices (R/t), was KCL (CIS) (56,24%) followed by ammonia (44,58%).

For the two months compared two the products experienced a price decrease compared to the previous months increase. Ammonia, however, experienced a 26,72% increase.
The graph below shows the international fertiliser prices (R/t) per product from November 2019 to October 2023.
Sources: Grain SA – https://www.ft.com/content/4d746aa5-29e3-4796-b9e6-0b64c6865389
Urea: The market appears to be increasingly oversupplied. The Chinese are expected to target the Indian tender, and this will ensure that we see prices pushed lower in the next week or so. Urea prices in Brazil fell $25/t due to lower demand. Weather conditions in Brazil have not been ideal and there are concerns that urea top-dressing demand could be lower too.
Ammonia: Prices were steady early in October as buyers kept a close watch on the falling urea prices. Ammonium nitrate prices were also unmoved. Amsul sales are looking solid but there is sufficient supply such that buyers can negotiate hard on price. Amsul granular prices are below $200/t ex-China and crystalline product is $25/t cheaper.
Phosphates: Phosphate supply seems to be more severe than the weak demand, supporting prices. MAP availability is also tight driven by Southern Hemisphere buying. Local MAP shortages continue to bite with local importers buying whatever they can and local prices are increasing fast. The ongoing wait for the announcement of the revised Indian Nutrient Based Subsidy scheme is keeping DAP prices stuck.
Potash: The EU potash price is the highest in the world at $400/t. Most global Potash prices were unchanged in October although poor demand and high potash stocks in Brazil saw the low end of the price spread falling by $5/t.
Source: https://www.grainsa.co.za/upload/report_files/Chemical-and-Fertilizer-Report-Nov-2023.pdf
FUTURE PRICES
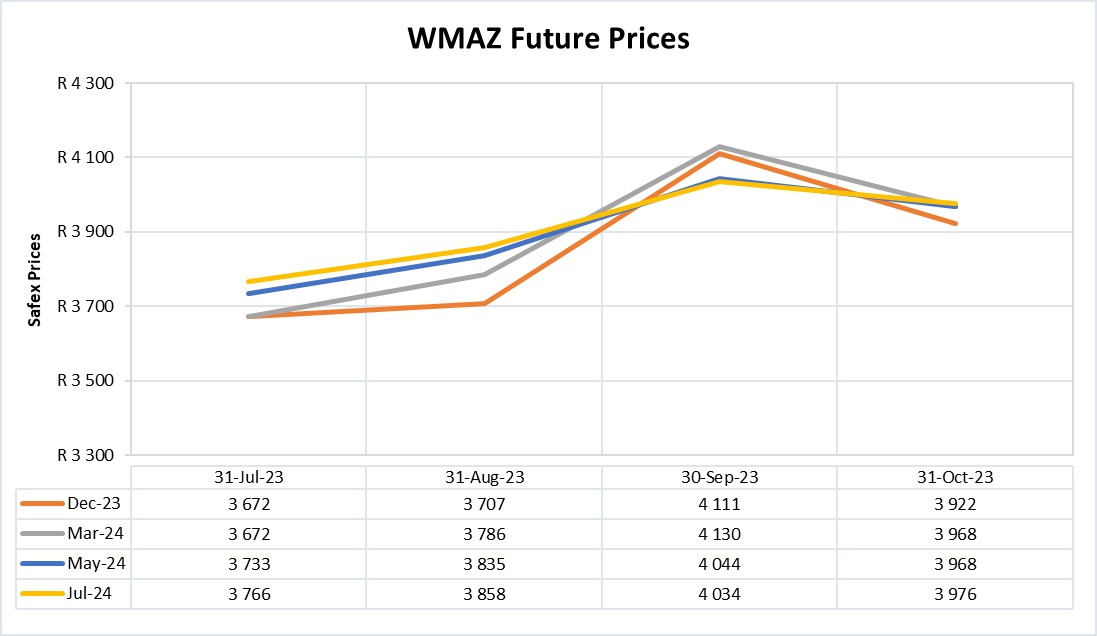
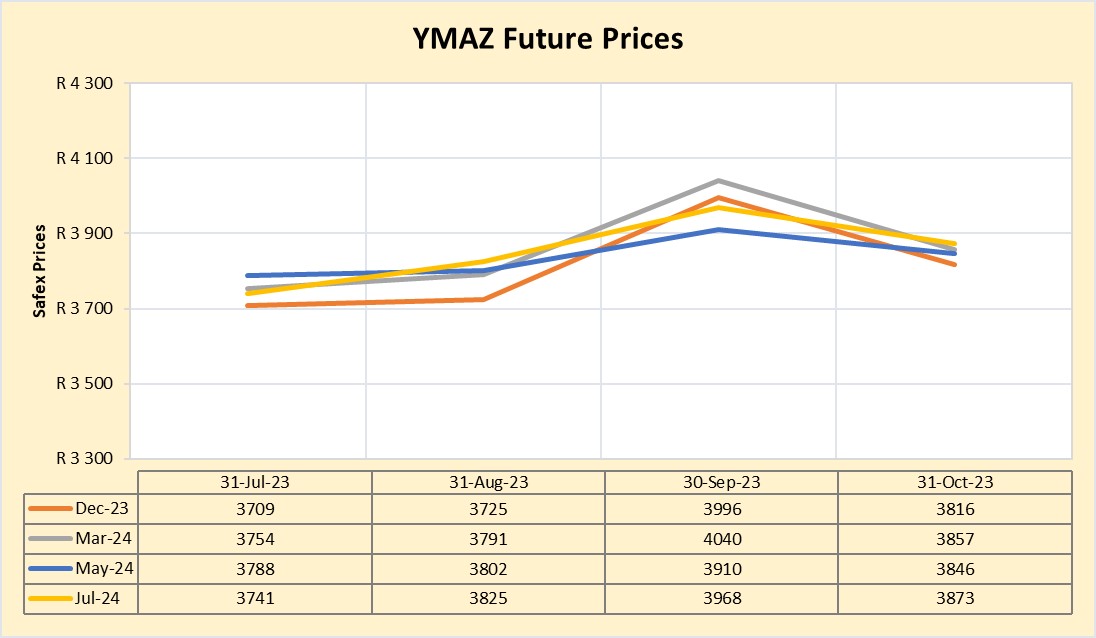
The graphs below illustrate the market sentiment for maize, in the form of future contracts, for the upcoming contract months. The market sentiment is the expectation of supply and demand fundamentals relating to white and yellow maize in South Africa.
Source: Sagis/JSE
Source: Sagis/JSE
The actual global price for corn was 0,94% higher that estimated. Prices are expected to remain more or less the same and increase as the season continues. South Africa had a good harvest this year, but high demand in Africa can especially support white maize prices.
Due to the current ENSO phenomenon, prices are expected to move away from export parity in 2024. The Absa agri trends report predict that maize prices will bottom out in the second half of 2024 and global prices will recover into 2025. A relatively strong 2024 production season in the US is expected to limit drastic global price growth.
Sources:
J Coertze: Grain Trader: Grain Trading
https://absaagritrends.co.za/wp-content/uploads/2023/09/Absa-AgriTrends-2023-Spring.pdf?utm_source=website&utm_medium=banner&utm_campaign=Agritrends
Fraud risk
FRAUD AWARENESS
In a survey conducted by Aura respondents said they knew they should change their behaviours to reduce their risk of cybercrime, but most have not. Thus, the bottom line is that fraud prevention starts with you. Following is three fraud prevention tips:
- Never send PINs, credit card numbers, passwords, or personal/financial information in a text or email: The service providers are not secure or well-encrypted and your information can be intercepted.
- Enrol in push notifications for mobile banking transactions: You will receive a notification when transactions are made on your account. This will allow you to dispute the scam as soon as possible potentially preventing irrecoverable damage.
- Review your credit report annually: You are entitled to one free credit report from each of the three major credit bureaus per year at www.annualcreditreport.com. Look for suspicious credit inquiries, loans you did not take out or unauthorised accounts opened in your name.


