The NWK Limited external factors report provides an overview of the main external factors that NWK and its clients are exposed to at a specific point in time. This report opts to aid in a timely basis to foresee external market and other factors that may have an impact on any business and clients. The main focus of this document is to have a closer look at external factors that can affect any business and our customers.
Executive summary
External factors that can affect any business and its customers include various economic factors. This report will focus on monthly or quarterly changes of these economic factors.
The inflation rate decreased to 3,8% in September 2024, the lowest in three years. Retail trade increased to 3,2% in August 2024. The unemployment rate rose to 33,5% in the second quarter of 2024. The GDP growth for the second quarter grew with 0,4%, up from a revised flat reading in the previous quarter. The Policy Uncertainty Index although still in negative territory, eased substantially to 53,5 in Q3 2024 from 68,3 in Q2 2024.
An external factor that is of great concern to any agricultural business is the weather and climate outlook. These factors include long term climate risks, such as drought and heat stress, as well as the current status of the El Niño and La Niña climate phenomenon. The El Niño Southern Oscillation (ENSO) is currently neutral however, a weak La Niña is forecasted during November to January and December to February.
The National Agricultural Marketing Council (NAMC) projected the ending stock for 30 April 2025 of white and yellow maize to be less than the 2023/2024 season. The projected soybean ending stock for February 2025 is 144 327 t, that is less than the final for the 2023/2024 season of 320 637 t. The projected sunflower ending stock for February 2025 is 48 494 t, that is less than the final for the 2023/2024 season of 127 144 t.
During the previous Monetary Policy Committee (MPC) meeting held on 19 September the committee once again decided that interest rates will remain unchanged. The repo rate is currently 8,25% and the prime rate 11,50%.
Business climate: Key risk drivers
A few highlights regarding certain risk drivers are mentioned below.
According to Trading Economics, South Africa’s annual inflation rate decreased to 3,8% in September form 4,4% in August 2024. The inflation rate is expected to be 4,6% by the end of this quarter. It is now falling just below the central bank’s preferred midpoint target of 4,5%
Brent crude oil monthly average prices decreased by $6.41 per barrel from August to September. Brent crude oil futures fell below $76 per barrel on 23 October, giving back gains from the previous session, weighed down by a larger-than-expected build in US stockpiles. API data showed that US crude oil inventories rose by 1,6 million barrels last week, more than doubling the anticipated 0,7 million barrel increase.
South Africa’s retail trade climbed with 3,2% over a year ago in August 2024, following a downwardly revised 1,7% the prior month. According to Statistics SA, South Africa’s unemployment rate rose slightly to 33,5% in Q2.
The GDP growth rate increased by 0,4% in the second quarter in 2024. Six of the ten industries experienced an increase. Finance, real estate and business service sector had the biggest positive influence (+1,3%).
The maize Safex prices for maize prices are expected to hover around the R4 000/t mark for yellow maize and above the R5 000/t mark for white maize. Expected weather improvements on the back of the high probabilities of the La Niña weather during the 2024/2025 production season are expected to limit excessive gains. Local production is expected to meet the local demand and some regional export demand.
Adverse weather patterns can reduce yields and also affect the Safex price (high regional demand poses an upside price risk). The El Niño–Southern Oscillation (ENSO) is currently in a neutral phase and is expected to remain neutral until early spring. The Bureau’s ENSO outlook is at La Niña Watch due to early signs that an event may form in the Pacific Ocean later in 2024. From March 2021 to September 2024 the actual sunspot numbers were higher than the predicted values.
The iron ore prices decreased by $7,31 per metric ton on a monthly average from August to September. Prices of iron ore cargoes with a 62% iron content fell to below the $105 threshold in September, amid lingering uncertainties about Chinese demand despite Beijing efforts to revive economic growth with stimulus measures. China recently rolled out a slate of economic support measures including reductions to key lending rates, although the impact of the policies have yet to be felt by the economy and markets. Persistent concerns about the country’s beleaguered property sector also weighed on the demand outlook for steel and other construction materials.
The Policy Uncertainty Index although still in negative territory, eased substantially to 53,5 from 68,3 in 2Q 2024. In addition to the well-known global risks and uncertainties the 2024 election outcome also weighed on investors and the markets. The PUI is the net outcome of positive and negative factors influencing the calibration of policy uncertainty over the relevant period. It is seen to have important implications for business confidence and the investment climate in the country.
Sources
https://tradingeconomics.com/south-africa/inflation-cpi
https://tradingeconomics.com/commodity/brent-crude-oil
https://tradingeconomics.com/south-africa/unemployment-rate
https://www.statssa.gov.za/?page_id=737&id=1
https://tradingeconomics.com/south-africa/gdp-growth
https://agrink.co.za/downloads/ABSA%20Agri%20Trends%20Grains%20and%20Veggies.pdf
https://tradingeconomics.com/commodity/iron-orePUI_2024Q3.pdf
Agribusiness Confidence Index (ACI), Q3 2024
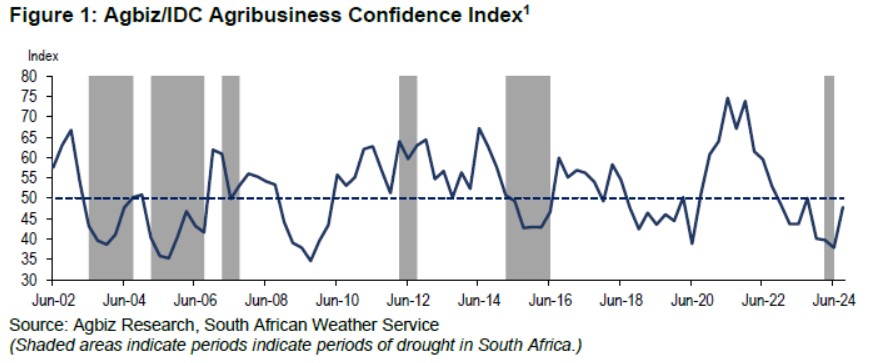
The Agricultural Business Chamber (Agbiz) conducts a quarterly survey to compile the Agribusiness Confidence Index (ACI), reflecting the views of at least 25 decision-makers in the agricultural sector. Released on June 24, 2024, the latest index evaluates ten critical factors impacting agribusiness: turnover, net operating income, market share, employment, capital investment, export volumes, economic growth, general agricultural conditions, debtor provisions for bad debt, and financing costs.
After a sharp drop in Q2 2024, reaching its lowest point since the 2009 global financial crisis, the Agbiz/IDC Agribusiness Confidence Index (ACI) rebounded by 10 points to 48 in Q3. The earlier extreme pessimism was partly driven by uncertainty around the elections, but the formation of the Government of National Unity (GNU) seems to have eased these concerns. Focus has now shifted back to core agricultural issues.
While the improvement in the ACI is a positive sign, it’s still below the neutral mark of 50, indicating that South African agribusinesses remain cautious about current business conditions. Ongoing issues such as the 2023/2024 summer crop drought, deteriorating road infrastructure, poor municipal services, recurring animal diseases, and rising geopolitical tensions are major concerns for the sector.
Additionally, while organised agriculture continues to foster a productive relationship with Transnet, there’s still room for improving port efficiency. This survey was conducted in the first week of September and covered businesses across all agricultural subsectors in South Africa.
DISCUSSION OF THE SUBINDICES
The ACI is made up of ten subindices, six of which improved in Q3 2024, while the others saw slight declines. Here is the detailed view of the subindices:
- The turnover subindex rose by 19 points to 50, driven mainly by optimism in the winter crop and financial services sectors. However, businesses in red meat and summer grains remain somewhat pessimistic due to the mid-summer drought and ongoing animal diseases. The machinery supply industry’s outlook was largely unchanged. Similarly, the net operating income subindex increased by 12 points to 46.
- The employment subindex improved by 8 points from Q2 2024 to 64, which was unexpected considering that agricultural employment had dropped by 5% quarter-on-quarter to 896 000 in Q2, as businesses faced financial strain from the drought and animal diseases. The increased optimism regarding jobs may be tied to anticipated improvements in production conditions for the upcoming season.
- The capital investments subindex increased by 11 points to 57, possibly linked to the anticipation of lower interest rates, which could enable farmers to access more affordable capital. However, ongoing weak tractor and combine harvester sales suggest it’s unclear whether this sentiment will translate into real investment changes.
- The general economic conditions subindex gained 4 points, rising to 43. The slight improvement could be attributed to a reduction in load-shedding and aligns with more optimistic GDP forecasts from various market analysts.
- The general agricultural conditions subindex rose by 4 points to 50 in Q3 2024, reflecting optimism driven by the anticipated La Niña weather pattern for the 2024/2025 summer season, beginning in October. This weather event is expected to bring essential rainfall for summer crops and other agricultural activities. Additionally, the ongoing winter crop season is benefiting from relatively favourable production conditions.
Declining subindices:
- The volume of exports subindex dropped by 7 points to 14, indicating concerns over lower export volumes due to a challenging summer season drought. Agricultural exports were already down by 0,1% in Q2 2024 compared to 2023. The export figure for Q3 is expected to show a further decline.
- The market share subindex decreased slightly by 1 point to 64, though most respondents maintained an overall neutral stance.
- The subindices for debtor provision for bad debt and financing costs are assessed differently from the other indices. A decrease is seen as positive, while an increase indicates rising financial pressure. In Q3 2024, the debtor provision for bad debt rose by 19 points to 50, a negative sign that suggests tough financial conditions for some farming businesses, likely due to the recent drought and animal disease outbreaks. Additionally, the financing costs subindex increased by 23 points to 46, which is unexpected given the anticipated easing of interest rates.
CONCLUDING REMARKS
The Q3 2024 ACI results show a modest improvement in sentiment within the sector. However, the long-standing challenges that existed before the elections remain a key concern. ‘Although we are moving towards a promising summer season, and that may bring increased positive activity in the South African farming sector, the long-term growth prospects of the sector, which would also deliver jobs, hinges on the GNU’s ability to resolve the challenges of the network industries, improve the functioning of the municipalities and open new export markets,’ Wandile Sihlobo, chief economist of the Agricultural Business Chamber of South Africa (Agbiz), concluded.
Source: www.agbiz.co.za, Issued by: Wandile Sihlobo, Chief Economist (AgbizMarch 2024)
Fact of the month
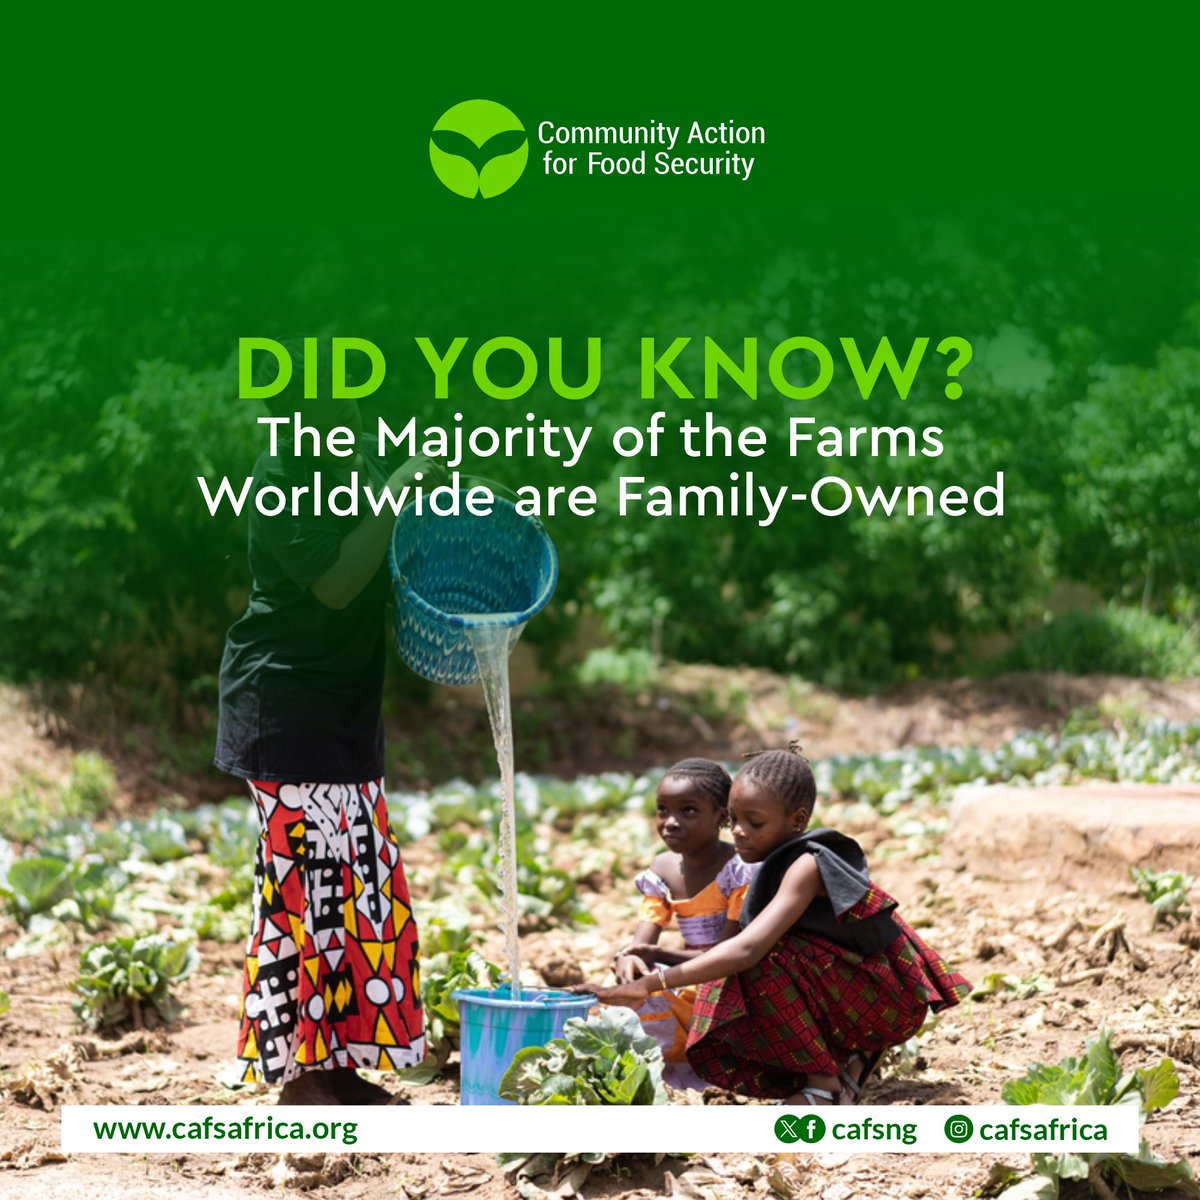
The Majority of the farms worldwide are family-owned: Approximately 56% of the total food production comes from family-owned farms. Small families run over 57 million farms across the world. These family-owned businesses vary from smallholdings to large farms where revolutionised farming practices are used.
Source: https://www.farmbrite.com/post/global-land-use-for-agriculture
Weather and climate
NATIONAL ASSESSMENT
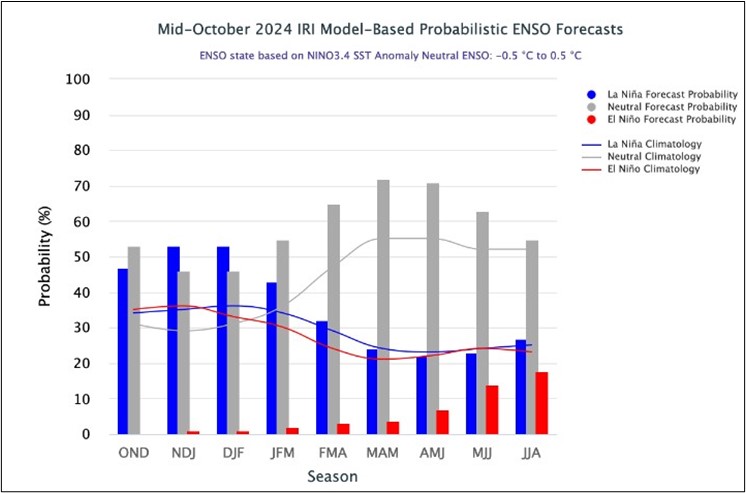
As of Mid-October 2024, the ENSO neutral conditions persist in the equatorial Pacific. Atmospheric indices, such as those related to pattens of surface pressure, cloud and trade winds, are broadly consistent with an ENSO-neutral state.
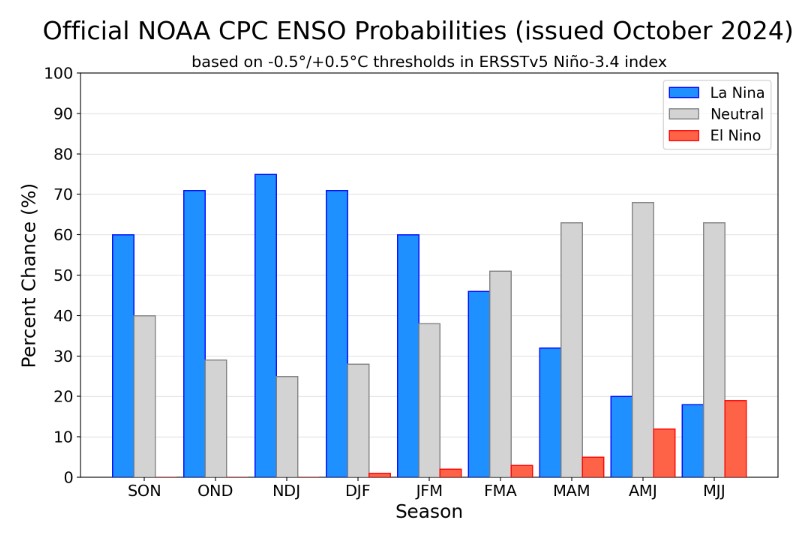
The Bureau’s ENSO outlook remains at La Niña Watch due to signs that an event may form in the Pacific Ocean later in 2024. A La Niña Watch does not guarantee La Niña development. The chance of a La Niña developing in the coming season has slightly decreased compared to previous outlooks. When La Niña Watch criteria have been met in the past, a La Niña event has subsequently developed around 50% of the time.
The most recent official CPC ENSO outlook (10 October, 2024) forecasted a 60% chance of a La Niña onset in September to November (SON); however, the IRI ENSO prediction plume forecasts a 53% chance for ENSO-neutral conditions for October to December 2024. While there is a noticeable difference both forecasts suggest a weak and short-lived La Niña with ENSO-neutral conditions to return during boreal (northern) spring 2025.
Source: https://iri.columbia.edu/our-expertise/climate/forecasts/enso/current/?enso_tab=enso-iri_plume
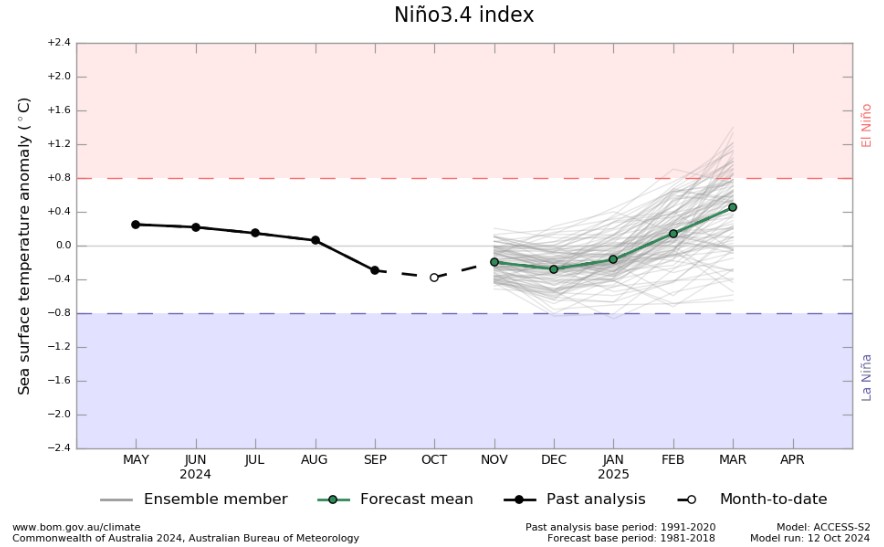
The Bureau of Meteorology’s model suggest SSTs are likely to remain within the ENSO-neutral range (-0,8 °C to +0,8 °C) throughout the forecast period to February 2025.

The graph below reflects the current neutral conditions and the ocean temperatures that are starting to get cooler. The graph supports the prediction of an ENSO-neutral state throughout the forecast period to March 2025.
http://www.bom.gov.au/climate/model-summary/#tabs=Bureau-model®ion=NINO34
The latest Climate Watch issued by the SA Weather Service (04 October 2024) predicts above-normal rainfall is forecasted for the central parts and the south-eastern coastal areas of the country during early and mid-summer seasons.
This above-normal rainfall forecast for these summer rainfall regions will likely have a positive impact on crop and livestock production. However, below normal rainfall is expected over most parts of the north-eastern areas of the country including Limpopo, Mpumalanga and the northern parts of KwaZulu-Natal.
Therefore, it is recommended that the relevant decision-makers advise farmers in these regions to implement soil and water conservation measures, proper water harvesting and storage techniques, establish effective drainage systems, and adopt other appropriate farming practices.
The critical period for rainfall for South Africa’s summer grains and oilseed is between October and the end of February the following year. This is a period between planting and pollination of the crop. The months after are essential, but the crop could still have decent yields even if there is less rain after the pollination.
Minimum and maximum temperatures are expected to be mostly above-normal countrywide for the forecast period.
Source: https://www.weathersa.co.za/Documents/SeasonalForecast/SCOLF202407_01082024095021.pdf
SUNSPOTS
Sunspots are darker, cooler areas on the surface of the sun that arise due to disturbances in the sun’s magnetic field. Every eleven years, the number of spots dotting the surface of the sun increases and decreases and forms the solar cycle.
Sources: https://www.sciencedirect.com/science/article/abs/pii/S136468262200116X#:~:text=It%20was%20observed%20that%20rainfall,an%20increasing%20effect%20on%20rainfall
https://www.space.com/solar-cycle-frequency-prediction-facts May 27,2022.
https://eos.org/articles/why-did-sunspots-disappear-for-70-years-nearby-star-holds-clues 10 June, 2022
According to science direct the rainfall rate is directly related to the sunspot number, but shows different characteristics during solar maximum years. Though a lag correlation exists between sunspot number and rainfall, sunspots have an increasing effect on rainfall. Studies show that the more sunspots are present the higher the rainfall and the less sunspots the lower the rainfall.
ENSO occurs at irregular intervals between three and seven years causing global climate system variation. Considering this event occurs periodically, it might be triggered by the eleven-year solar cycle as an energy source.
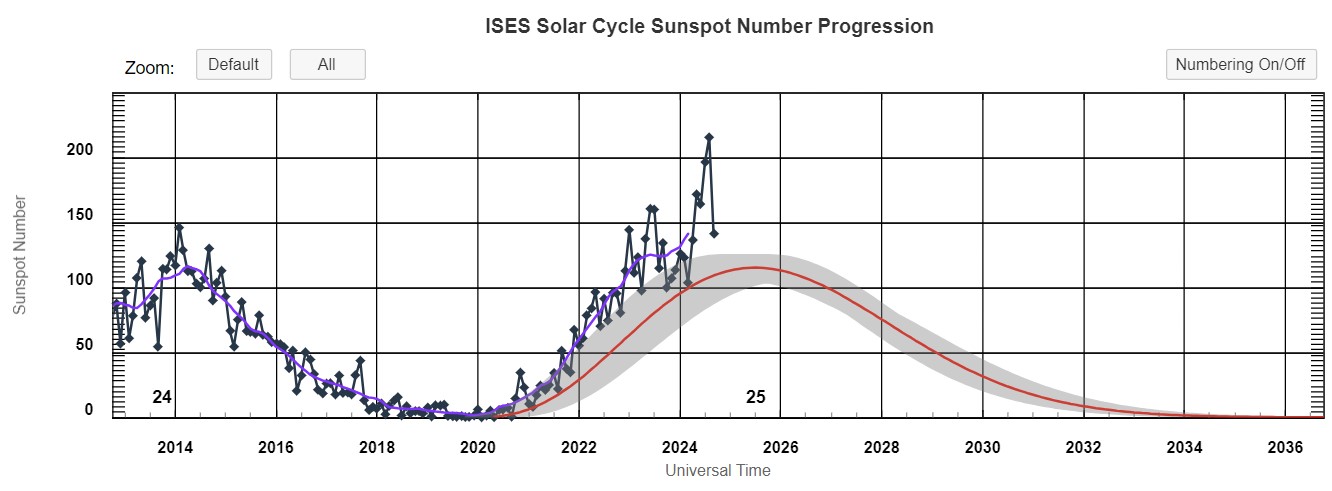
The graph below shows the eleven-year solar cycles since before the 2000s. As the graph is in an upward trajectory higher rainfall can be expected – La Niña. As the graph reaches its turning point and moves in a downward trajectory less rainfall is expected characteristic of an El Niño.
ENSO indicators are currently at neutral and a La Niña is expected to form during summer. Since October 2020 to September 2024 the actual sunspot numbers were higher than the predicted values. The monthly sunspot values for September 2024 were 141,4.
The conclusion can be made that the sunspots are not yet at their downward turning point. When the sunspots are in an increasing phase it means more rainfall and when in a decreasing phase it usually means less rainfall.
https://www.spaceweatherlive.com/en/solar-activity/solar-cycle.html
https://www.swpc.noaa.gov/products/solar-cycle-progression
South African agribusiness at a crossroads
NEW APPROACHES AND TECHNOLOGIES TO GROW FARM ENTERPRISES
Achieving higher agricultural output is essential, but it must be done without depleting resources or compromising sustainability. This is where the second green revolution becomes crucial. Unlike the first, this new agricultural revolution is science-based, driven by advanced technologies rather than traditional techniques. It emphasises innovation and encourages farmers to make proactive decisions based on real-time data, utilizing precision farming and other modern approaches.
PwC have identified four key strategies to help South African agricultural businesses expand their operations, boost food production, and maintain sustainability and operational efficiency:
- Creating a family business constitution to facilitate succession planning.
- Implementing end-to-end farm management: where dirt and data intersect.
- Collecting data at the farm level to help food companies with traceability.
- Impact measurement to help agribusiness tell their ESG story.
A FAMILY BUSINESS CONSTITUTION IS VITAL TO SUCCESSION PLANNING
Family-owned agribusinesses are the backbone of the South African farming sector. The most successful of these businesses manage to balance professional management and with responsible ownership while maintaining a harmonious family dynamic. In family-run businesses, relationships between family members – both those involved in the business and those who are not – can impact company management in ways that are unique compared to non-family businesses.
One of the key challenges in succession planning, which is often the most critical and complex decision for family business leaders. A solid succession plan starts with the professionalization of both the family and the business. This means formalizing procedures, governance structures, systems, knowledge, experience, values, and business relationships. A key element of this process in creating a family constitution.
END-TO-END FARM MANAGEMENT: WHERE DIRT AND DATA INTERSECT
Despite the advancements in farming systems over recent decades, it is still common to find South African farmers returning to older habits learned as children. The second green revolution demands a shift in approach. To make progress, the agricultural sector must fully embrace the digital era. As dirt and data intersect, digital tools will become essential in addressing some of the biggest challenges agribusiness will face in coming years.
End-to-end farming management is a comprehensive strategy that uses integrated technologies and systems to manage all aspects of farming operations. Its goal is to enhance efficiency, productivity, and sustainability throughout the entire farming process. This approach may involve managing finances, resources, and supply chains; improving operational efficiency; ensuring sustainability and compliance; collecting and integrating data; and fostering collaboration and communication with stakeholders.
TRACEABILITY: FARMERS MUST COLLECT DATA THAT FOOD COMPANIES NEED
Producers, food and beverages companies, and retailers are all focused on ensuring the security, safety, and quality of their food products. The ability to trace food and monitor its entire journey is not only a crucial element of effective food safety management but also presents a valuable opportunity. For food companies and their suppliers, traceability allows them to differentiate their products, offering greater control and visibility over the food supply chain, which can provide a competitive advantage.
For farmers, the scope of data collection is broad, and major food companies may require detailed information on production, harvesting, processing, transportation, storage, and sales. Currently, traceability practices in South African agriculture make use of technologies like barcoding, Radio Frequency Identification (RFID) tags, and blockchain to track agricultural products from the farm to the consumer.
IMPACT MEASUREMENT CAN HELP AGRIBUSINESS TELL THEIR ESG STORY
South African agribusinesses are under growing pressure from various stakeholders to evaluate and manage the impact they have on society. Measuring the economic, environmental, and broader societal impacts enhances credibility and strengthens an organisation’s value proposition to its diverse stakeholders.
Conducting an impact assessment using a Social Accounting Matrix (SAM) help companies to understand their direct, indirect and induced contributions to key economic indicators such as GDP, job creation, poverty reduction, tax revenue, social investment and emissions. In this constantly changing world, impact assessments go beyond being a mere necessity – the y are essential tools for building responsible, successful, and resilient agribusinesses. Without reliable and credible impact data, companies risk losing stakeholder trust and weakening their social license to operate.
Market risk
GRAIN MARKET ANALYSIS
• Ending stock – National
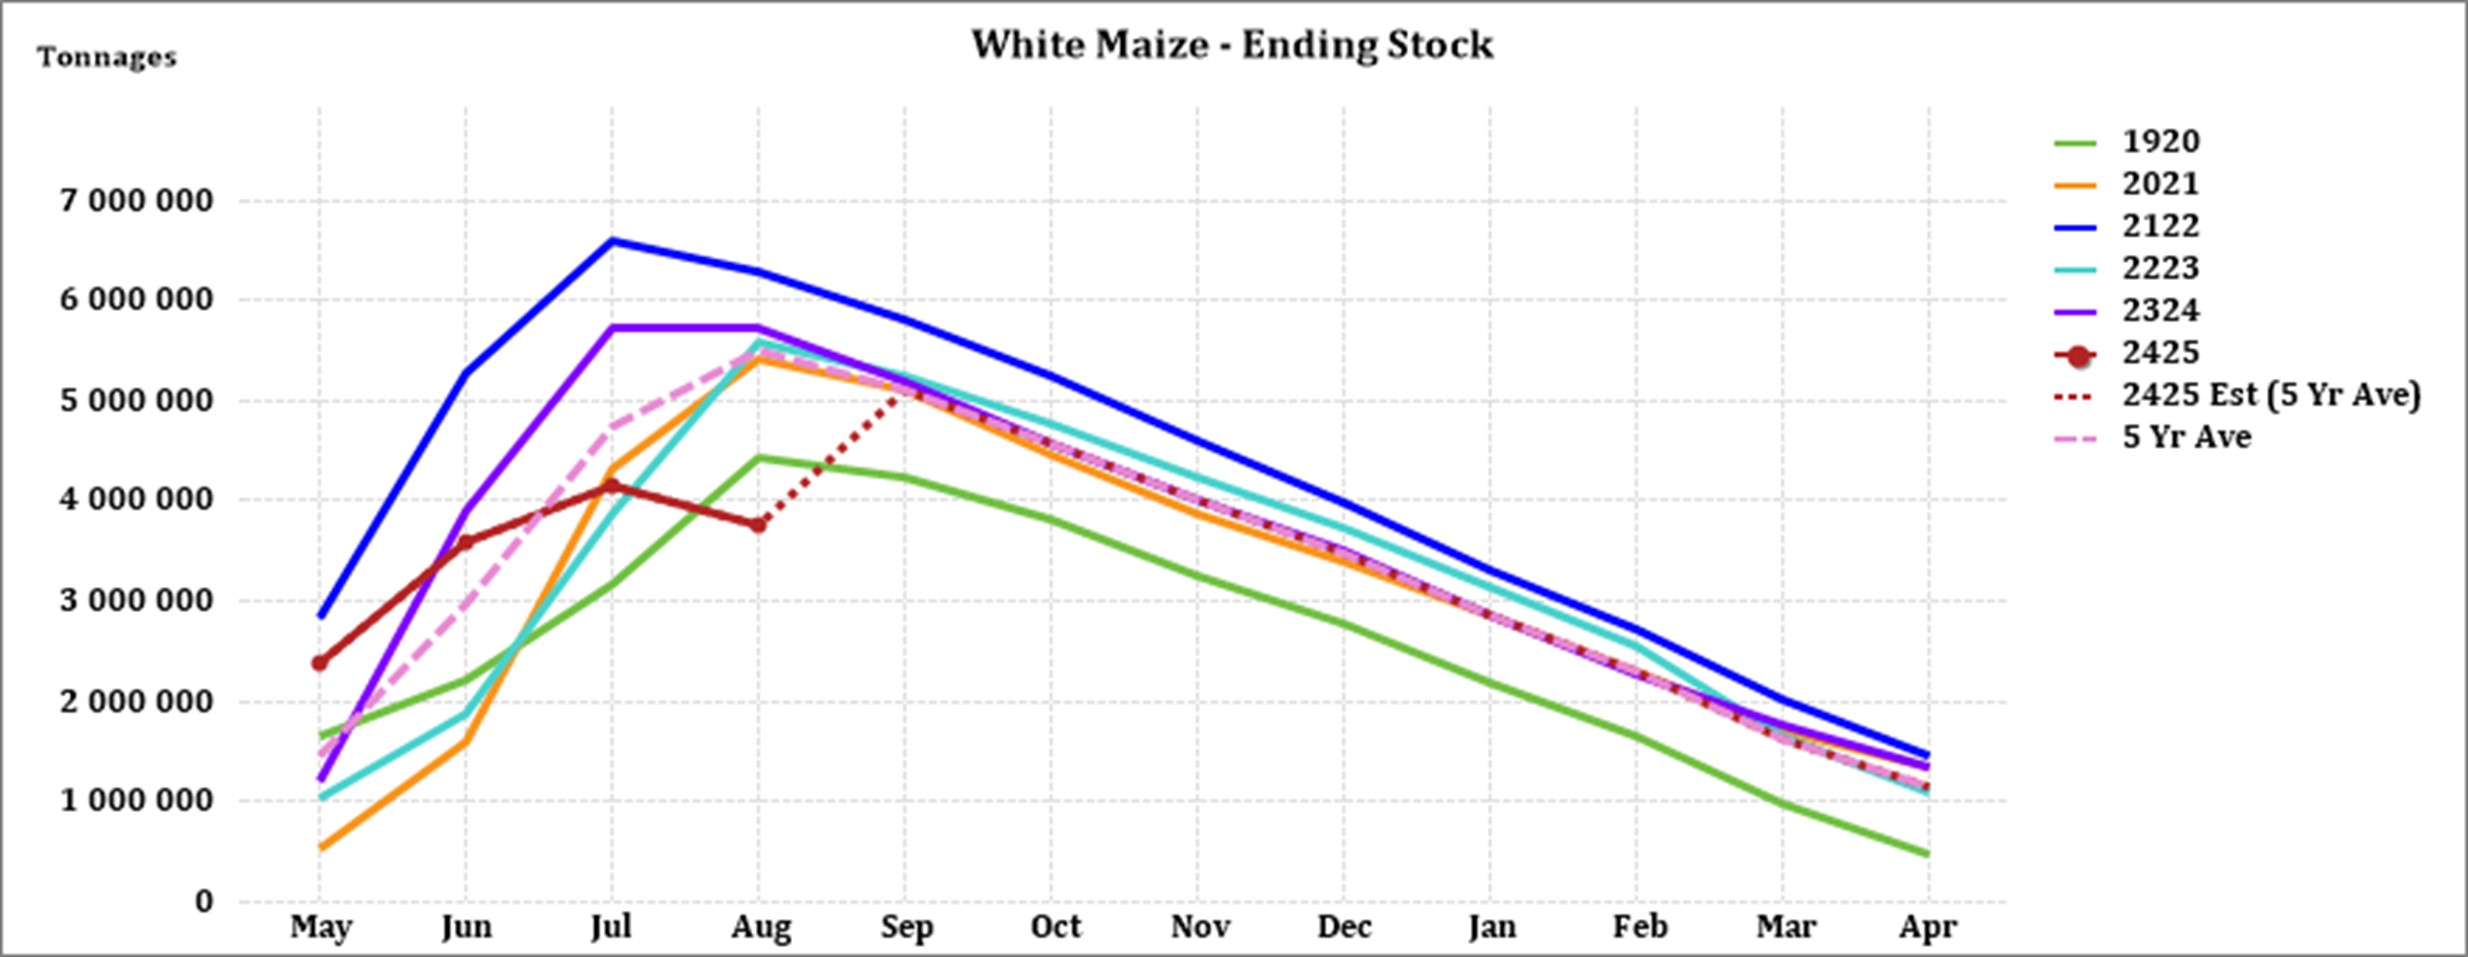
Ending stock data is gathered from the NAMC. The estimates are reassessed and reported by the Grain and Oilseeds supply and demand estimates committee. The following is the projected ending stock for April 2025 in tonnages for the 2024/2025 season:
- White maize => 366 634 t
- Yellow maize => 588 648 t
The following is a summary of September 2024 ending stock projections for the 2023/2024 season:
- Wheat => 760 959 t
The following is a summary of February 2025 projected ending stock for the 2024/2025 season:
- Sunflower => 48 494 t
- Soybeans => 144 327 t
- Sorghum => 71 890 t
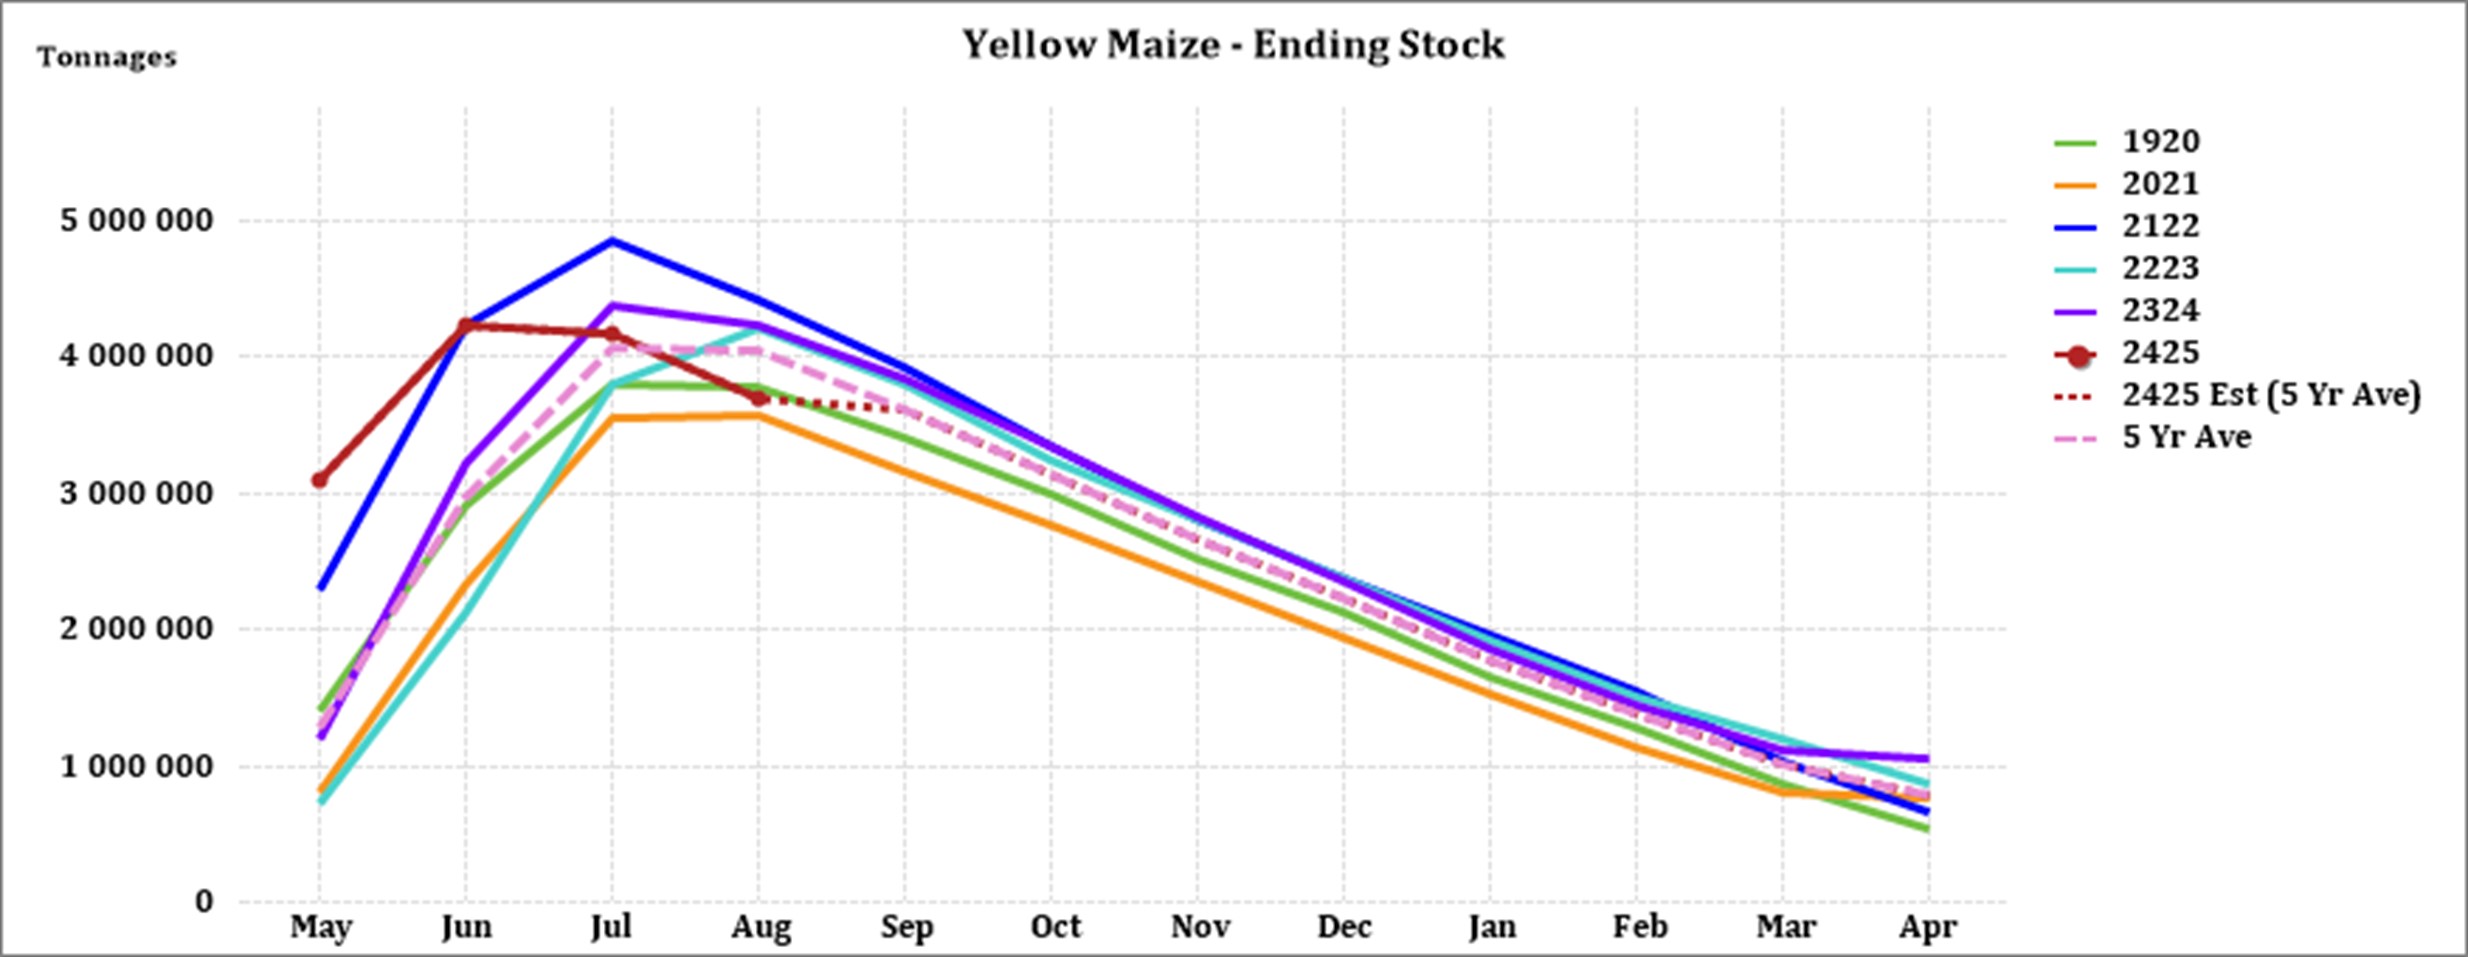
The graphs below show the predicted ending stock for the different commodities according to SAGIS data. A five-year average has been calculated to determine the estimated ending stock for the current season. The predicted five-year average white maize in April 2025, is 202 082 t less than the final for the 2023/2024 season. Yellow maize shows a 282 419 t decrease in ending stock compared to the previous season.
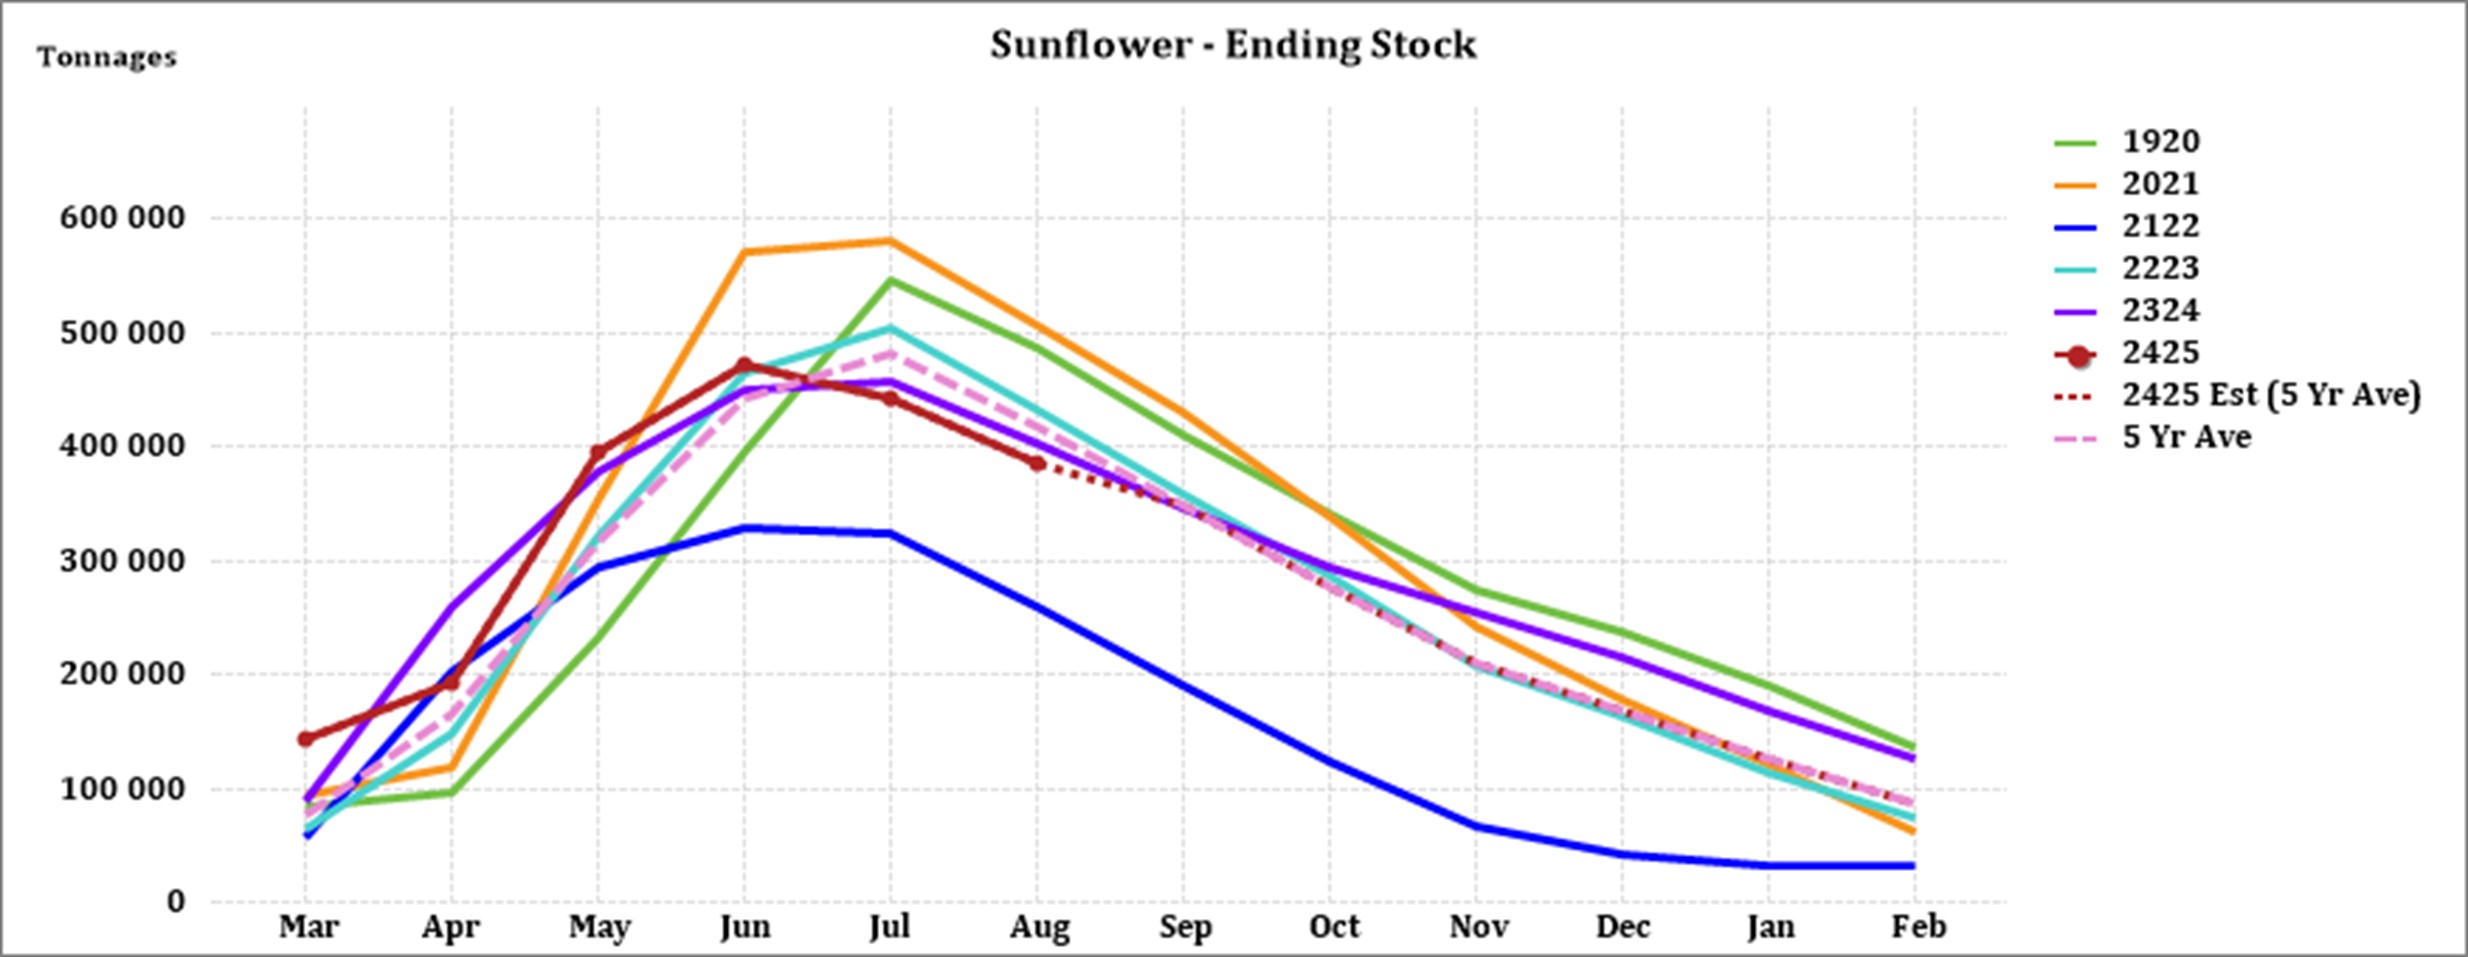
The predicted five-year average sunflower ending stock for the 2024/2025 season is 41 396 t less than the previous season ending stock.
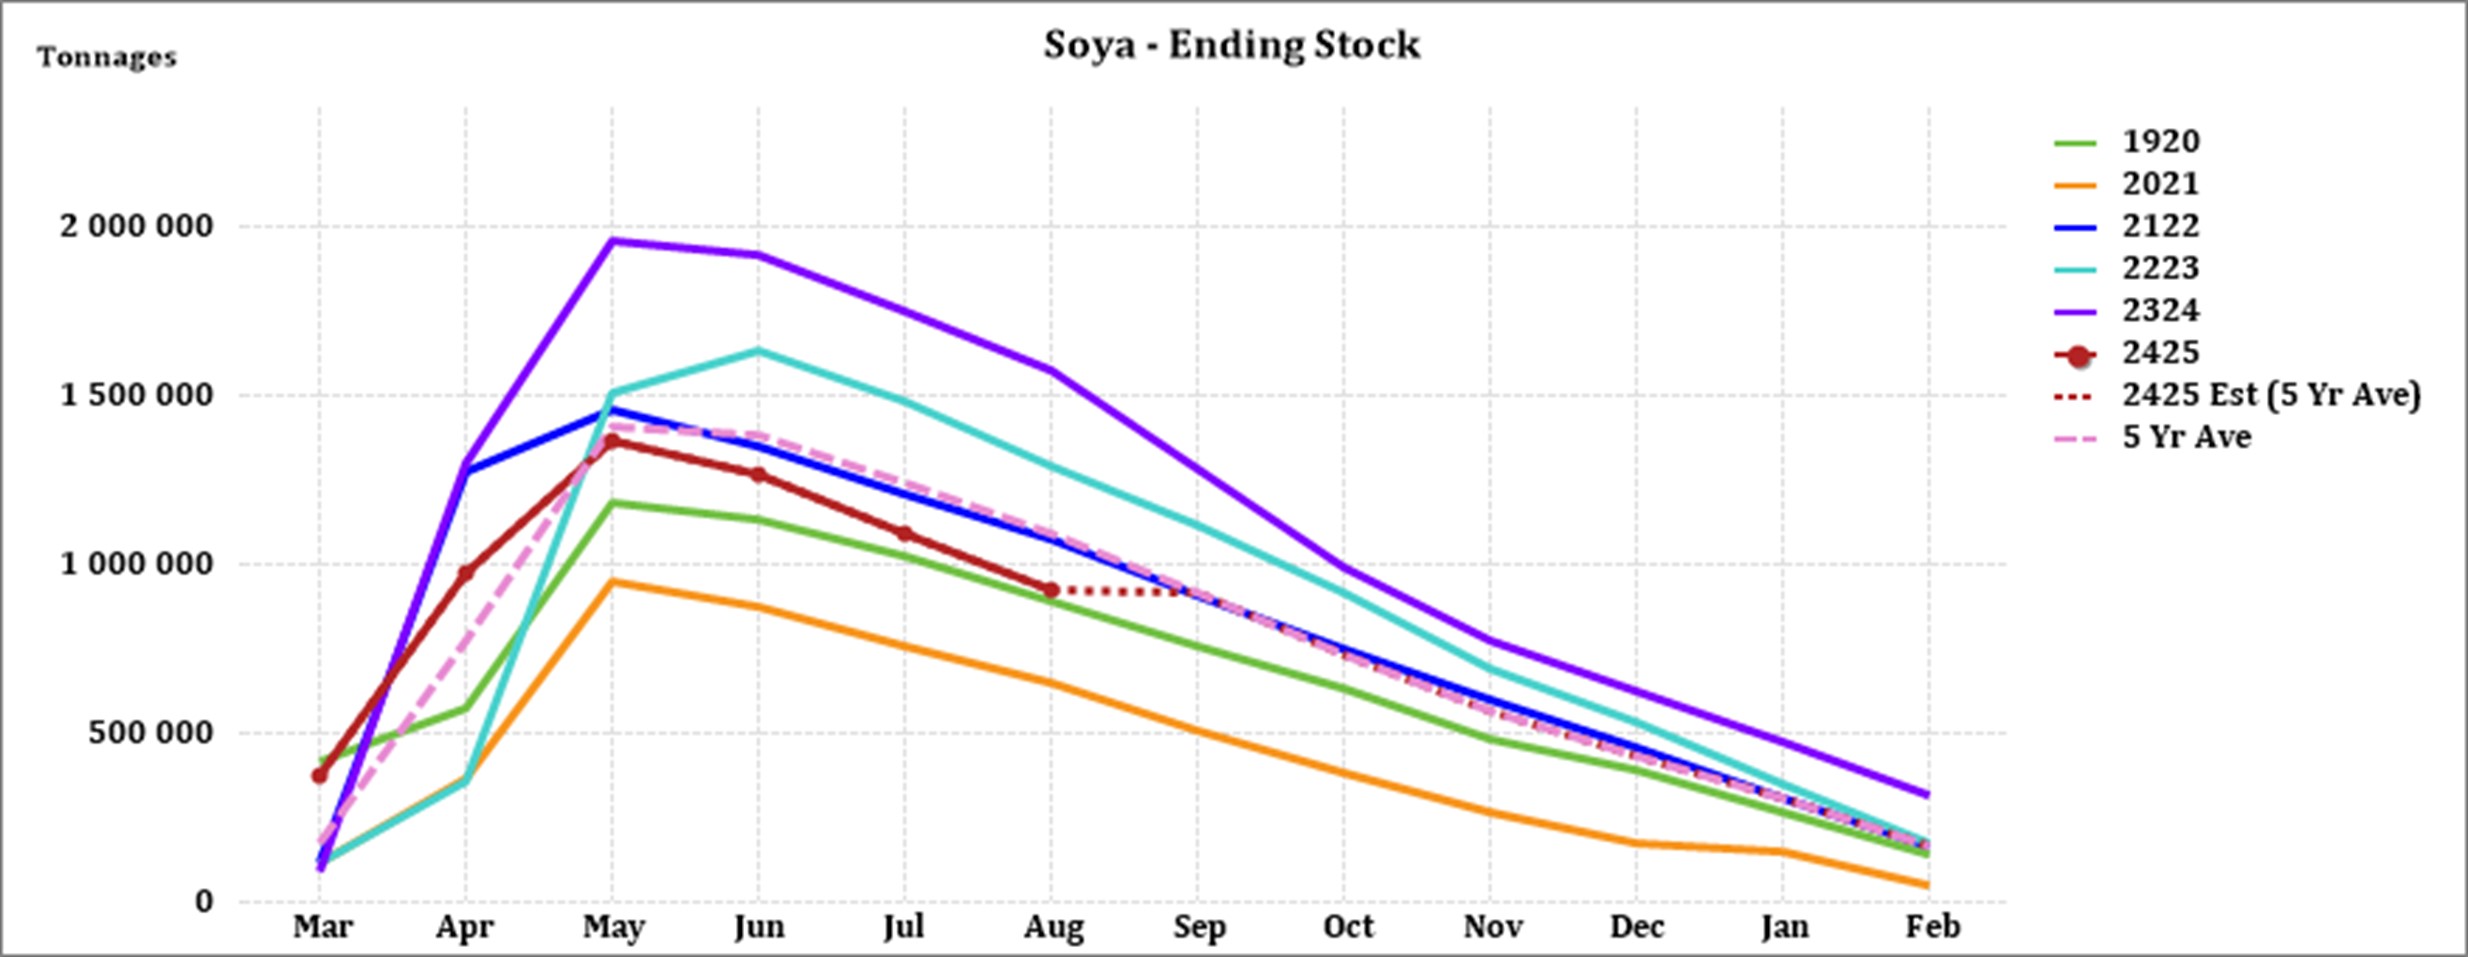
The predicted five-year average soybean ending stock for 2024/25 is 151 551 t less than the previous season ending stock.
Crop estimations
According to the Crop Estimate Committee (CEC) eighth production forecast for 2024, the total area estimate for maize in South Africa is 2,636 million ha, which is 1,94% more than the actual 2,586 million ha planted for the previous season. The forecasted tons are revised downwards with 258 750 t from the seventh forecast.
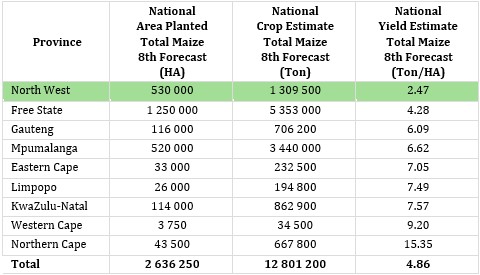
Source: CEC (Crop Estimates Committee)
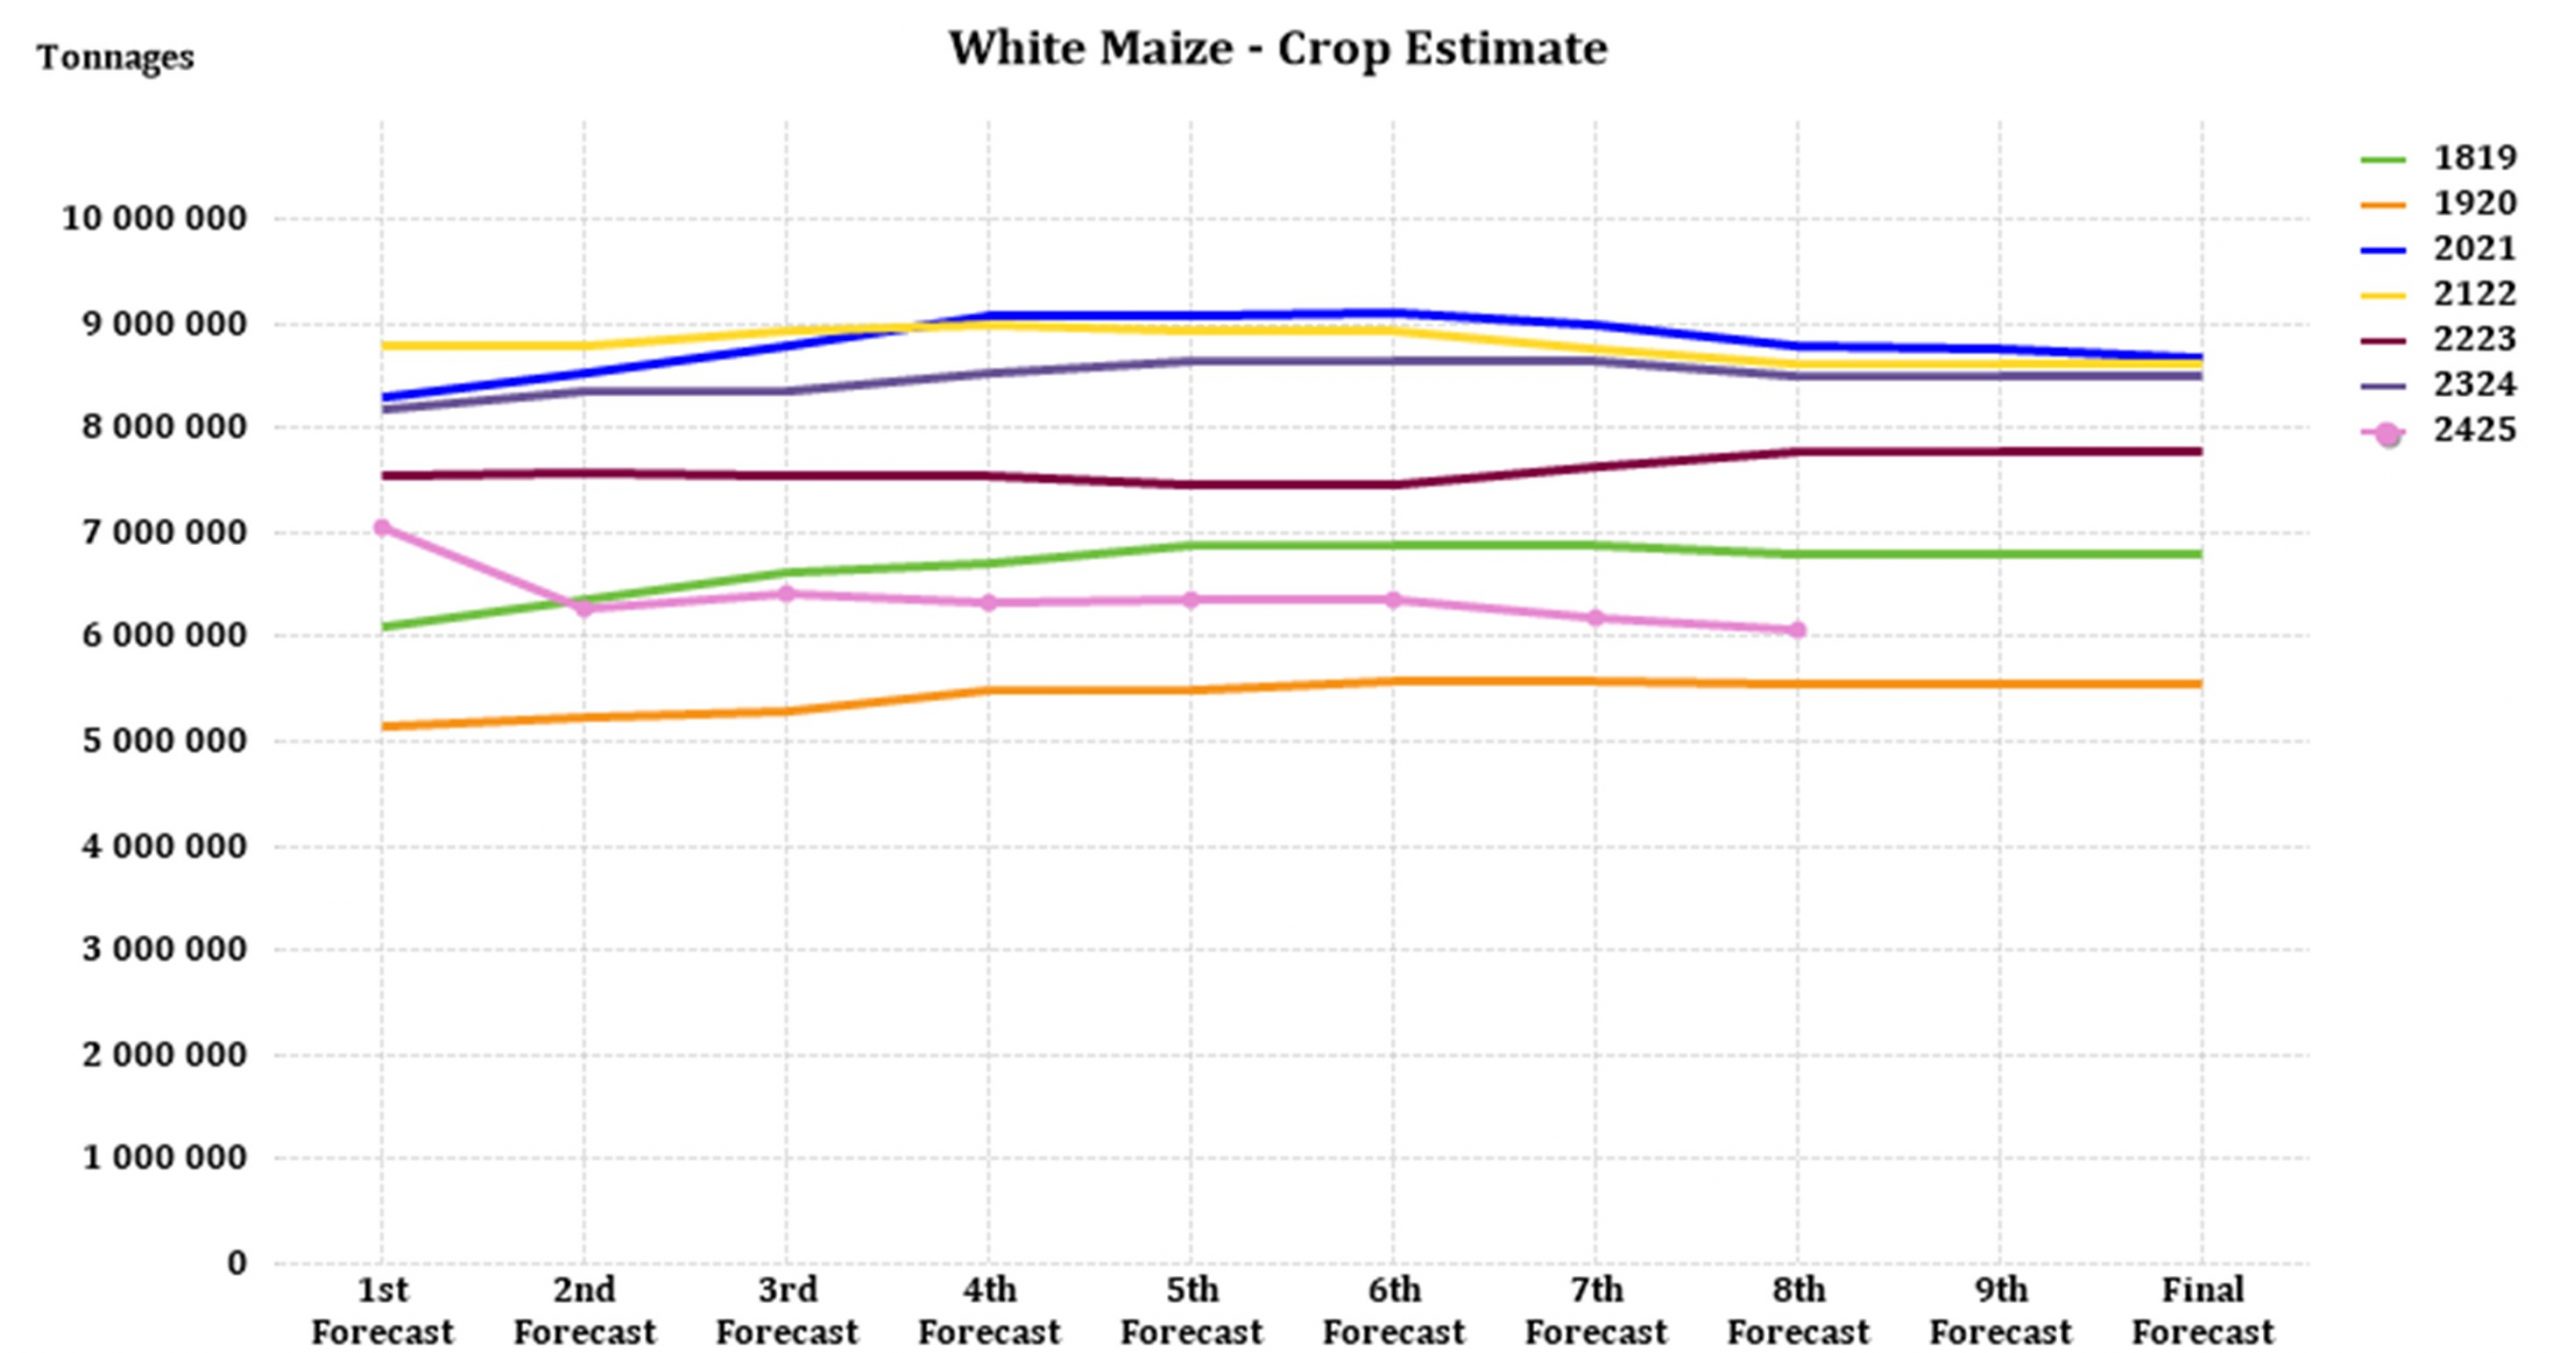
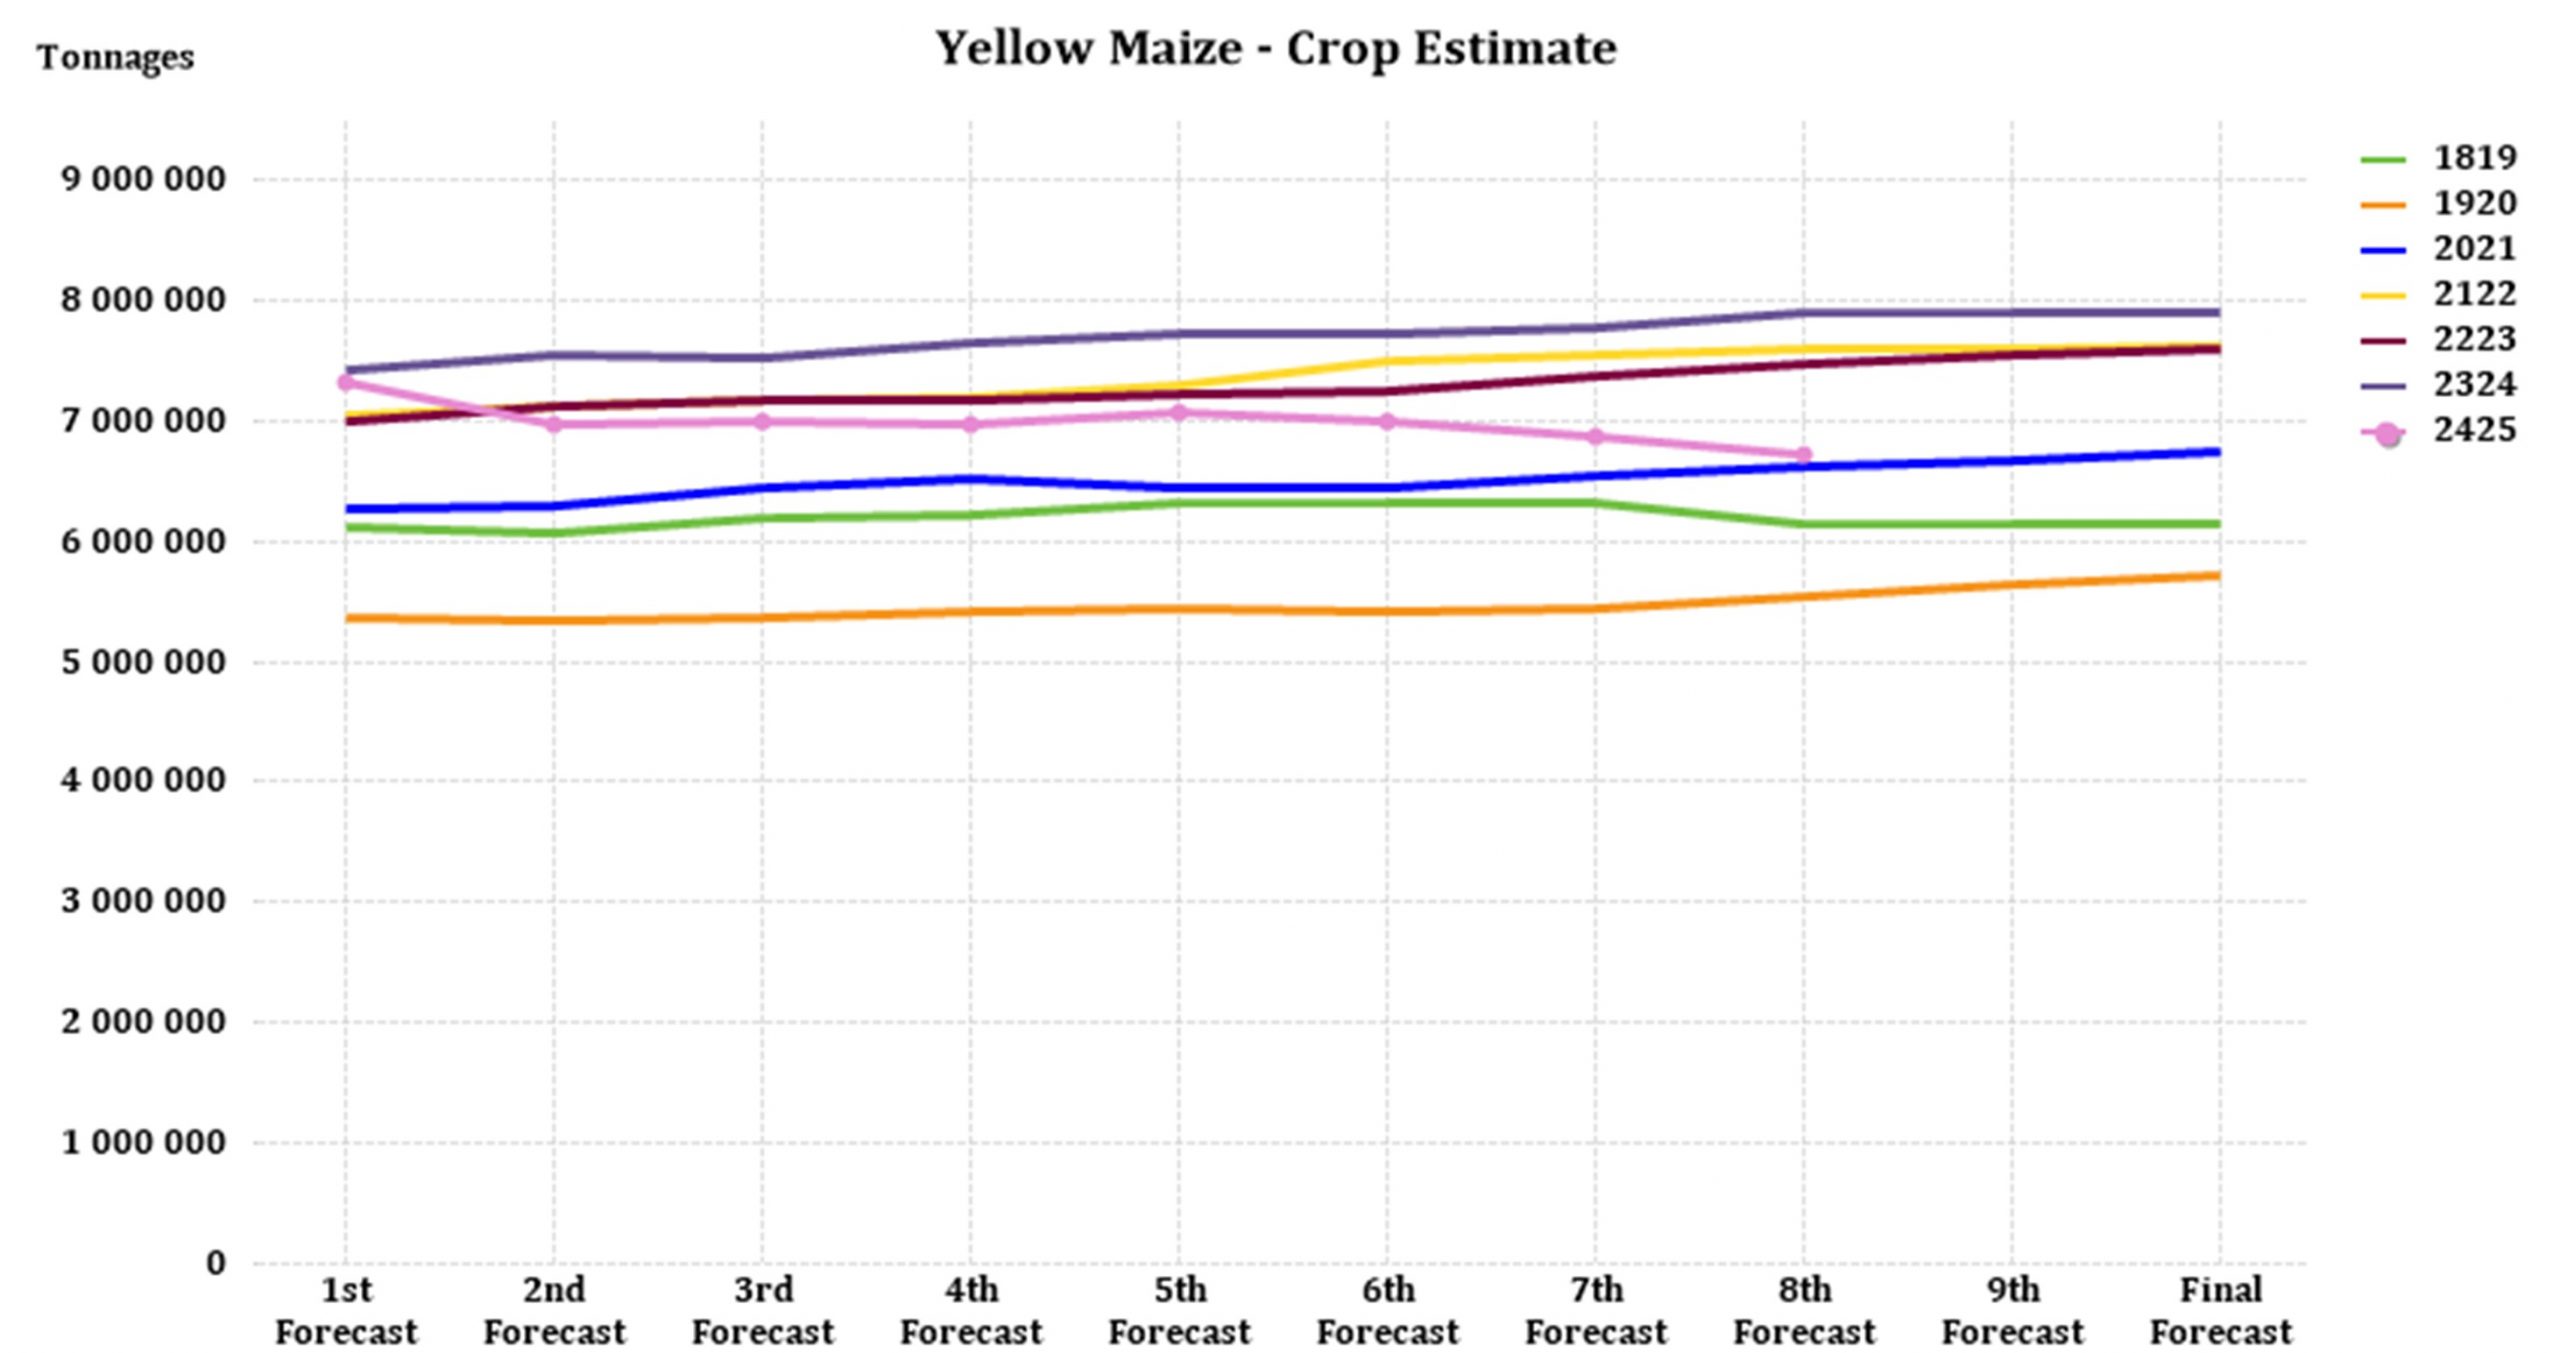
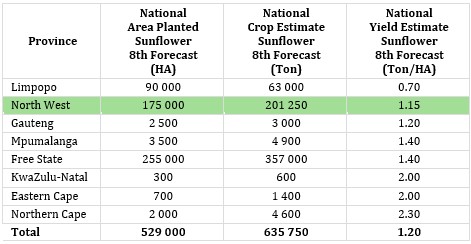
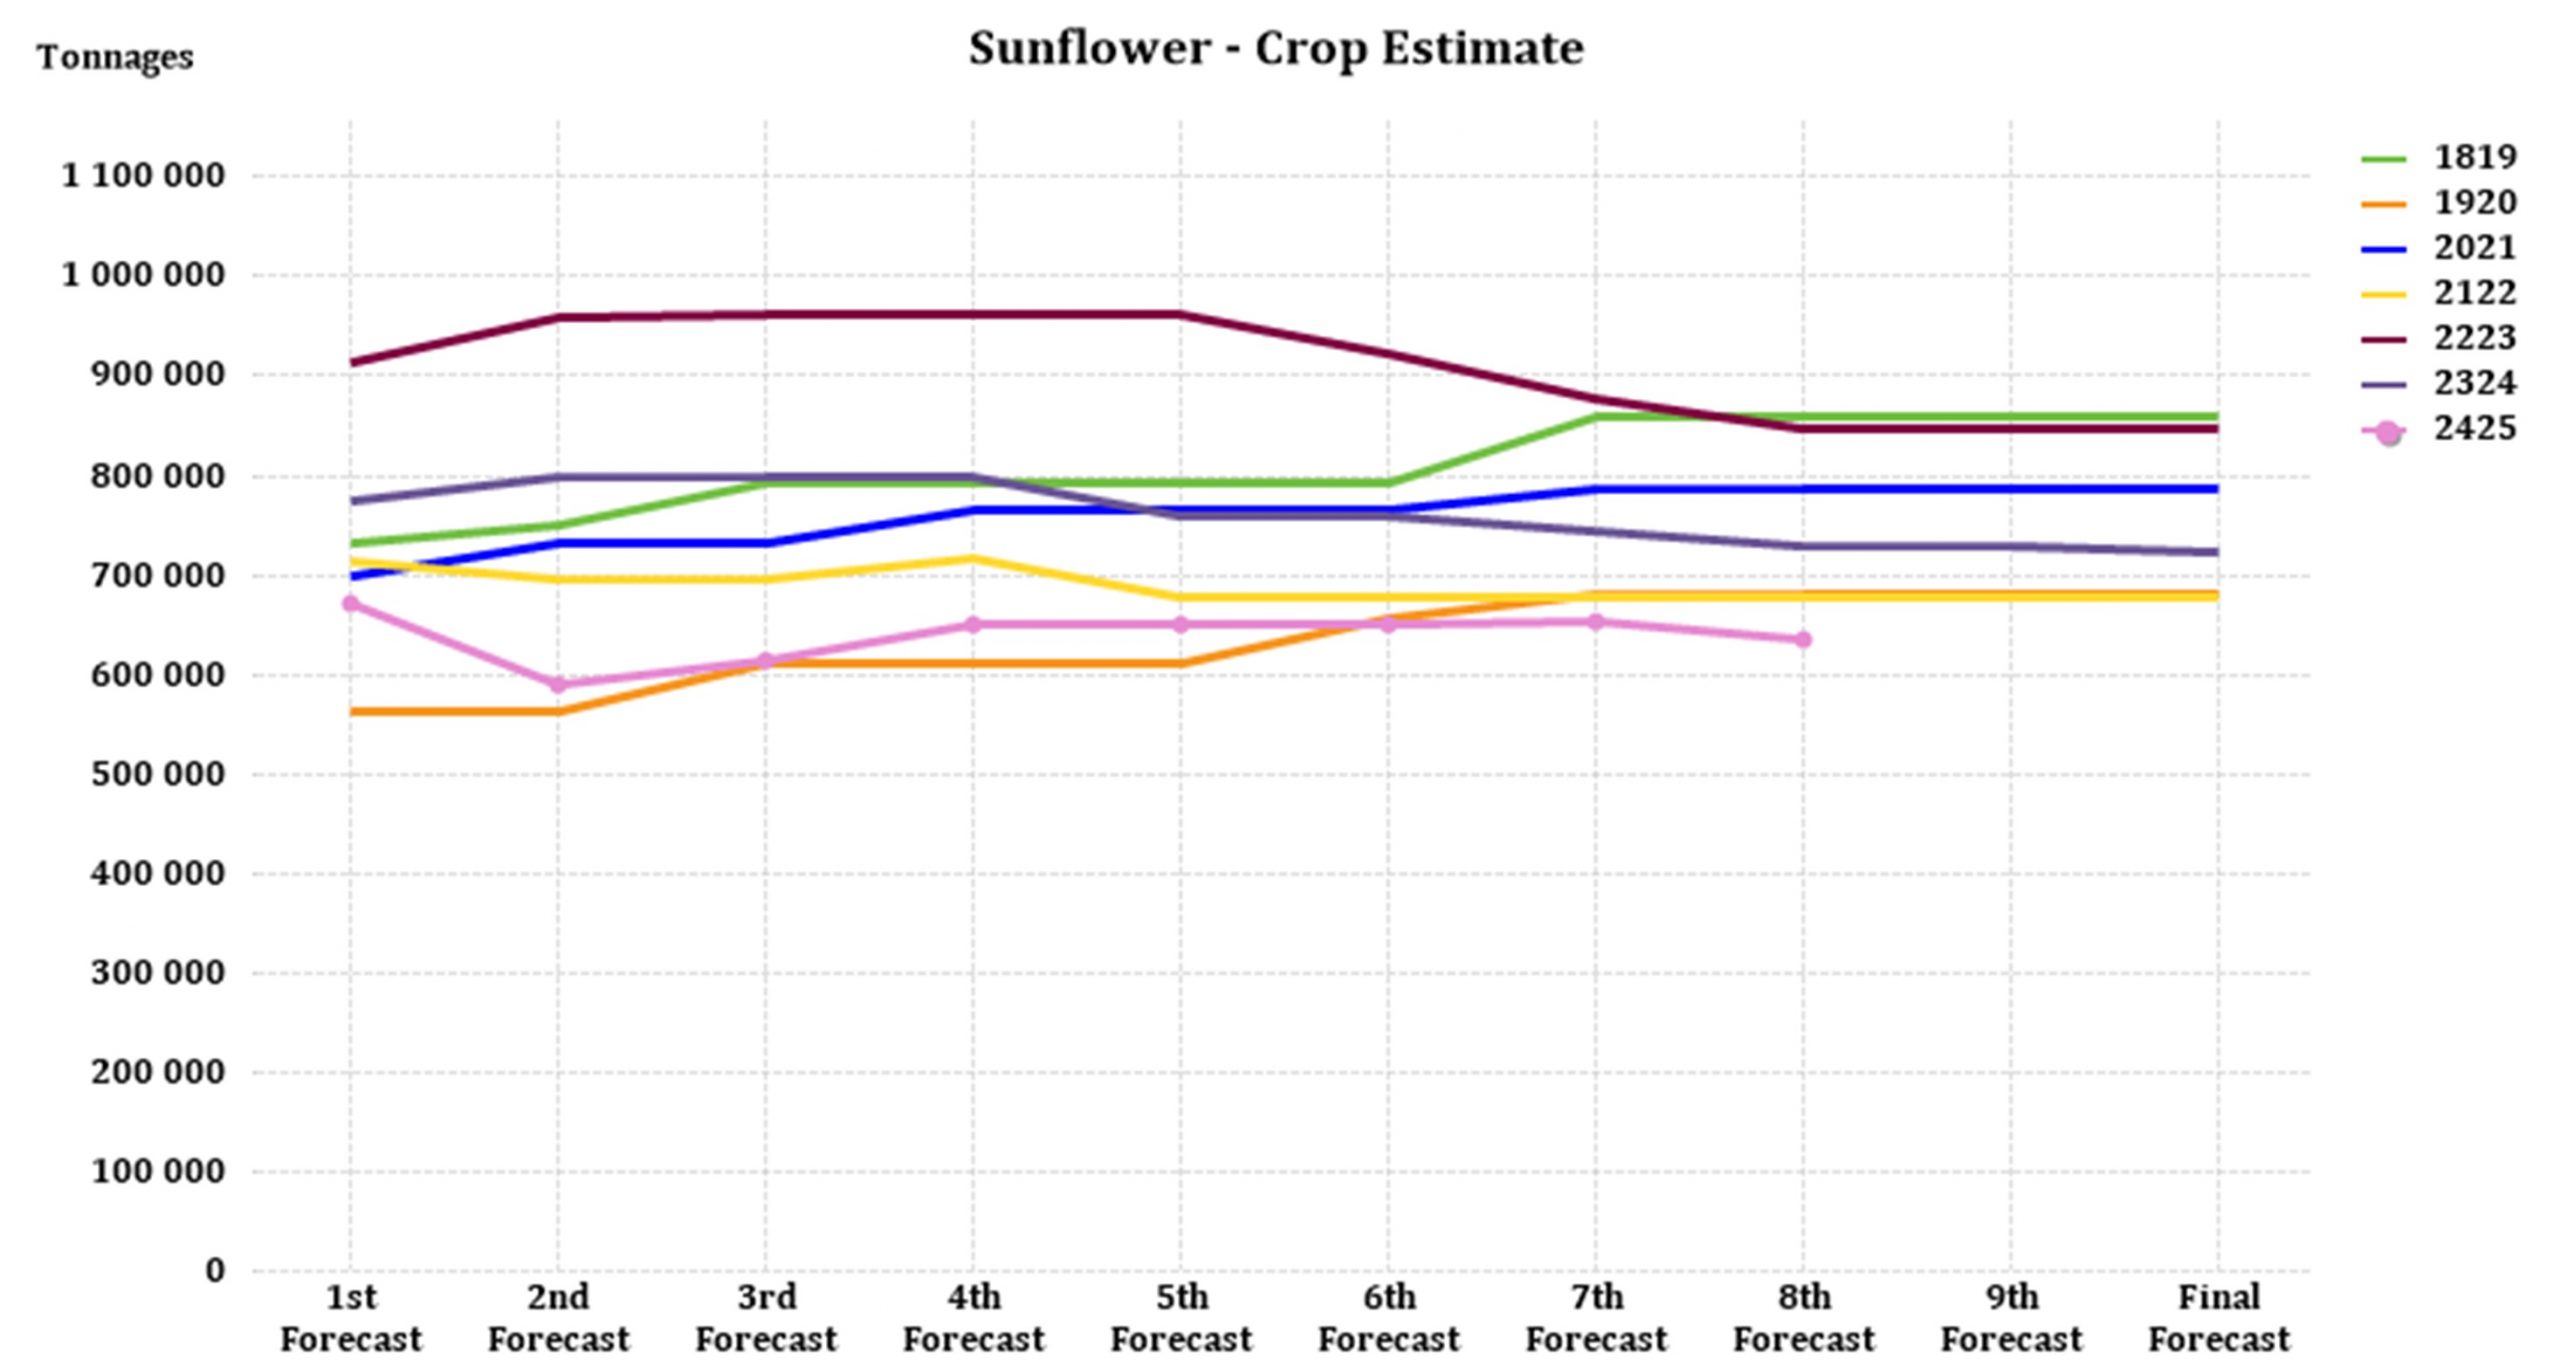
The production forecast for sunflower is predicted to be 13 500 t less than the previous forecast of 649 250 t. The area estimate for sunflower seed is 529 000 ha while the expected yield is 1,20 t/ha.
Source: CEC (Crop Estimates Committee)
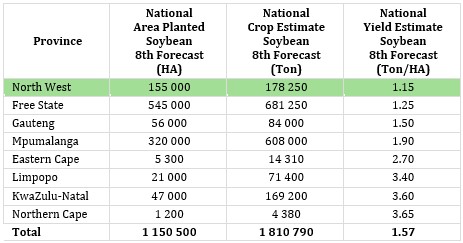
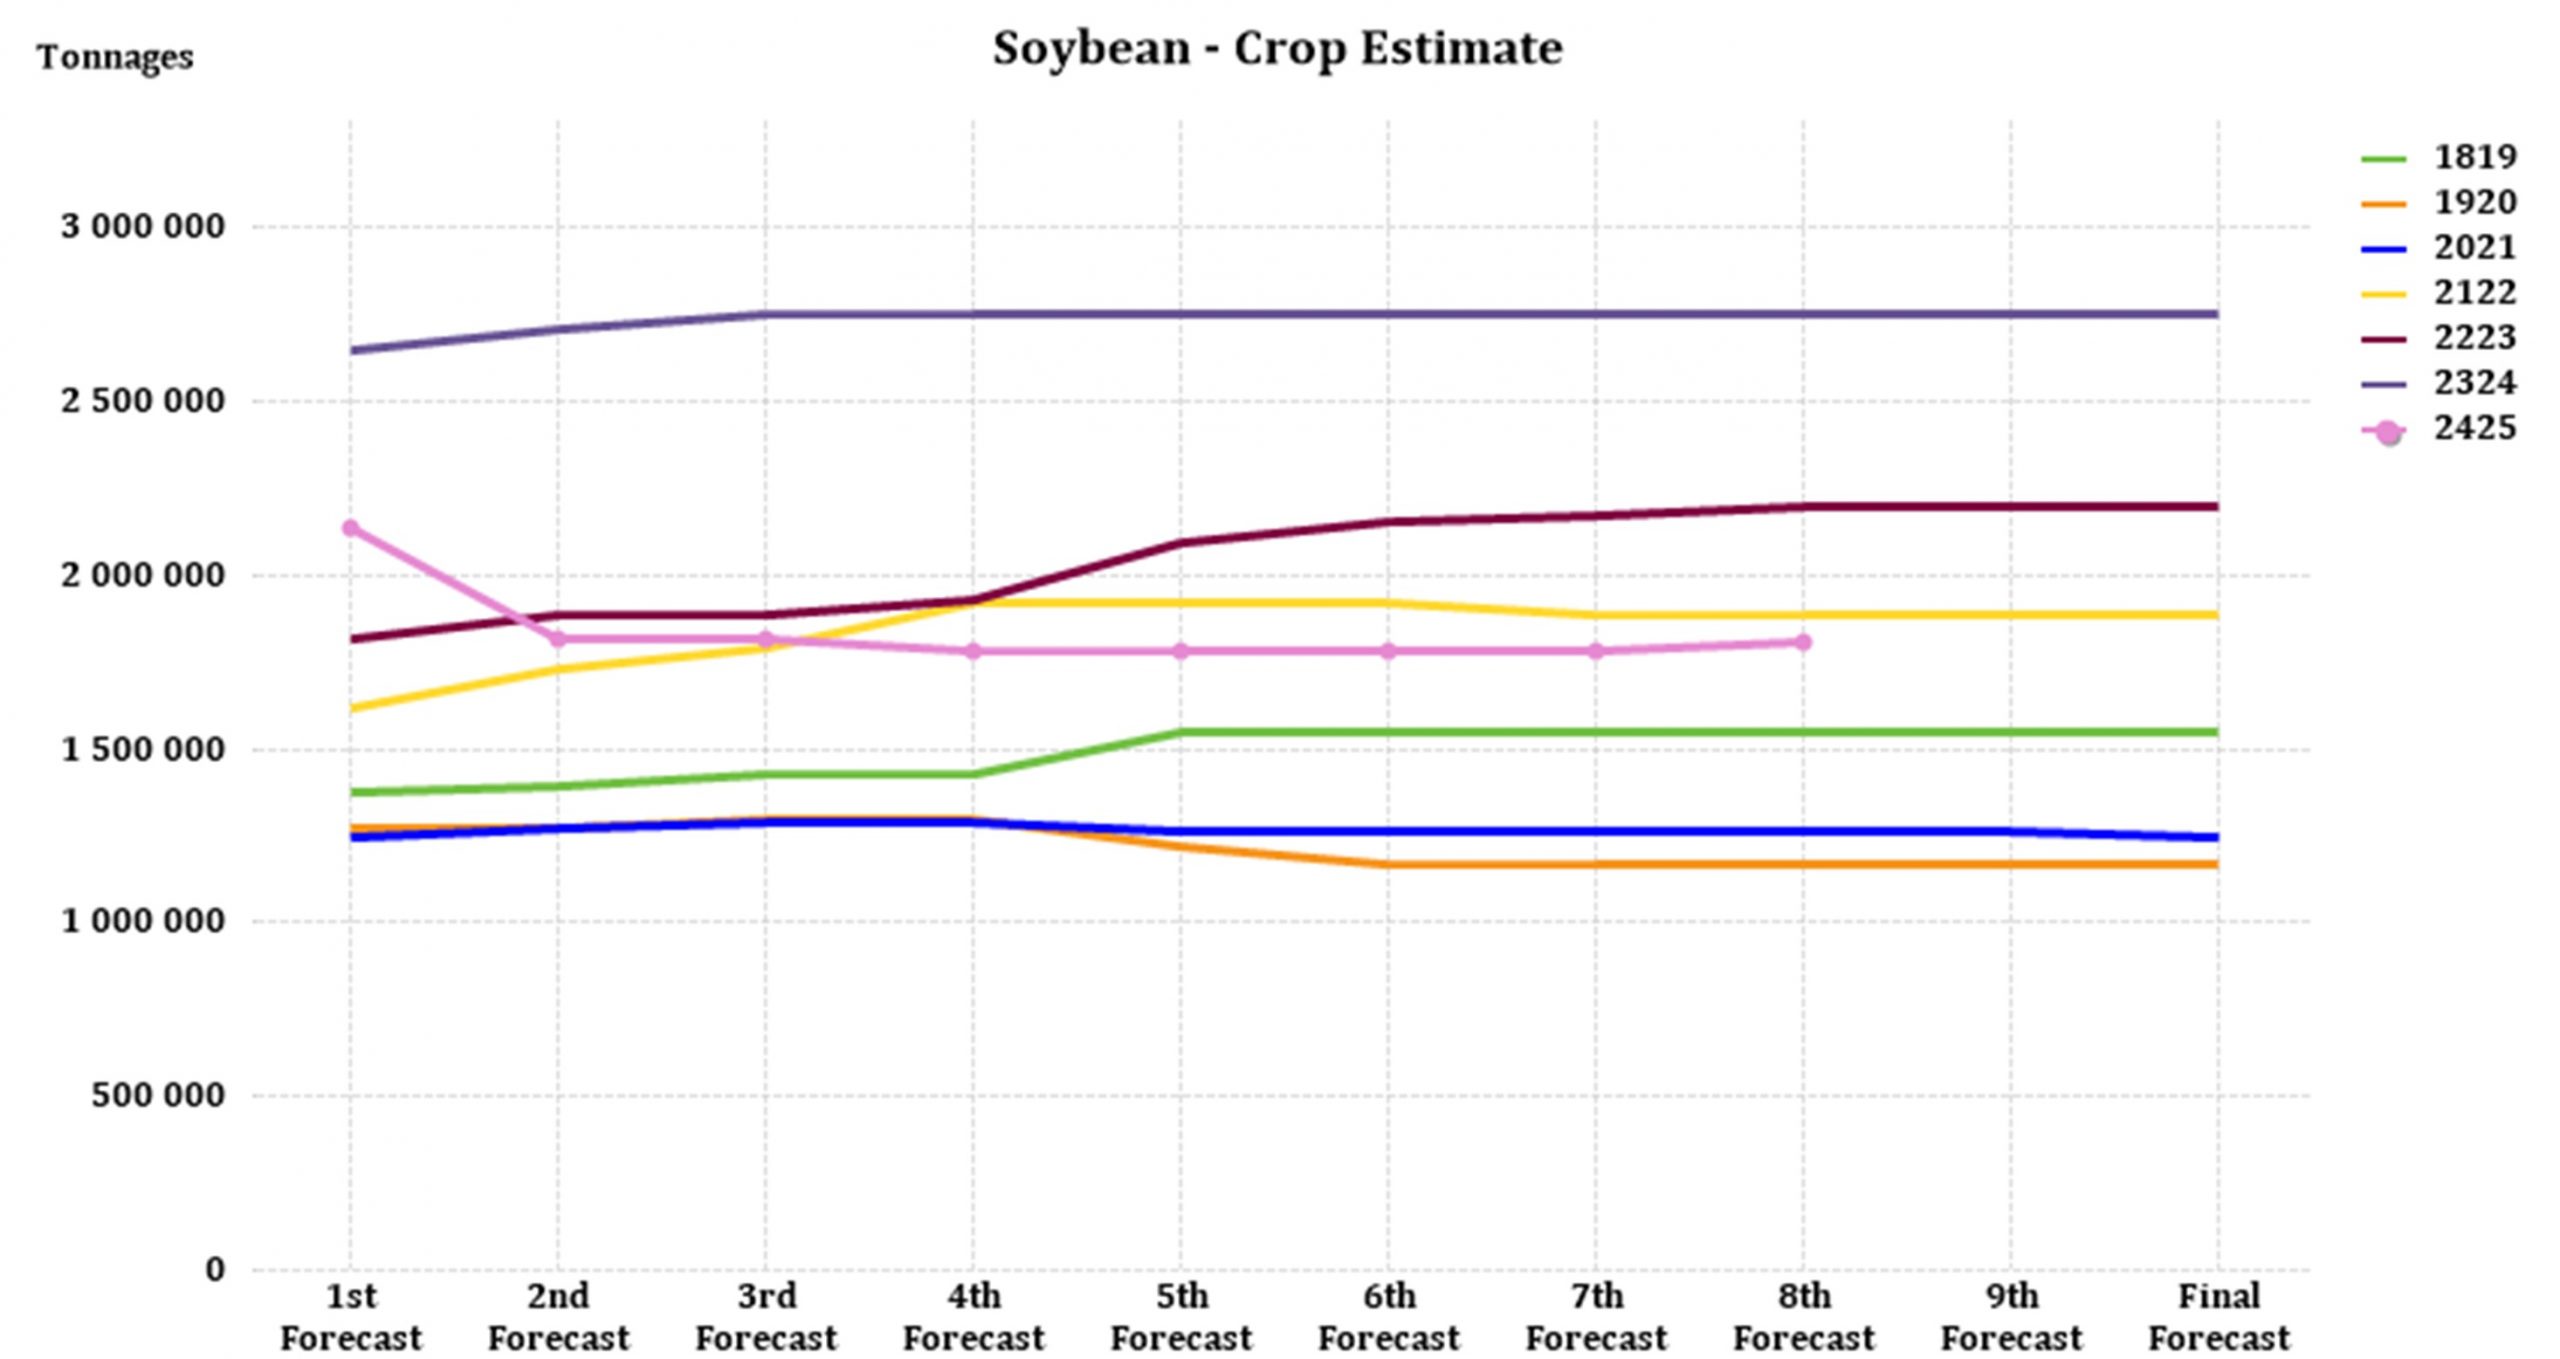
The production forecast for soybeans is 1,811 million t, 1,80% more than the previous season. The estimated area planted to soybeans is 1,151 million ha with an expected yield of 1,57 t/ha.
Source: CEC (Crop Estimates Committee)
• Imports and exports – National
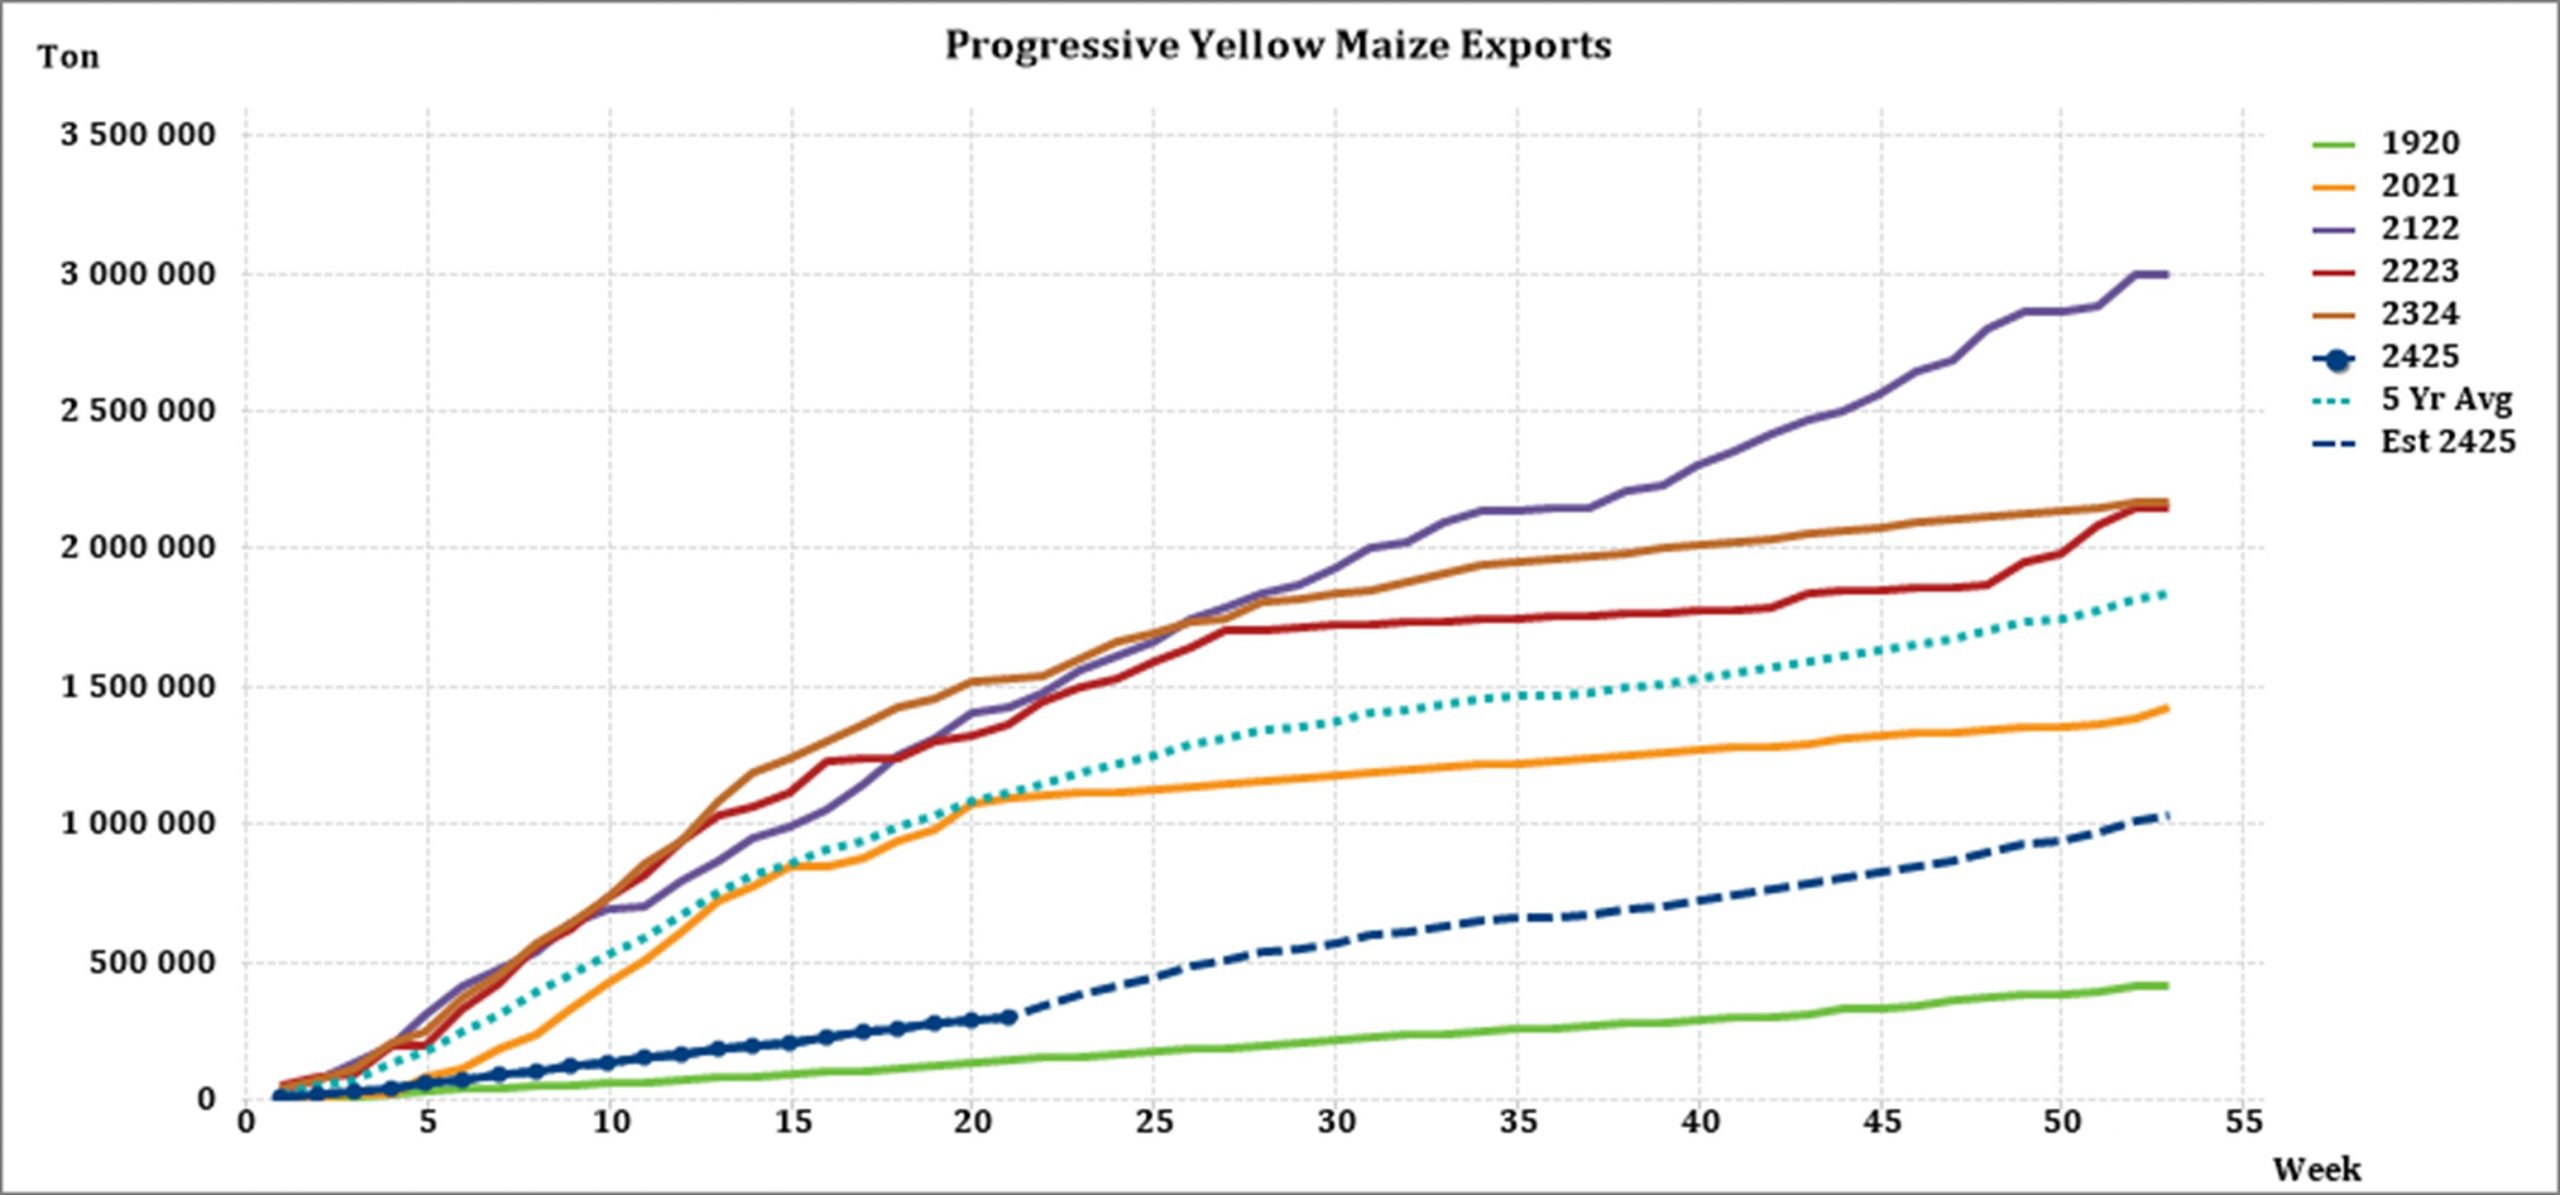
For the production season ending April 2025, 475 107 t of white maize and 244 872 t of yellow maize have been exported to date (week 21 of 52) as seen in the graphs below.
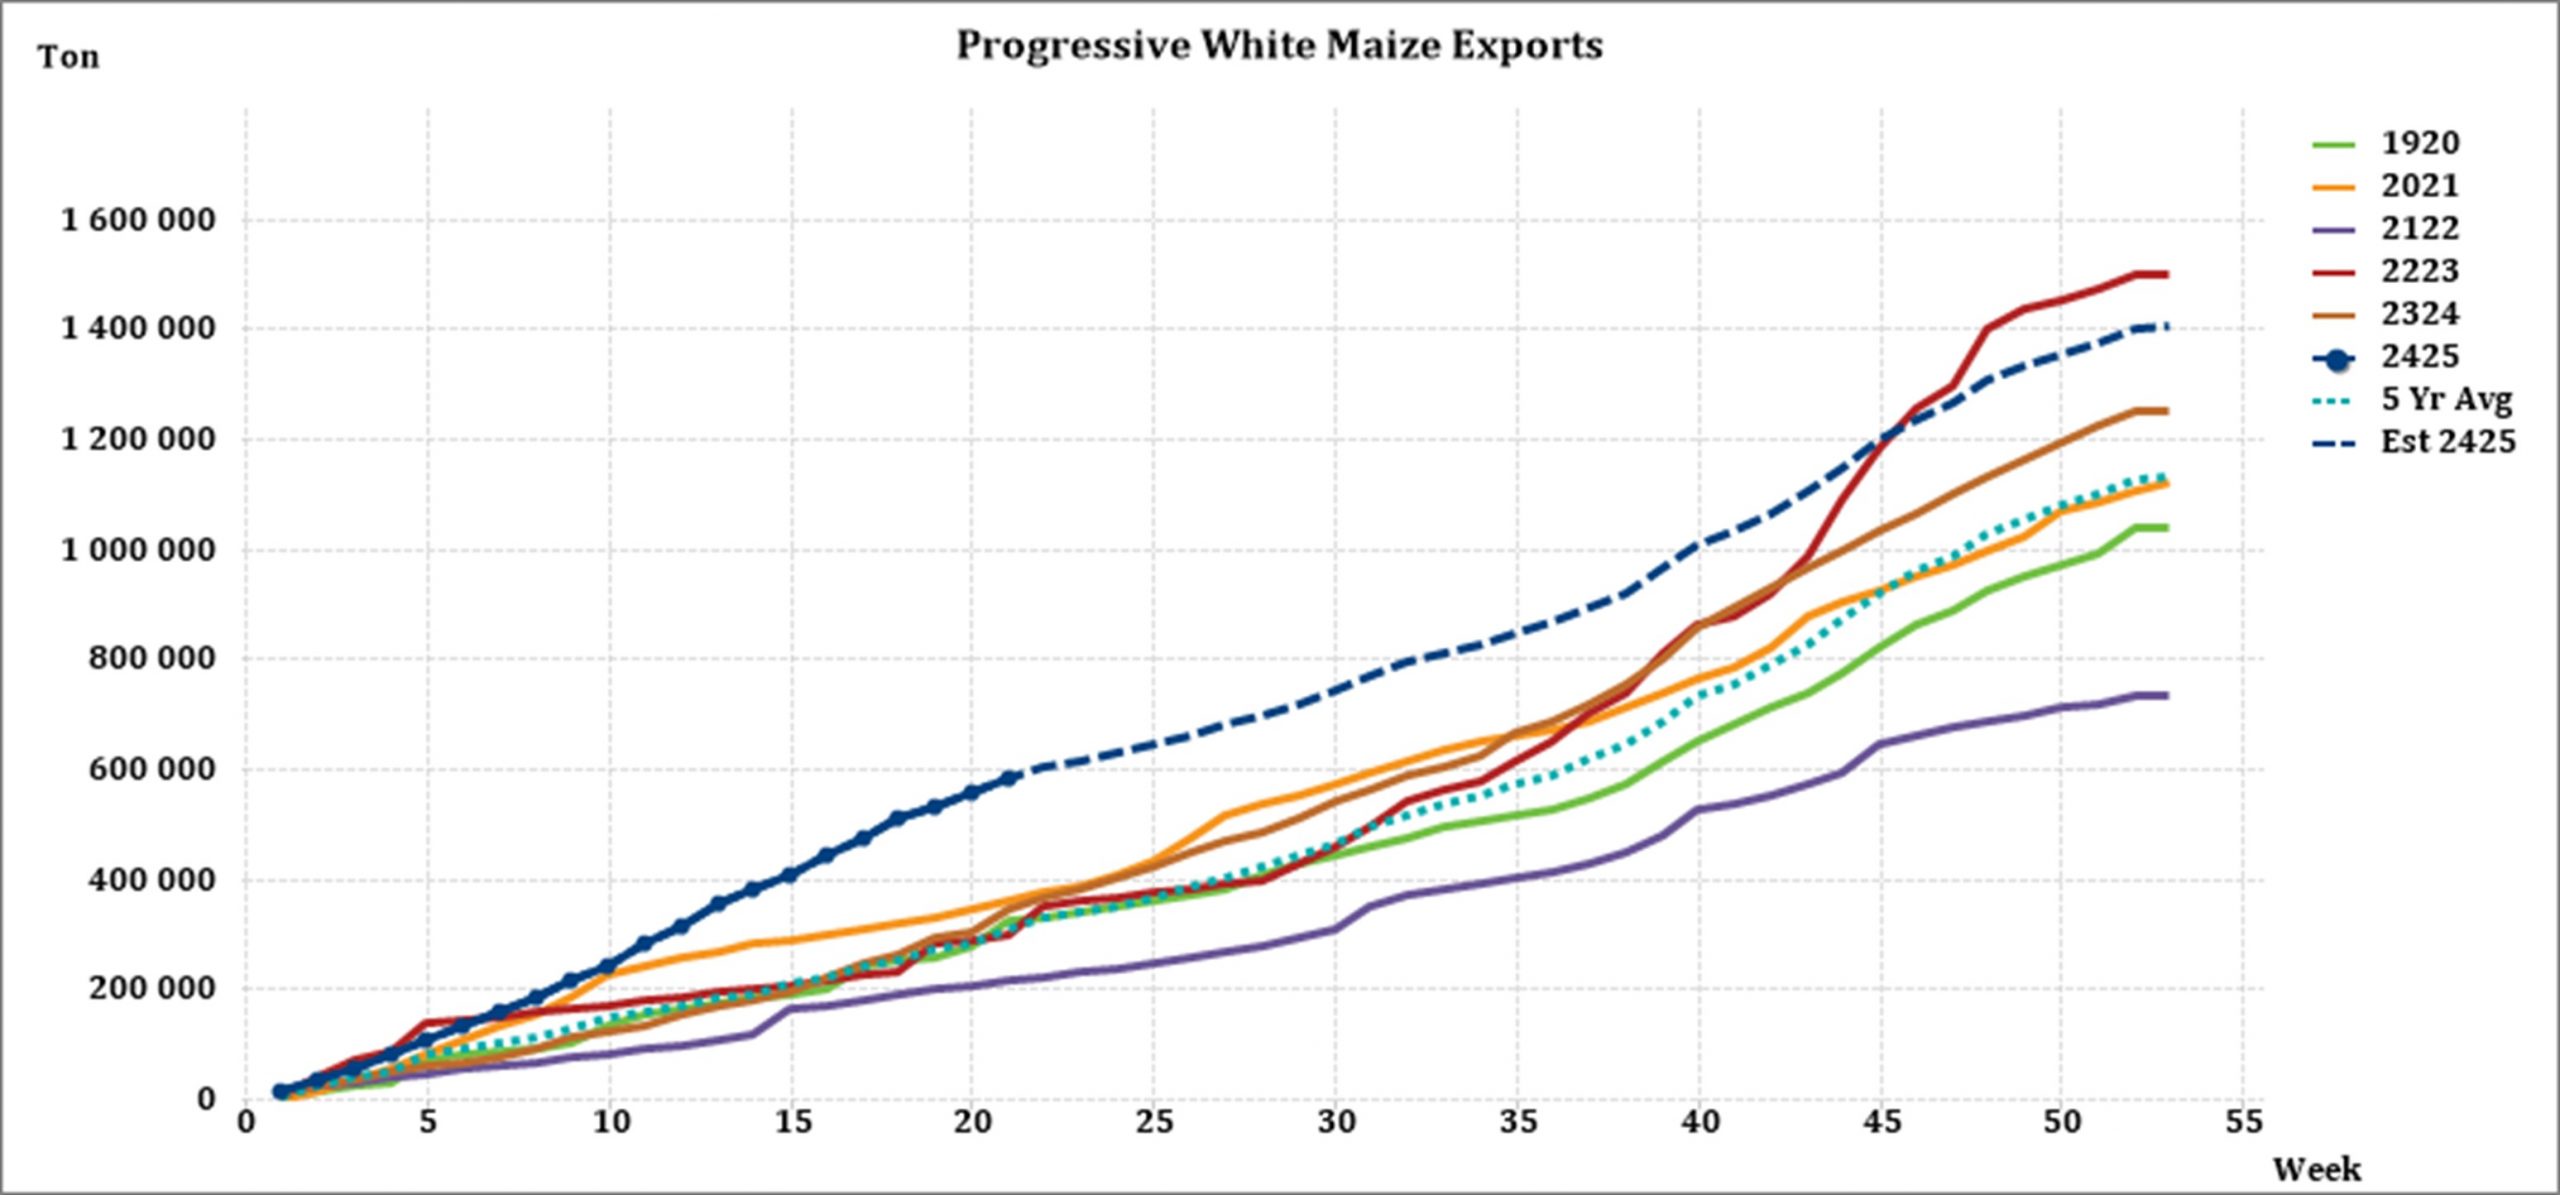

As seen in the table above, the average white maize exports per week is currently 27 746 t. If theoretically, white maize exports remain at the current average per week then there would be 157 203 t less white maize exports than anticipated.
The average yellow maize exports per week are currently 14 496 t. If theoretically, yellow maize exports remain at the current average per week then there would be 61 220 t less yellow maize exports than anticipated.
• Parity prices
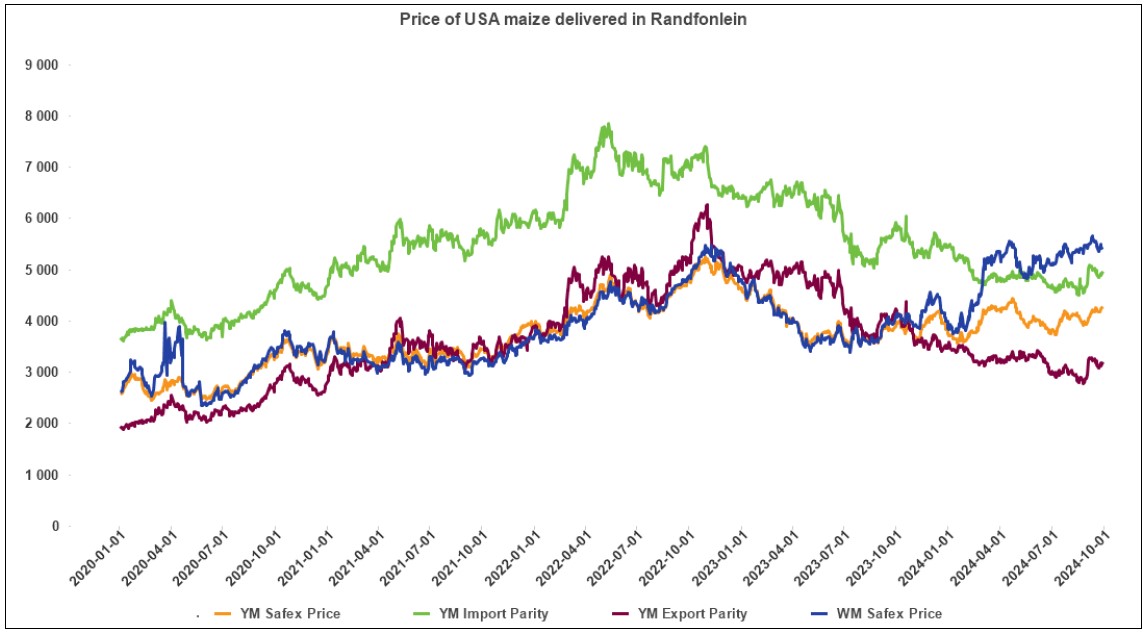
South Africa is a small producer compared to other countries and is thus a price taker (meaning that we cannot influence world prices). Because of this, our local prices are normally between import and export parity, which is illustrated in the figure below. An import parity price is defined as the price which a buyer will pay to buy the product on the world market. This price will include all the costs incurred to get the product delivered to the buyer’s destination.
An export parity price is defined as the price that a local seller could receive by selling his product on the world market e.g., excluding the export costs. The price which the seller obtains is based on the condition that he delivers the product at the nearest export point (usually a harbour) at his own expense.
The graph below reflects the Safex price, import parity and export parity of yellow maize as well as the Safex price of white maize. The import and export parity prices for white maize is not released by Grain SA for this period.
• Grain processing per province
For the marketing year which is May to April (2024/2025), the Free State province dominates the white maize that is used for human consumption and gristing. North West consumed the second most white maize produced for human consumption for the marketing year.

Gauteng used the most white maize for animal feed and industrial usage with the Free Sate using the second most.

Mpumalanga processed the most yellow maize for consumption and gristing and Gauteng processed the most yellow maize for animal feed and industrial purposes.


• Exchange rate
NWK Group is exposed to foreign exchange rate risk in various business areas, such as commodity prices and trade imports, etc.
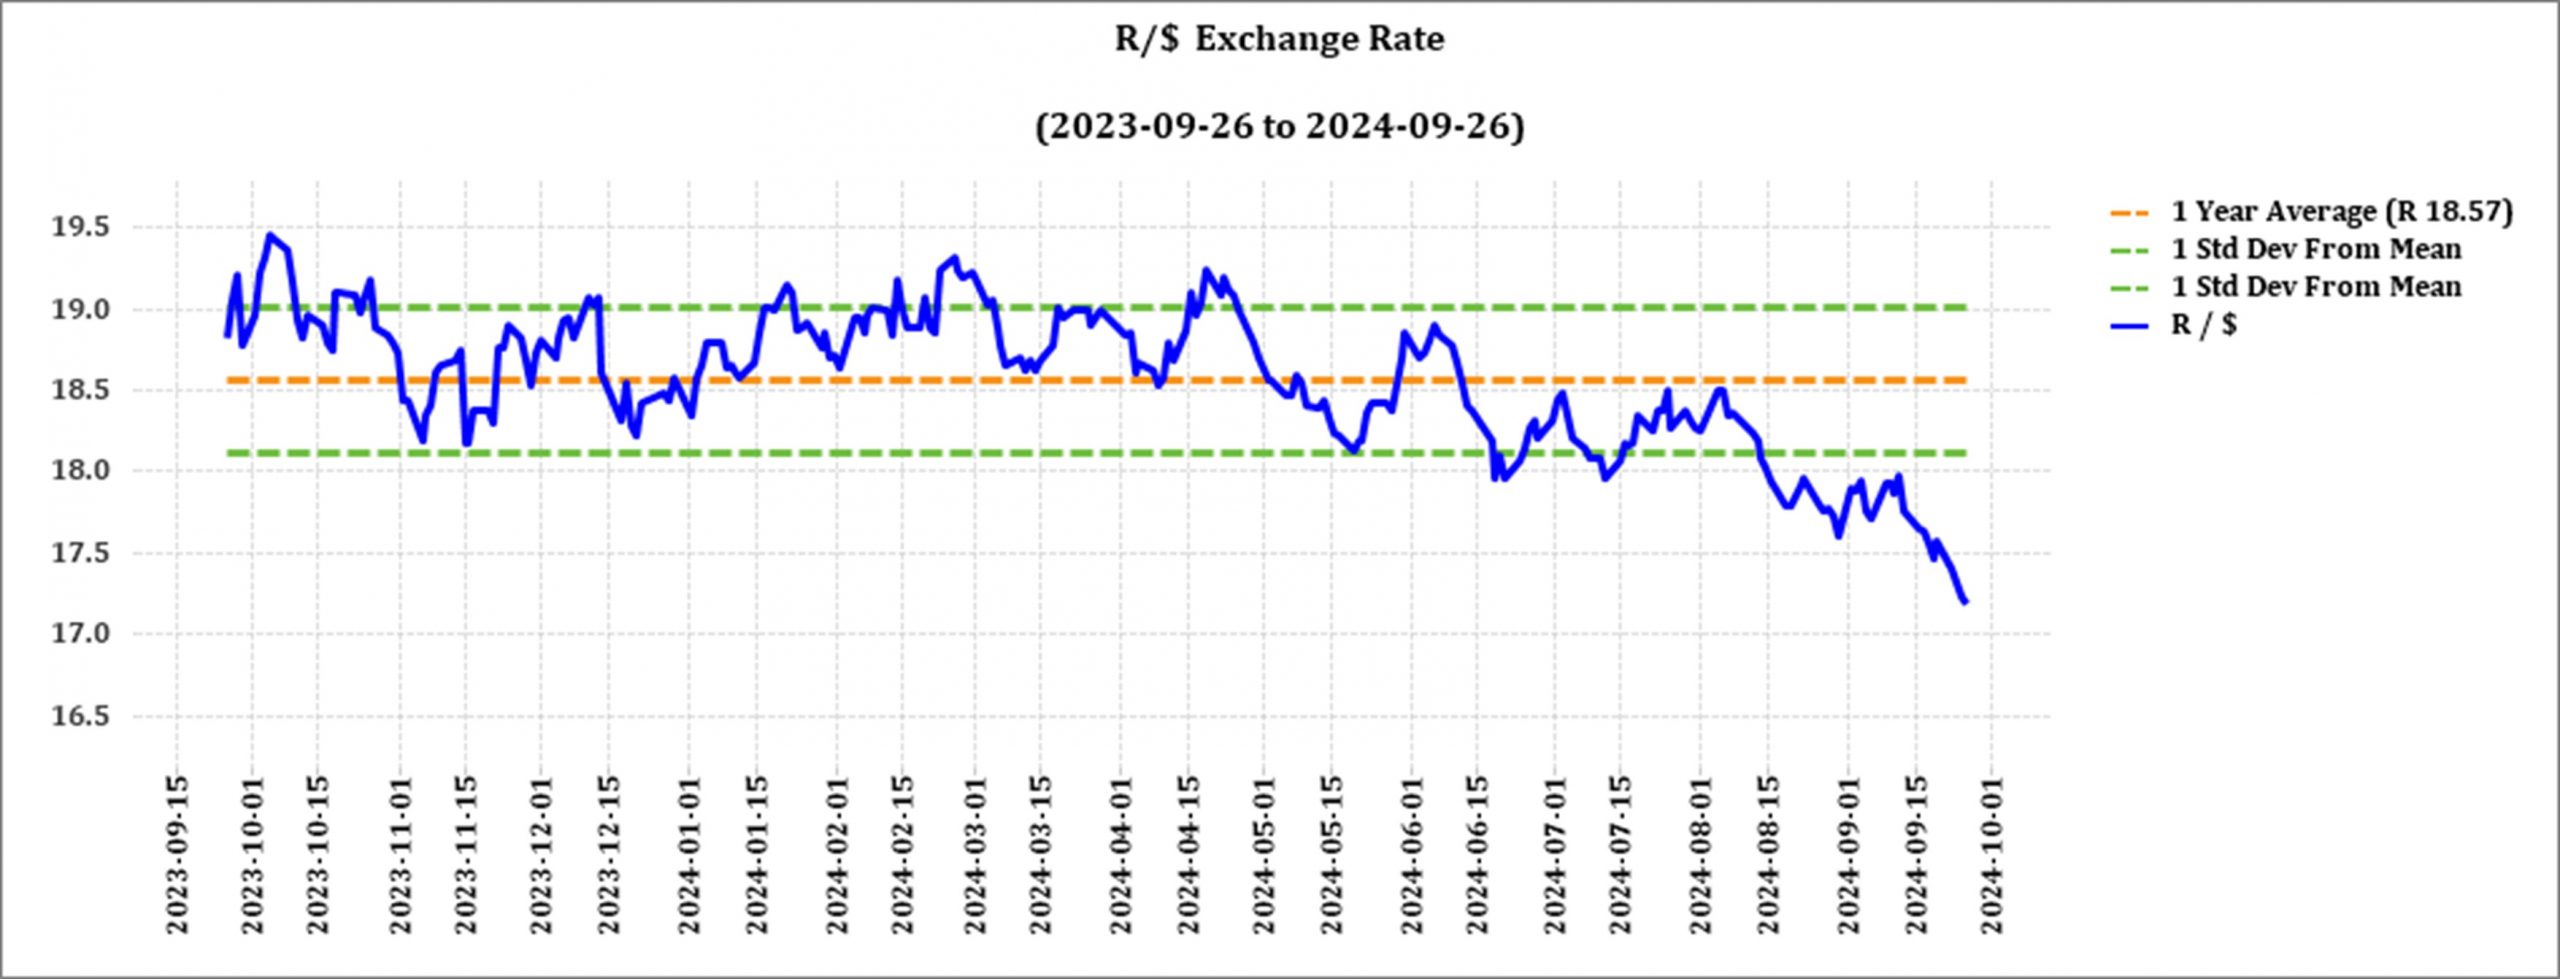
The rand traded at a monthly average of R17,69 against the dollar for the month of September. This is better than a year earlier.
Source: Trading Economics
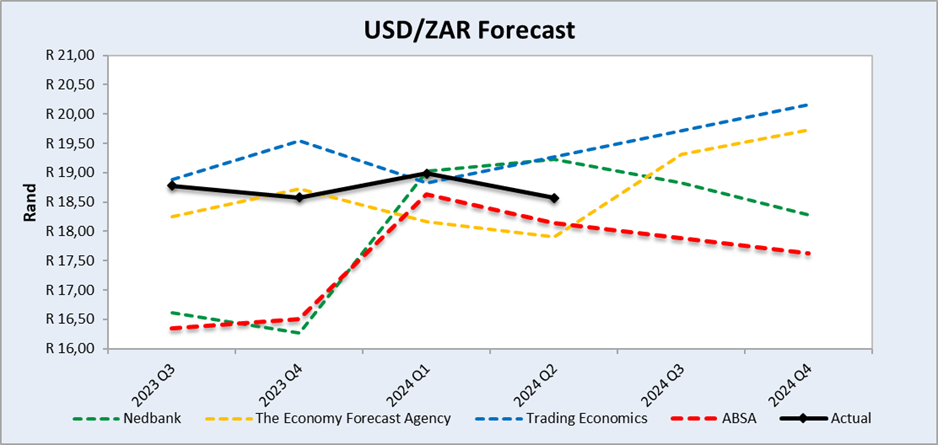
Source: Nedbank CIB; The Economic Forecast Agency; Trading Economics
The graph above shows the actual USD/ZAR for 2023 Quarter 3 (Q3) to 2024 Quarter 4 (Q4) against the forecasted figures.
• Interest rate risk
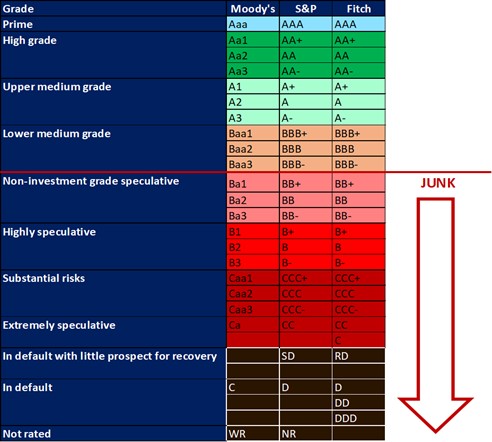
On 27 March 2020, Moody’s downgraded South Africa’s sovereign credit rating to sub-investment grade and placed a negative outlook on the rating. The key drivers for this downgrade include weak economic growth, continuous deterioration in fiscal strength, and slow progress on structural economic reforms. It is now the first time in post-apartheid South Africa that all major rating agencies, i.e., Moody’s, Fitch, and S&P, have South Africa’s credit ratings in sub-investment grade territory. More than a year later and our Moody’s rating remains the same.
During the previous Monetary Policy Committee (MPC) meeting held on 19 September the committee decided that interest rates will remain unchanged. The repo rate is currently 8% and the prime rate is 11,.50%. The South African Reserve Bank made several interest rates cuts to bring relief to the economy after Covid-19, but since November 2021 borrowing costs rose again by a cumulative 475 bps.
Interest rate movement:
- 26th January 2023 – 10,75%
- 30th March 2023 – 11,25%
- 25th May 2023 – 11,75%
- 20th July 2023 – 11,75%
- 21th September 2023 – 11,75%
- 23rd November 2023 – 11,75%
- 27th March 2024 – 11,75%
- 30th May 2024 – 11,75%
- 18th July 2024 – 11,75%
- 19th September 2024 – 11,50%
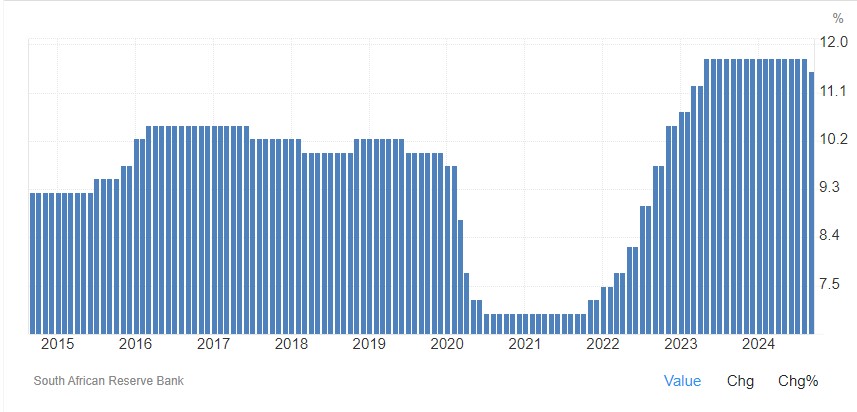
Lending rate in South Africa decreased to 11,5% in September. Lending rate in South Africa averaged 11,43% from 1950 until 2024, reaching an all-time high of 25,5% in August of 1998 and a record low of 5% in February of 1950.
Source: South African Reserve Bank
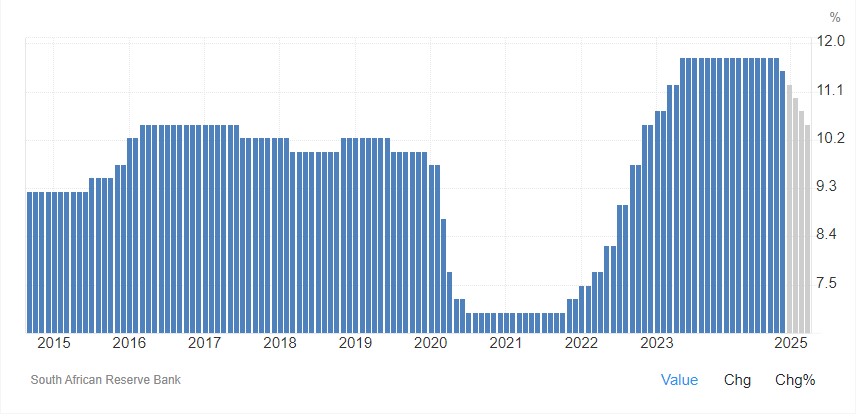
Lending rate in South Africa is expected to be 11,25% by the end of this quarter, according to Trading Economics global macro models and analysts’ expectations. In the long-term, the South Africa Lending Rate is projected to trend around 10,5% in 2025 and 9,5% in 2026, according to our econometric models.
Source: Trading economics
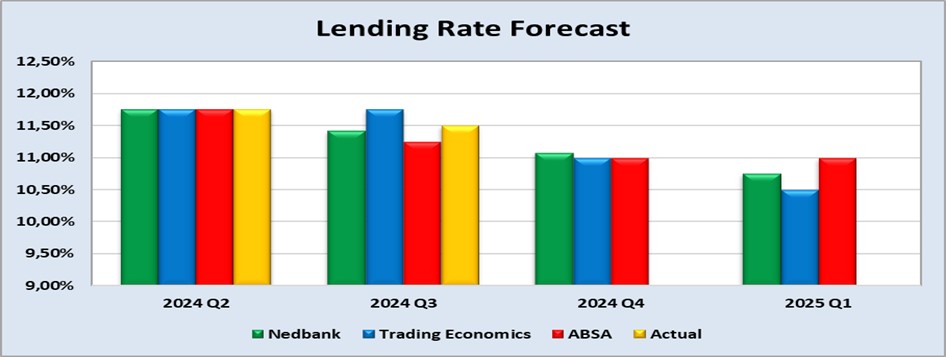
The following graph shows the prime rate forecast for 2024 Quarter 2 to 2025 Quarter 1.
• Inflation rate
As the inflation rate is a driver for increases and decreases in interest rates the current rate and forecast have to be assessed to foresee further increases in the interest rate.
Current: South Africa’s annual inflation eased for the fourth month to 3,8% in September 2024. It is now falling below the central bank’s preferred midpoint target of 4,5%.
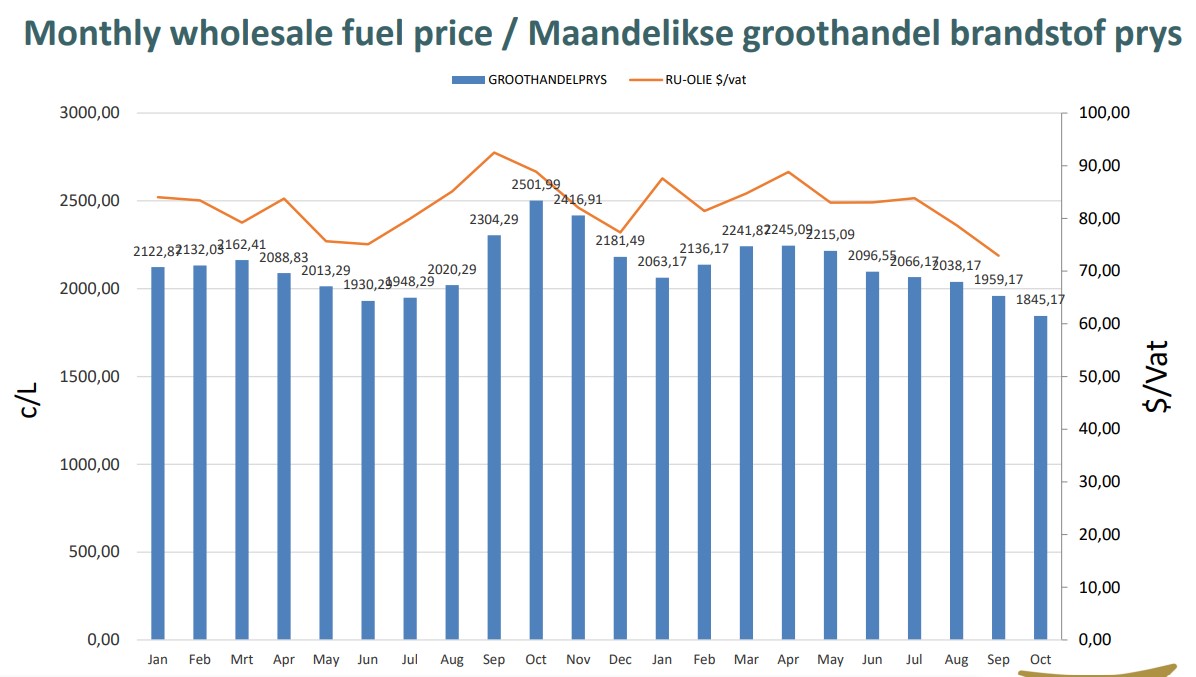
The main downward contribution came from transport costs which declined for the first time in 13 months (-1,1% vs 2,8% in August), mainly due to fuel (-9%). A litre of inland 95-octane petrol was R22,19, the lowest since February 2023. Price increases for vehicles have also slowed (3,6% vs 8,4% a year ago).
Meanwhile, cost of food and non-alcoholic beverages rose 4,7%, the same as in August. Softer annual rates were recorded for hot beverages; meat; bread & cereals; while vegetables, fruit, recorded higher inflation rates. In addition, cost of housing and utilities rose 4,8%, the same as in August but prices rose faster for alcoholic beverages & tobacco (4,7% vs 4.3%). Compared to the previous month, the CPI edged up 0,1%, the same as in August. Annual core inflation steadied at 4,1%.
Source: Statistics South Africa
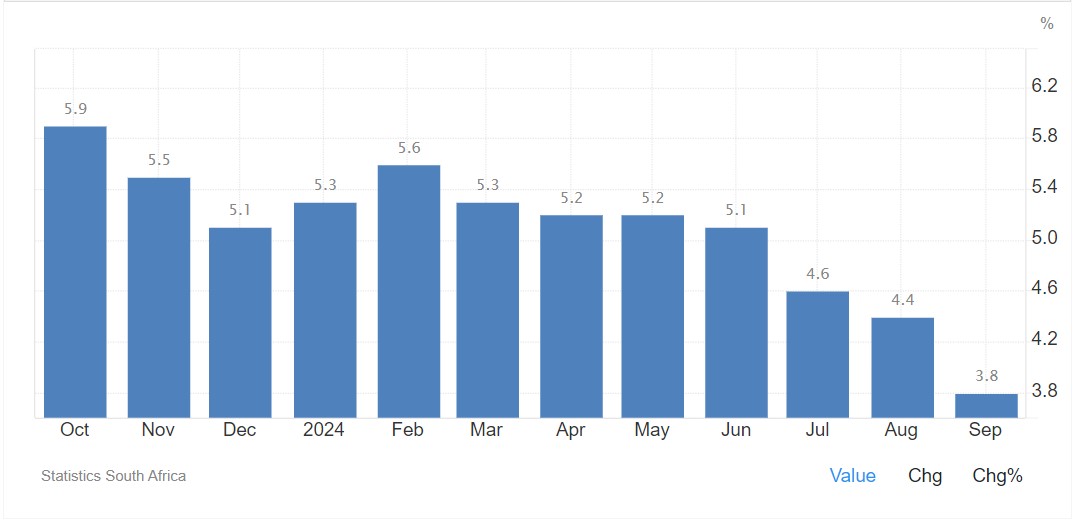
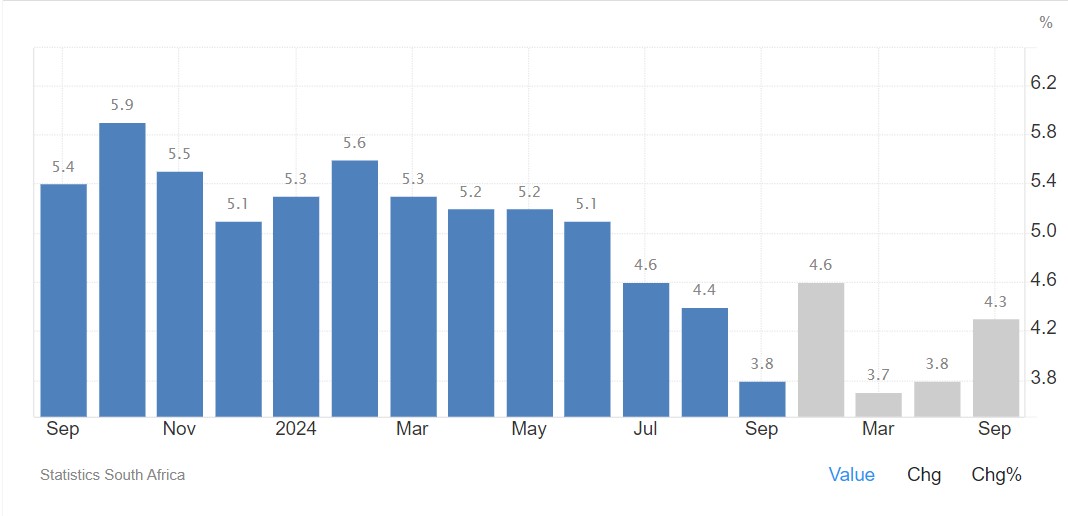
Inflation rate in South Africa decreased to 3,8% in September from 4,4% in August of 2024. Inflation rate in South Africa is expected to be 4,6% by the end of this quarter, according to Trading Economics global macro models and analysts’ expectations. In the long-term, the South Africa inflation rate is projected to trend around 4% in 2025 and 4,4% in 2026, according to our econometric models.
Source: https://tradingeconomics.com/south-africa/inflation-cpi
• Highlights in the agrochemical sector
China is currently the largest glyphosate supplier in the world. The dynamics of China’s glyphosate greatly impacts the global supply structure, over 80% of glyphosate produced in China is exported, to more than 20 destinations in the world.
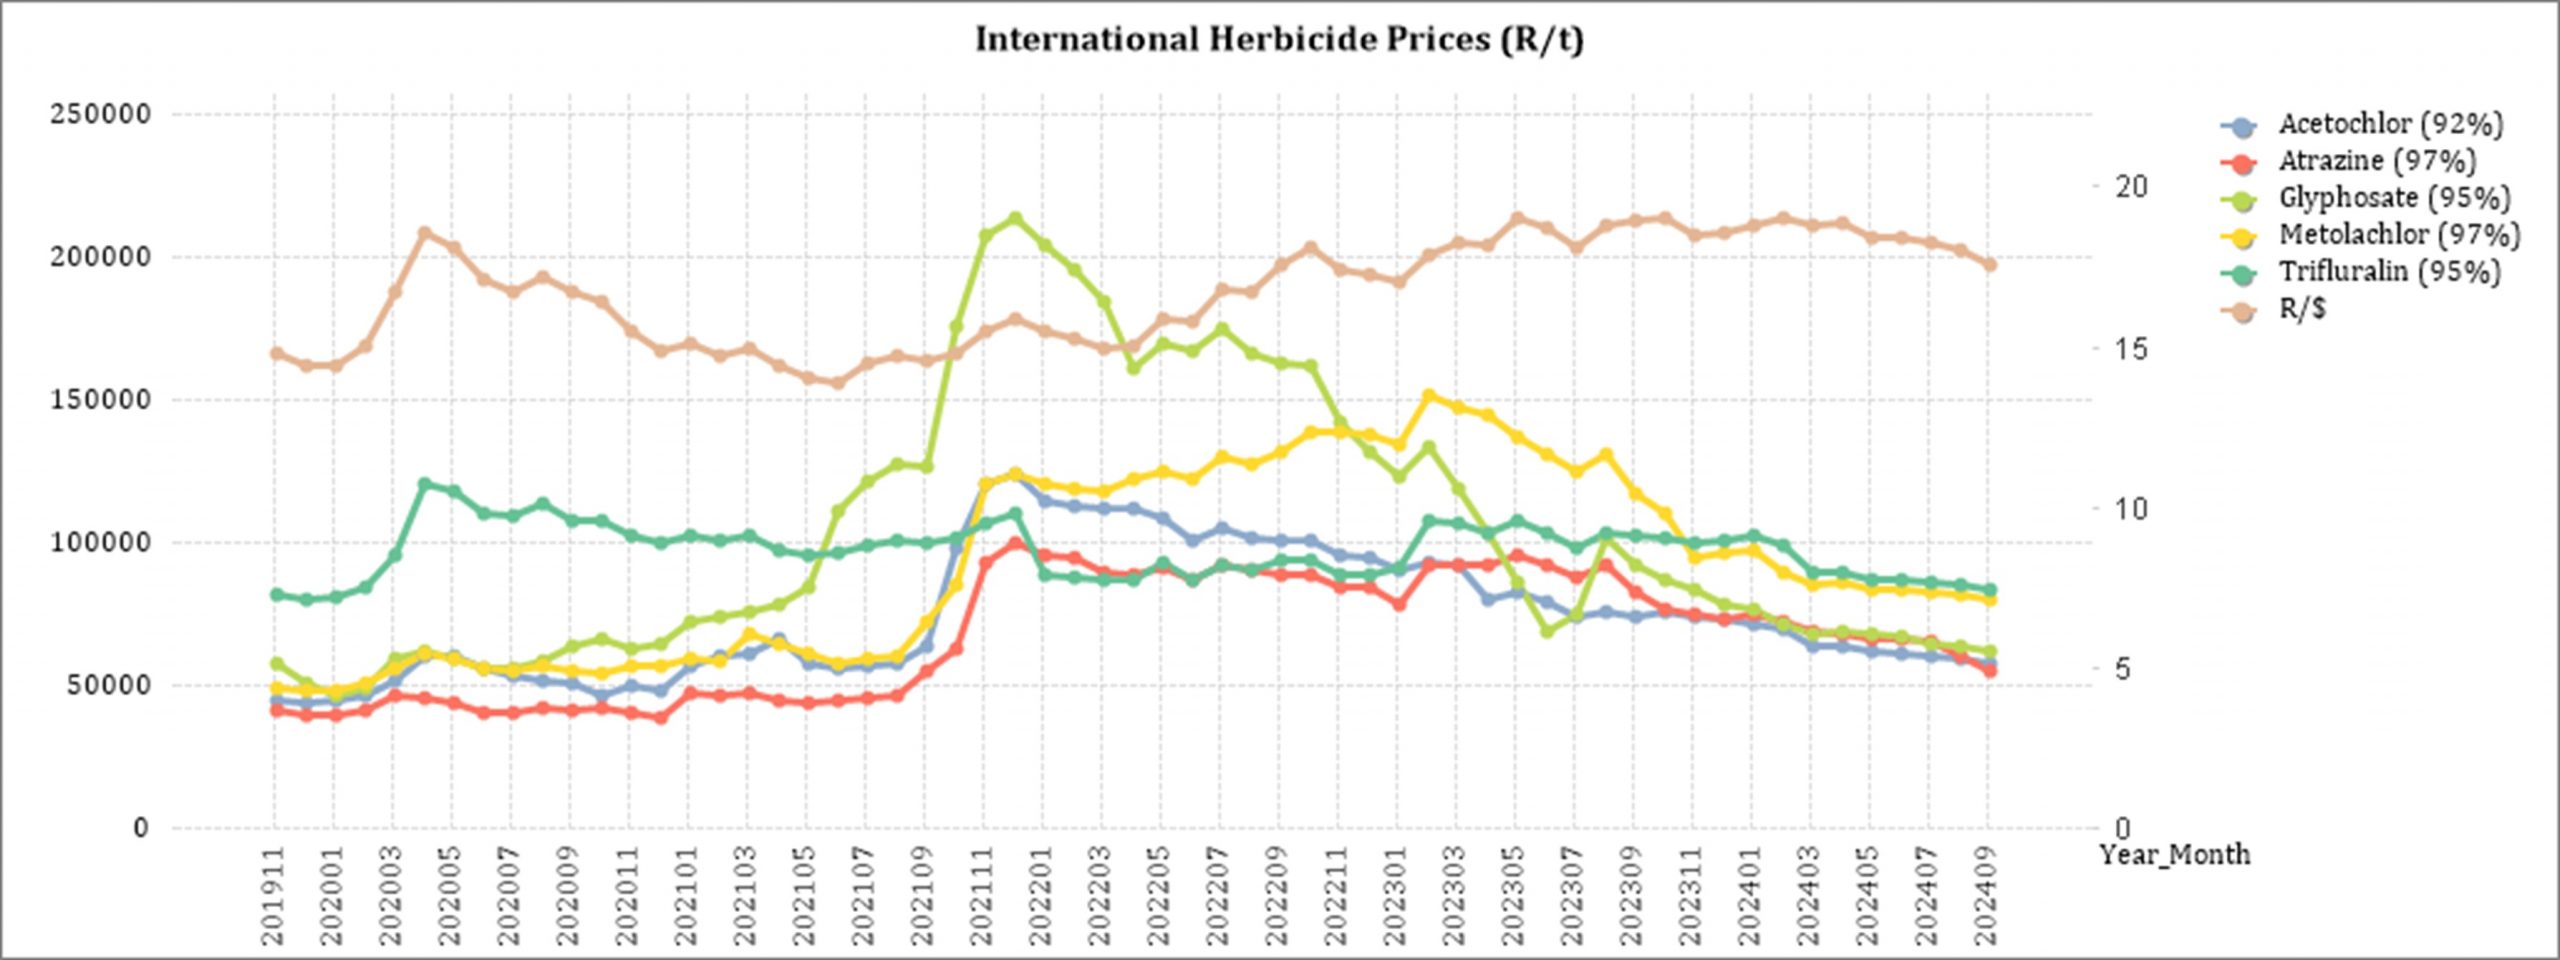
In China, the month-to-month analysis reveals a predominantly downward trend in the prices of most herbicides, insecticides, and fungicides in Dollar terms from July 2024 to August 2024. Specifically, the tables in this section indicate a 2% decrease in the rand terms of glyphosate (95%) during the same period.
The depreciation of the rand over the course of a year influences local prices, causing local prices to not decrease as much as in dollar terms. It is important to note that these international decreases in prices have not been experienced in the local market.
Source: Cnchemicals
Herbicides
The following products are the main products regarding herbicides that may have an impact on input costs for producers.
Glyphosate (95%)
Acetochlor (92%)
Atrazine (97%)
Metolachlor (97%)
Trifluralin (95%)
The following comparison is from the October 2024 Grain SA report which reports the previous month’s prices.

In comparison with the previous year’s prices, all of the products experienced a price decrease. Glyphosate had the biggest decrease with 33,66%.

For the two months compared all of the products experienced a price decrease. Atrazine experienced the highest price decrease with 9,44%.
The graph below shows the international herbicides prices (R/t) per product from November 2019 to date.
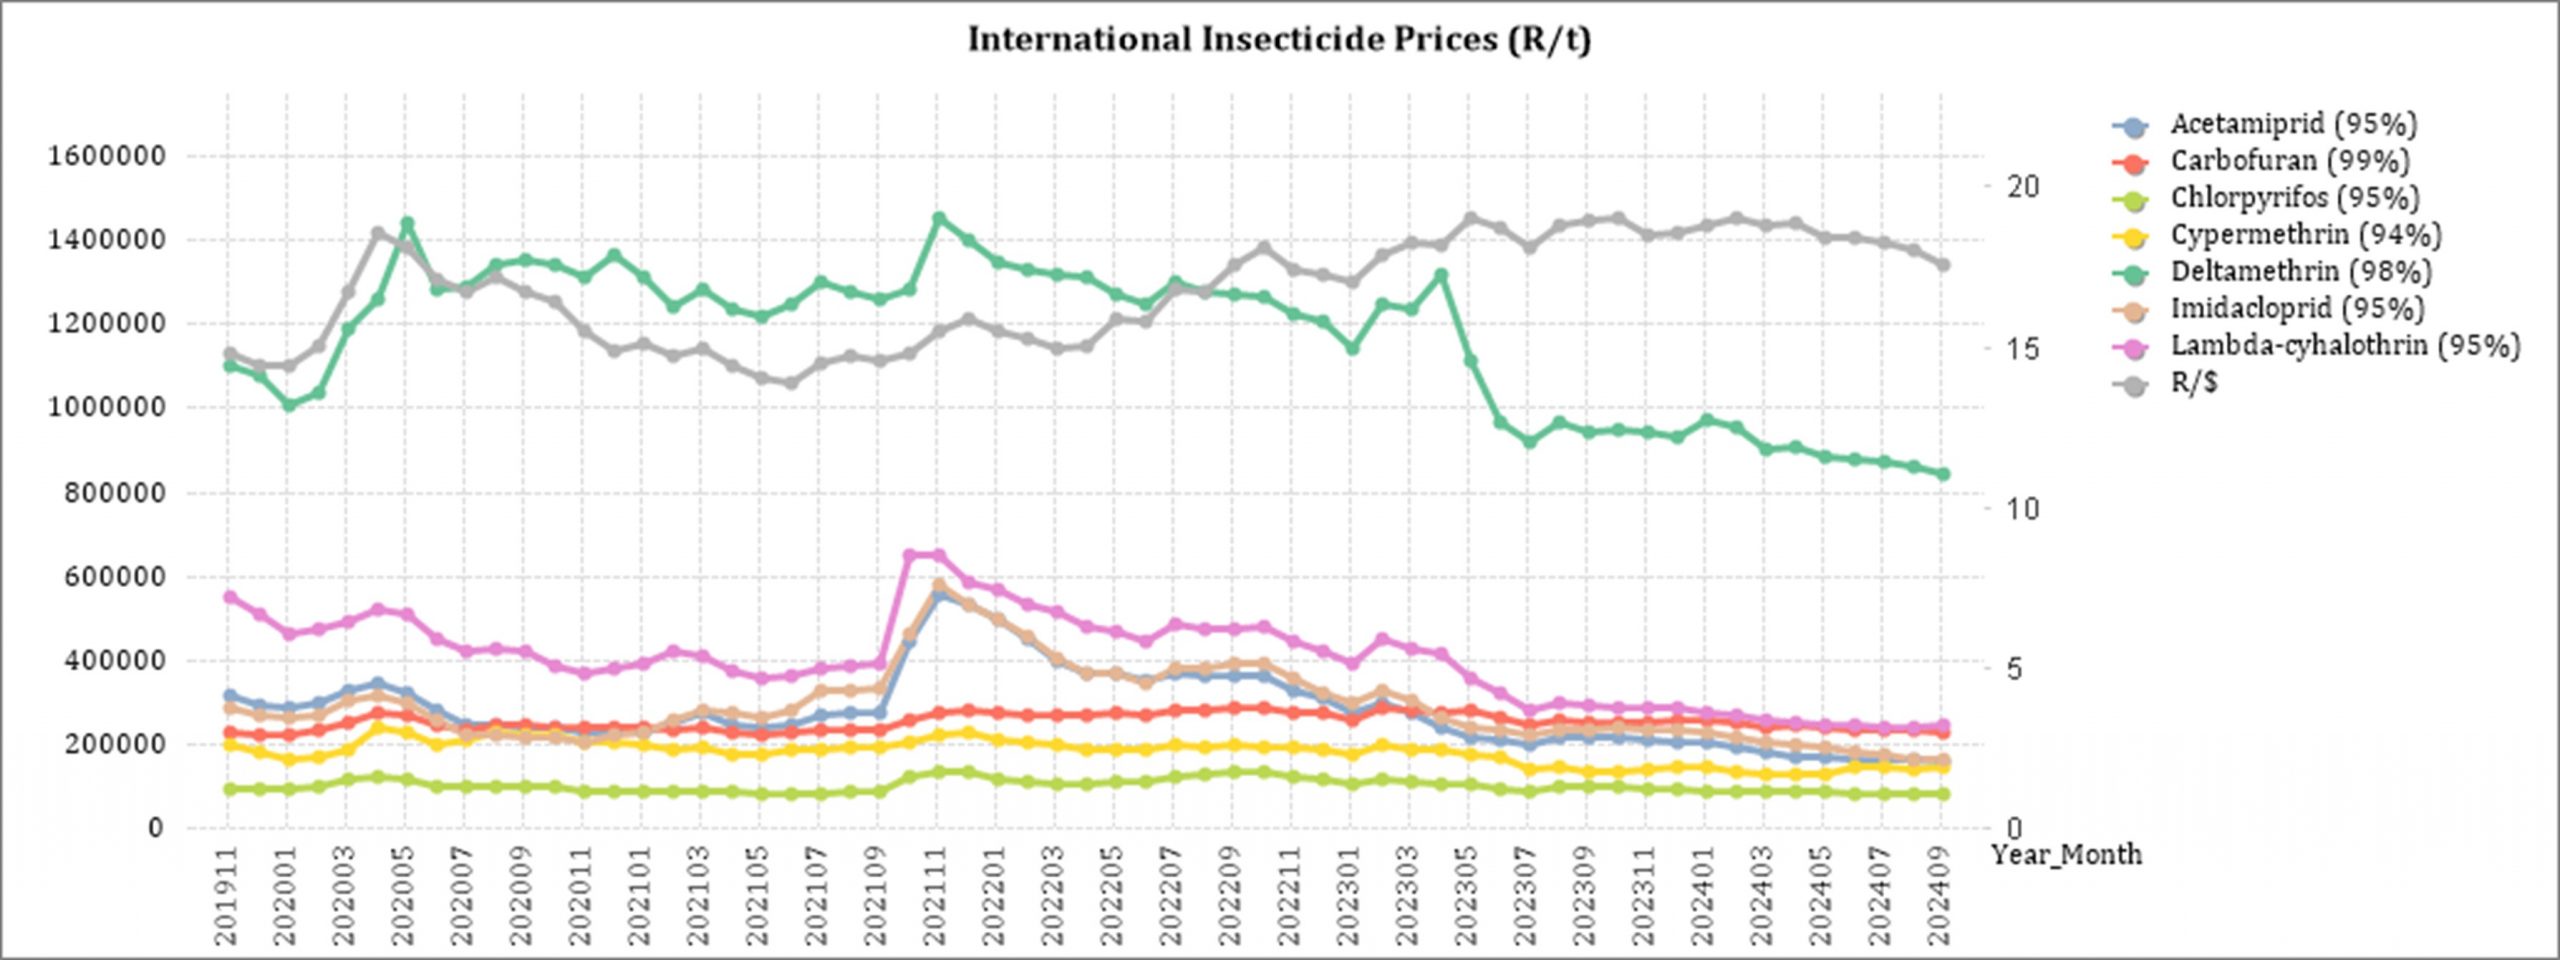
Insecticides
The following products are the main products regarding insecticides that may have an impact on input costs for producers.
Imidacloprid (95%)
Lambda-cyhalothrin (95%)
Carbofuran (99%)
Deltamethrin (98%)
Acetamiprid (95%)
Chlorpyrifos (95%)
Cypermethrin (94%)
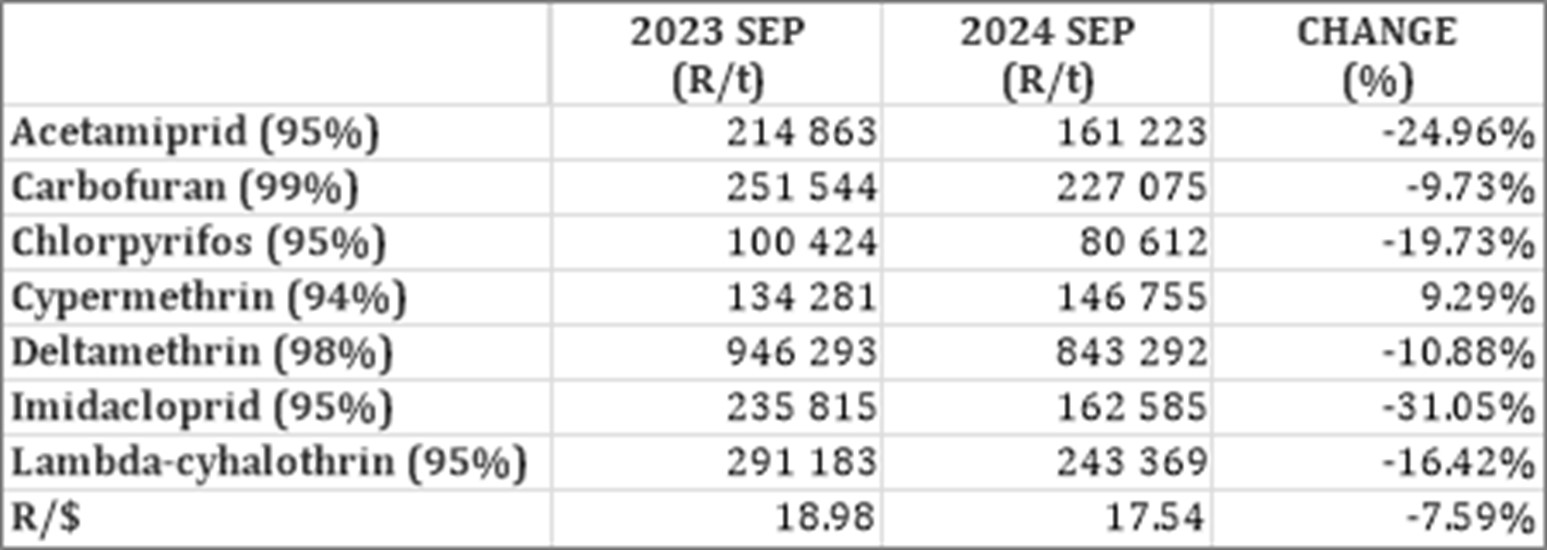
In comparison with the previous year’s prices, most of the products experienced a price decrease. Cypermethrin is the only one with a price increase of 9,29%
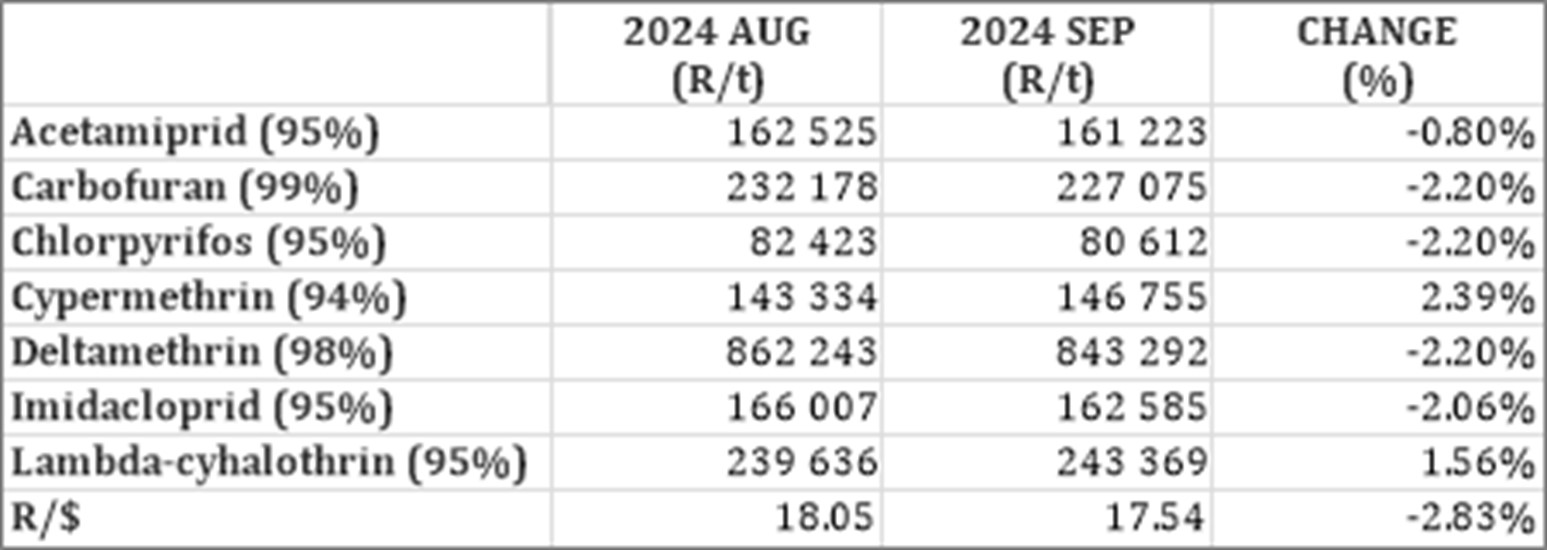
For the two months compared most of the products experienced a price decrease. Cypermethrin experienced the biggest price increase of 2,39%.
The graph below shows the international insecticide prices (R/t) per product from November 2019 to date.
Fertiliser
The following fertiliser products are being analysed:
Ammonia (Middle East)
Urea (46%) (Eastern Europe)
DAP (USA Gulf)
KCL (CIS)

In comparison with the previous year’s prices, all of the products experienced a price decrease with Urea decreasing the most (8,66%).

In comparison with the previous month’s prices, only one product experienced a price increase. Ammonia increased with 6,86%.
The graph below shows the international fertiliser prices (R/t) per product from November 2019 to date.
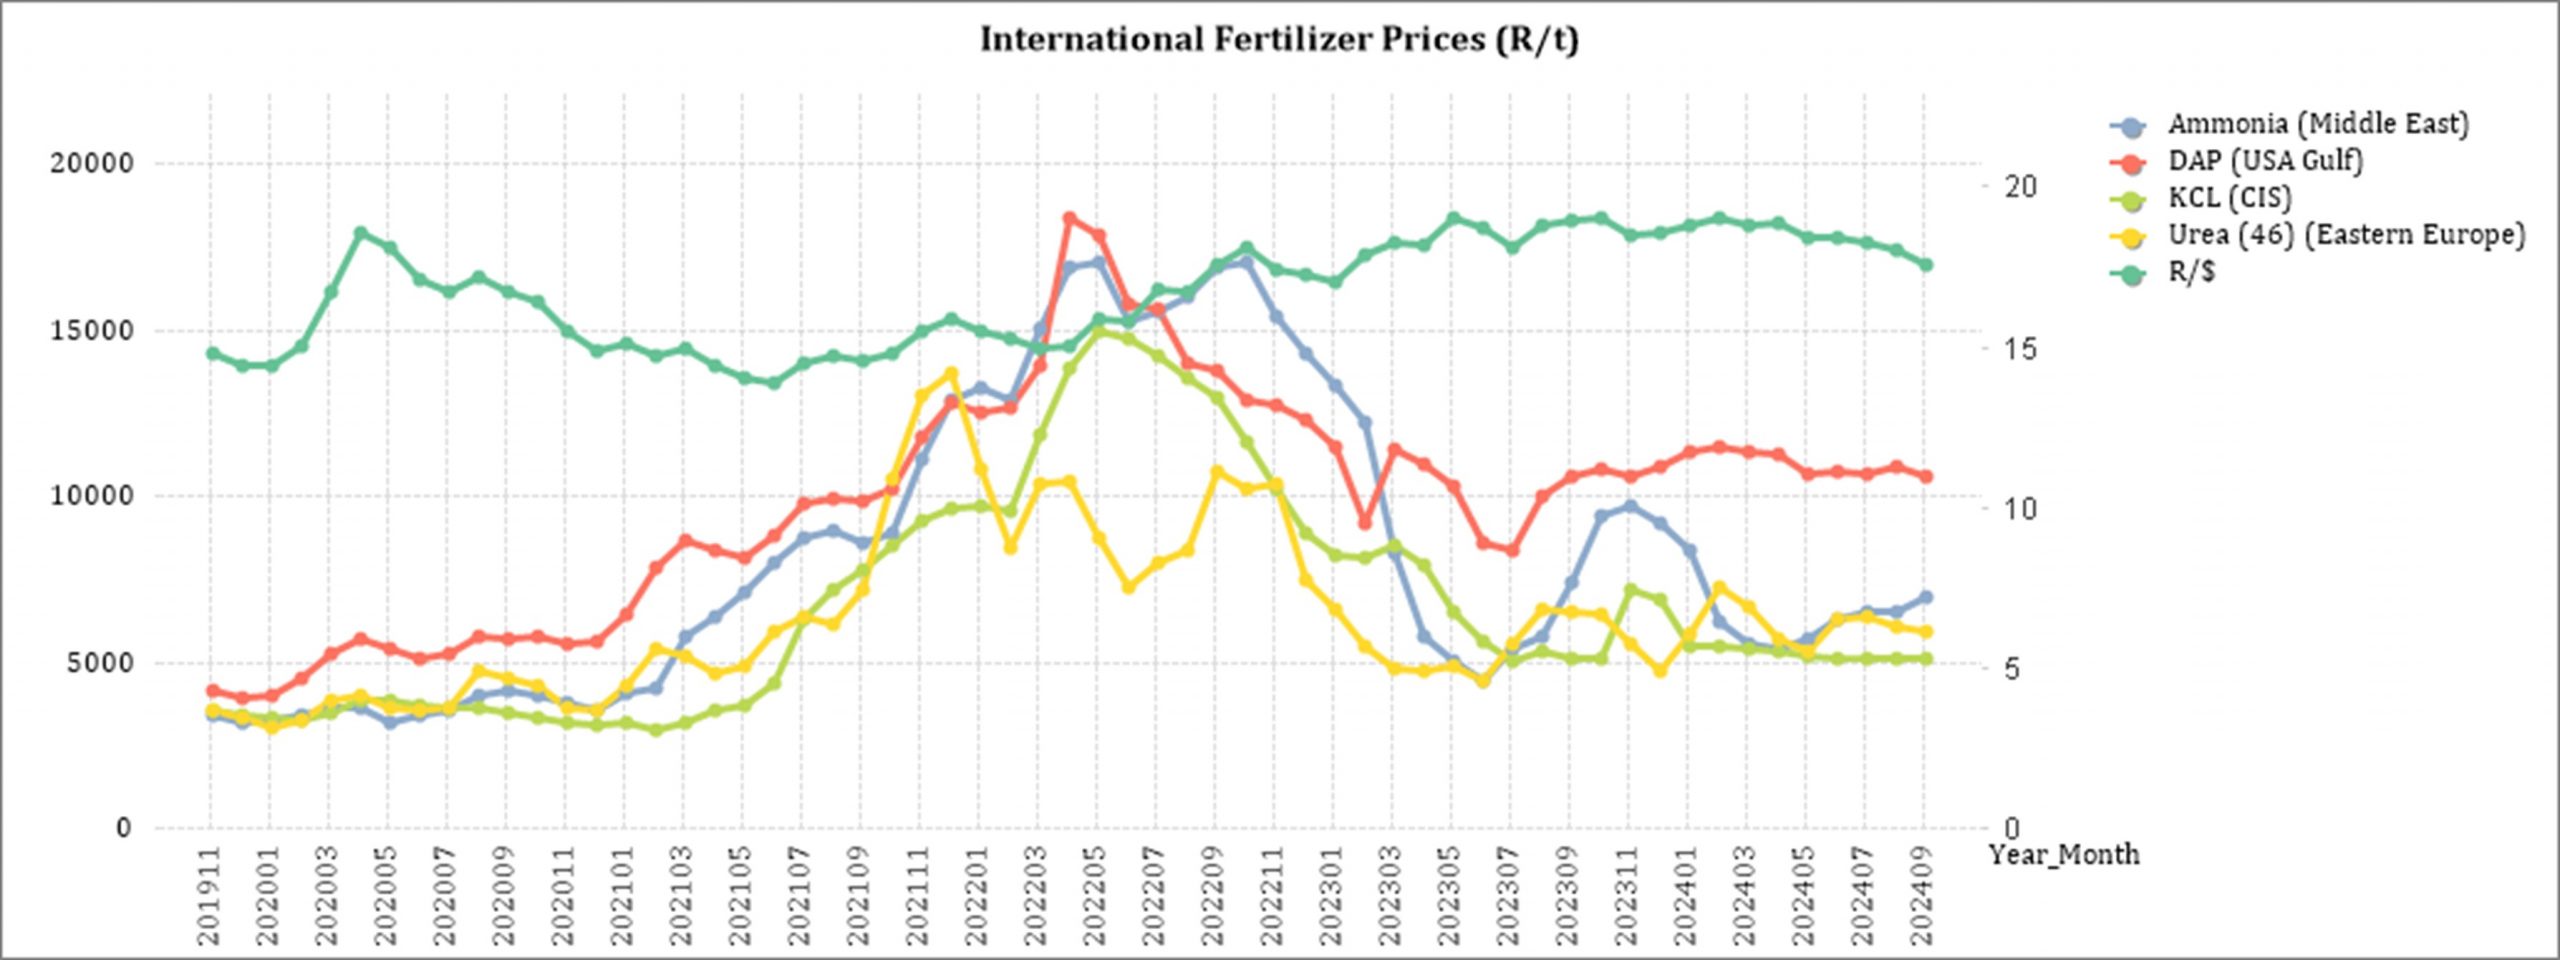
Urea: Due to the rising tension between Israel and Iran and the recent missile launching, lifted market fears. The Escalation in the Middel East have caused a number of trades, that were under discussion, to be abandoned as buyer chose to pull back on business that was not considered urgent. However, despite this unrest, the urea market managed to gain around $5/t – $7/t in most benchmark locations.
Ammonia: Prices continue to rise in the West as the latest Tampa contract price increased by $30/t to $560 CFR. Due to the high cost of natural gas feedstock in the region, the ammonia price in Europe is $600/t. Compared to the Western markets the Asian prices, that are gradually rising towards the mid-$400s, remain more cost-effective.
Phosphate: Indian demand is keeping DAP prices moving. The price in India increased by a few dollars and is currently trading in the mid-$640s. Most other markets saw unchanged prices and very minimal trading volumes. Buyers have reached the point where the prices area unworkable and are postponing purchases.
Potash: The potash prices experienced small, but insignificant, price movements. The South East Asian price increased slightly, while Brazil experienced a $5/t drop in prices. The El Niño conditions had a significant impact on this season’s palm oil crop, this is causing the SE Asian market to struggle, the potash price increase is also viewed as an anomaly with a small parcel being traded.
*CFR: Cost and Freight terms
Sources: FCurve /F Curve Insight
https://www.grainsa.co.za/upload/report_files/Chemical-and-Fertilizer-Report-Aug-2024.pdf
Source: Grain SA
Future prices
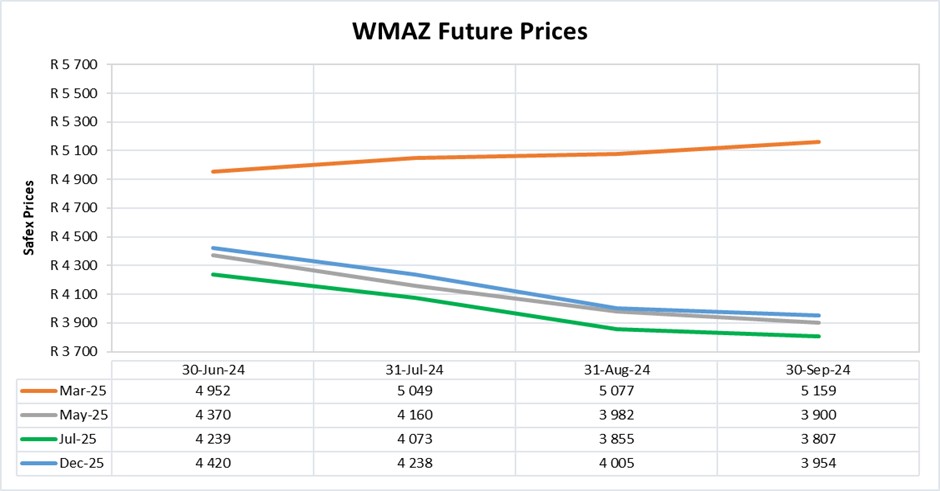
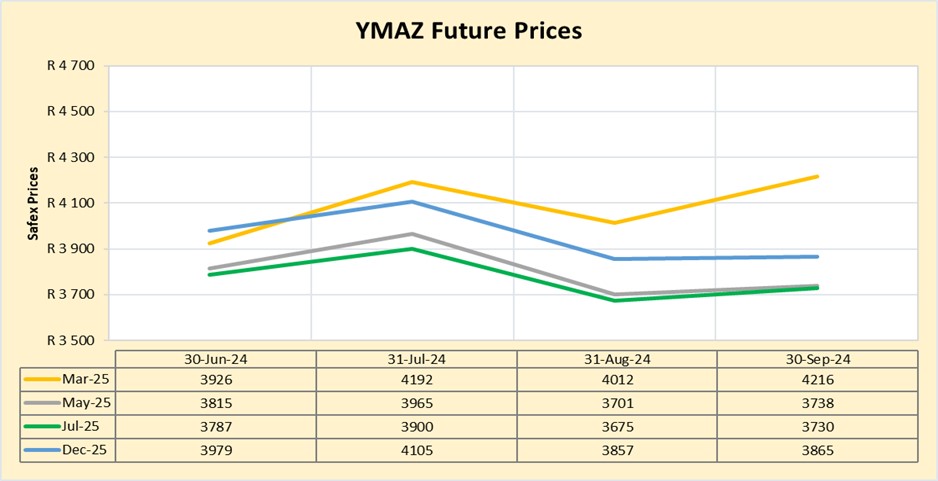
The graphs below illustrate the market sentiment for maize, in the form of future contracts, for the upcoming contract months. The market sentiment is the expectation of supply and demand fundamentals relating to white and yellow maize in South Africa.
DOMESTIC MARKET OVERVIEW
In short, the market is currently trading at an import parity level for the YMAZ due to the higher demand and lower supply in the current season resulting from a weak harvest. Because there is enough market information available regarding the current season the price level in the spot market can be easily understood, but this is not the case with the new season contracts or price levels.
Basically, a shortage of information pertaining to the new season is present, thus the new season price levels are uncertain about the market conditions yet to develop. This means the new season contracts are trading between import and export parity without certainty of which way the market will move. As more information regarding the new season develops, regarding precipitation quantity and hectares planted are confirmed, the prices will adjust accordingly. The WMAZ price level is linked to the YMAZ price level, but regarding the import and export parity we refer to YMAZ.
Sources: SAGIS/CEC/Senwes/Victor Esterhuizen, Junior Grain Trader, Grain Trading
Fraud risk
FRAUD AWARENESS
Fraud manifests in numerous forms, but the challenge of recovering stolen assets remains consistent. Over the coming months, this section will explore various types of cyber fraud, provide real-world examples, and offer practical prevention strategies to help safeguard against these threats.
Ransomware attacks
Ransomware is a particularly aggressive type of cyber fraud where malicious software breaches computer systems, encrypts files, and demands a ransom payment for their decryption. Victims are often faced with a distressing dilemma: pay the ransom to regain access to their data or risk losing it forever.
The infamous WannaCry and NotPetya attacks serve as stark reminders of how ransomware can unleash widespread disruption and significant financial damage. These incidents underscore the critical importance of robust cybersecurity measures.
- Cyber fraud example: In May 2017, the WannaCry ransomware infected hundreds of thousands of computers globally. Exploiting a vulnerability in Microsoft Windows, the malware encrypted files and demanded ransom payments in Bitcoin. The attack affected hospitals, businesses, and government agencies, highlighting the widespread disruption that ransomware can cause.
Cyber fraud prevention strategy
Stay Informed and Educated. Awareness is the first line of defence. Regularly update yourself on the latest cyber threats, tactics, and prevention measures. Understanding the evolving nature of cyber fraud enhances your ability to recognize and avoid potential risks.
Source: https://www.acfe.com/-/media/files/acfe/pdfs/rttn/2024/2024-report-to-the-nations.pdf pg68-69


