
The NWK Limited external factors report provides an overview of the main external factors that NWK and its clients are exposed to at a specific point in time. This report opts to aid in a timely basis to foresee external market and other factors that may have an impact on any business and clients. The main focus of this information is to have a closer look at external factors that can affect any business and our customers.
Executive summary
The National Agricultural Marketing Council (NAMC) predicts 30 April 2022 ending stock for white and yellow maize to exceed that of the 2020/2021 season. Their forecast for white maize for the season is that of an excellent harvest. The estimated maize crop is 7% bigger than the 2020 crop. The three main maize producing areas, namely the Free State, Mpumalanga and North West provinces are expected to produce 84% of the 2021 crop.
The repo rate has been cut by 300 basis points this year to help mitigate the economic fallout of the Covid-19 pandemic. The repo rate is currently 3,5% and the prime lending rate 7%.
Market risk
1. Grain market analysis
- Ending stock – national
Ending stock data is gathered from the NAMC. The estimates are reassessed and reported by the Grain and Oilseeds Supply and Demand Estimates Committee. The following is a summary of the September 2021 ending stock estimates for the 2020/2021 season:
- Wheat = 537 208 tons
The following is a summary of the February 2022 ending stock estimates for the 2021/2022 season:
- Sunflower => 47 604 tons
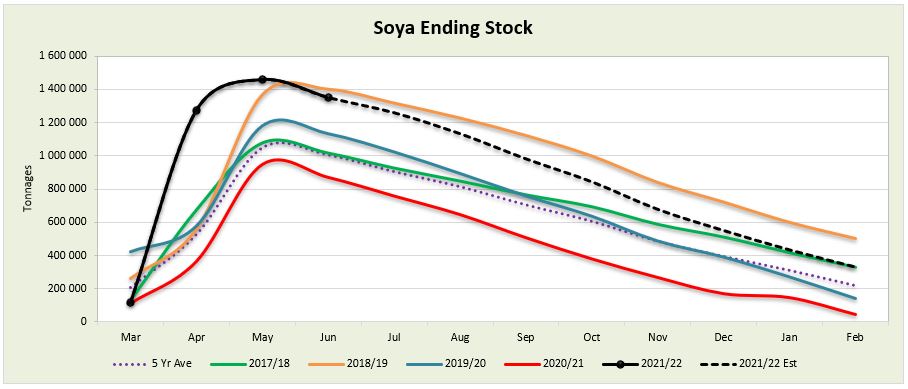
- Soybeans => 330 603 tons
- Sorghum => 89 365 tons
The following is a summary of the April 2022 ending stock estimates for the 2021/2022 season in tonnages:
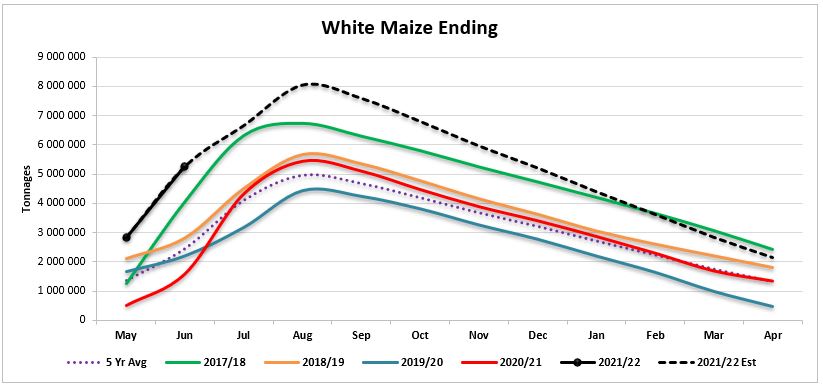
- White maize => 2 160 732 tons
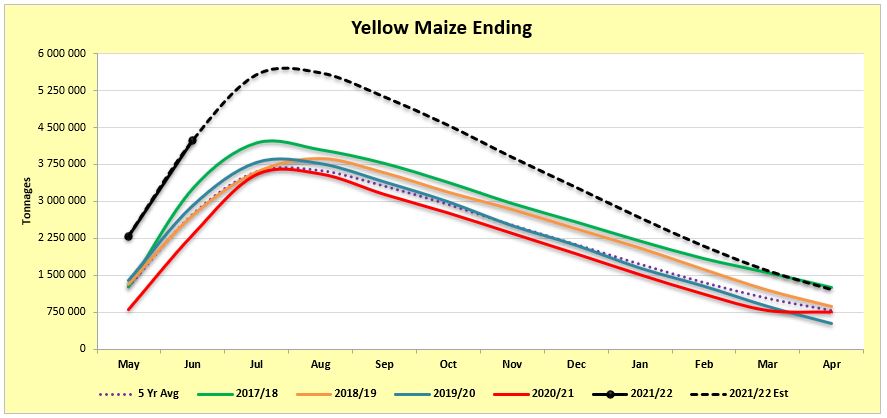
- Yellow maize => 1 210 982 tons
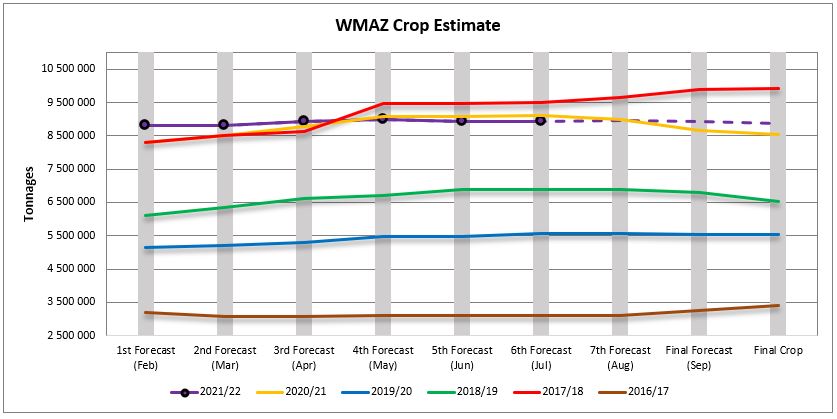
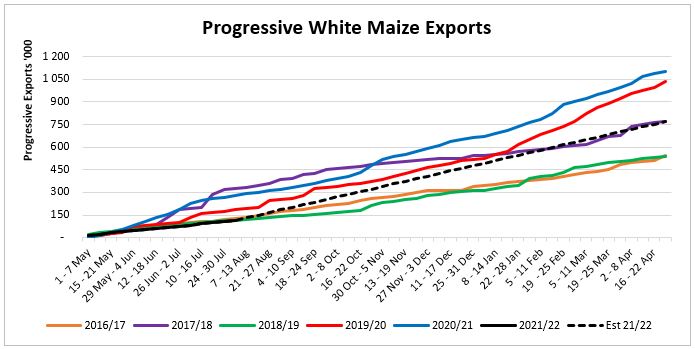
Graph 1 shows white maize ending stock for April 2022 that are 805 779 tons or 59% more than the 2020/2021 season. Graph 2 shows a 449 029 tons or a 59% increase in ending stock estimation for the 2021/2022 season over the previous season.
Source: Sagis
Source: Sagis
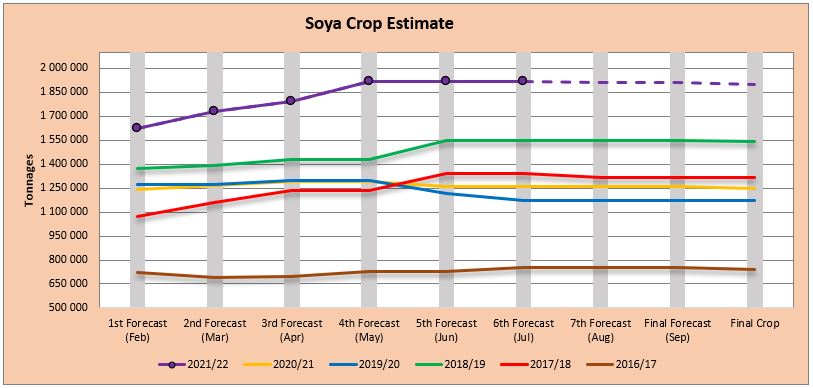
The actual soya ending stock for February 2022 is 284 550 tons more than February 2021 (Graph 3).
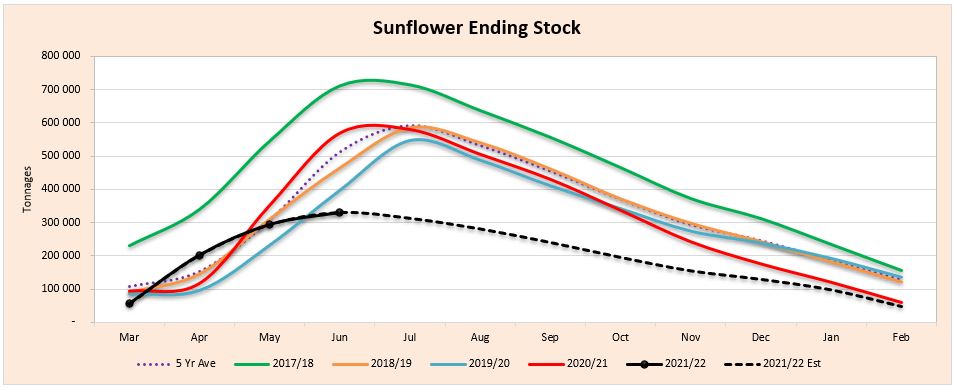
The actual sunflower ending stock is 22% (13 360 tons) less than the previous seasons ending stock (Graph 4).
Source: Sagis
Source: Sagis
- Crop estimations
According to the Crop Estimate Committee (CEC) the size of the expected commercial maize crop has been set at 16,431 million tons, which is 1,22% or 198 500 tons more than the previous forecast of 16,233 million tons. The area estimate for maize is 2,755 million hectares, while the expected yield is 5,96 t/ha. The estimated maize crop is 7% bigger than the 2020 crop. The three main maize producing areas, namely the Free State, Mpumalanga and North West provinces re expected to produce 84% of the 2021 crop.
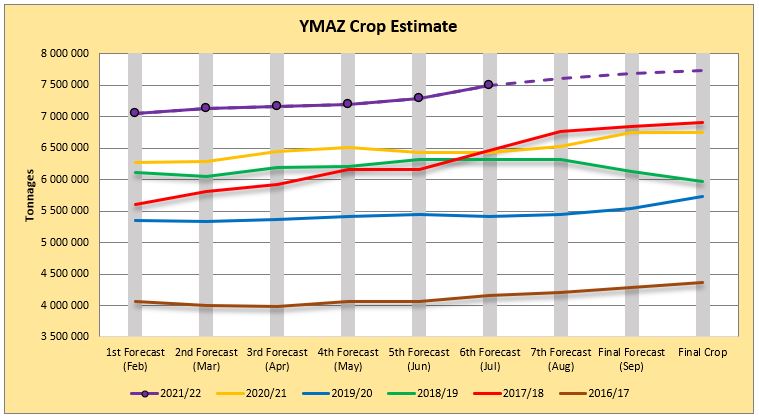
The area estimate for white maize (Graph 5) is 1,692 million hectares and for yellow maize the area estimate is 1,064 m million hectares. The production forecast of white maize remained unchanged at 8,937 million tons against the previous estimate. The yield for white maize is 5,28 t/ha. In the case of yellow maize (Graph 6) the production forecast is 7,494 million tons, which is 2,72% or 198 500 tons more than the 7,296 million tons of the previous forecast. The yield for yellow maize is 7,05 t/ha.
Source: CEC
Source: CEC
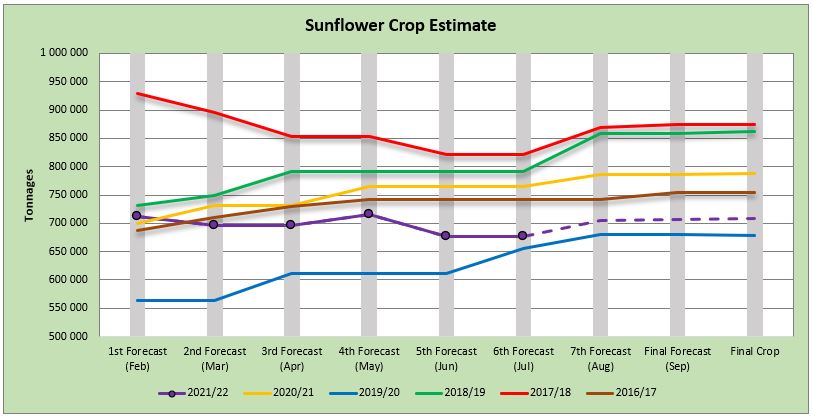
The production forecast for sunflower seed (Graph 7) remained unchanged at 677 240 tons. The area estimate for sunflower seed is 477 800 ha, while the expected yield is 1,42 t/ha.
Source: CEC
The production forecast for soybeans also remained unchanged at 1,918 mill. tons. The estimated area planted to soybeans is 827 100 ha and the expected yield is 2,32 t/ha (Graph 8).
Source: CEC
- Imports and exports – national
Source: Sagis
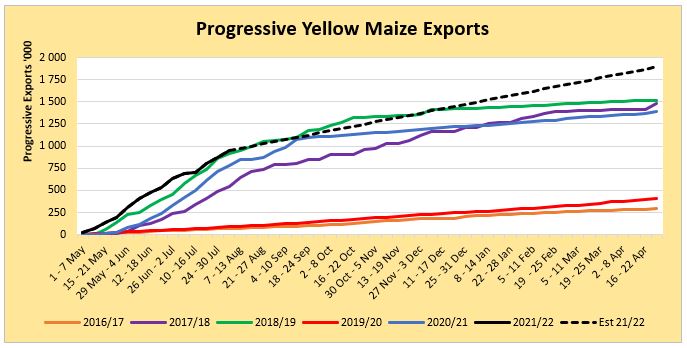
To date, 115 792 tons of white maize (Graph 9) and 949 823 tons (Graph 10) of yellow maize have been exported since the beginning of May 2021.
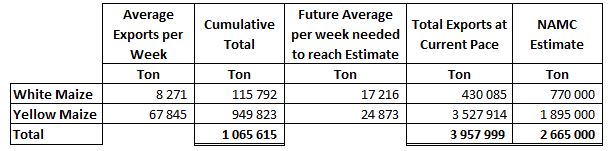
As seen in Table 1 the average white maize exports per week are currently 8 271 tons. If theoretically, white maize exports remain at the current average of 8 271 tons per week then there would be 339 915 tons less white maize exports than anticipated.
The average yellow maize exports per week are currently 67 845 tons. If theoretically, yellow maize exports remain at the current average of 67 845 tons per week then there would be 1 632 914 tons more yellow maize exports than anticipated (Graph 10).
Source: Sagis
- Parity prices
South Africa is a small producer compared to other countries and is thus a price taker (meaning that we cannot influence world prices). Because of this, our local prices are normally between import and export parity, which is illustrated in which is illustrated in Graphs 11 and 12. An import parity price is defined as the price which a buyer will pay to buy the product on the world market. This price will include all the costs incurred to get the product delivered at the buyer’s destination.
An export parity price is defined as the price that a local seller could receive by selling his product on the world market for example, excluding the export costs. The price which the seller obtains is based on the condition that he deliver the product at the nearest export point (usually a harbour) at his own expense.
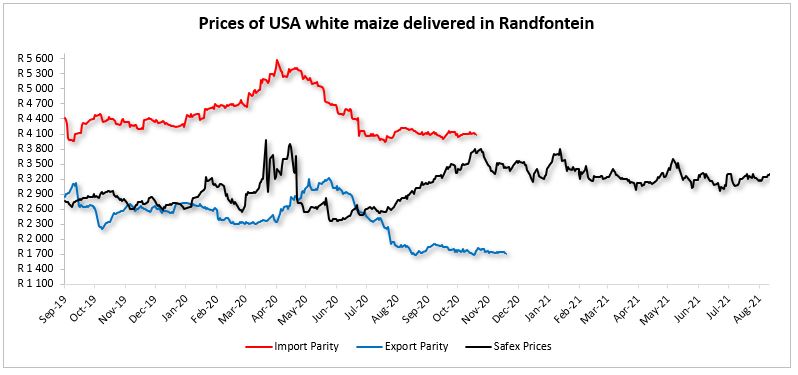
Source: Grain SA (No further import and export parity data available for white maize)
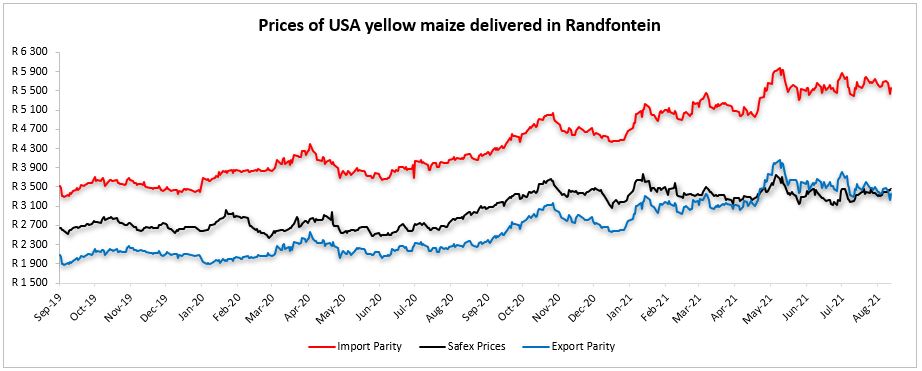
Source: Grain SA
- Producer deliveries – provincial
For the marketing year which is May to April the Free State province dominates the white maize that is used for human consumption and gristing. North West showed a significant increase for the 2020/2021 season with a 1% rise over the previous season (Graph 13).
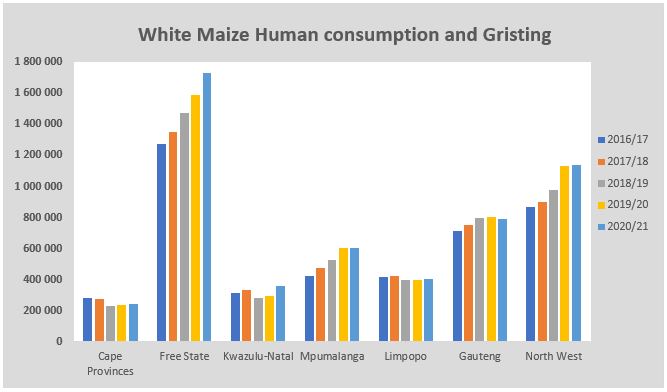
Source: Sagis
North West have a decreasing trend in yellow maize which is used for consumption and gristing. Only 18 563 tons of yellow maize was used in the 2020/2021 season that ended April 2021 (Graph 14).
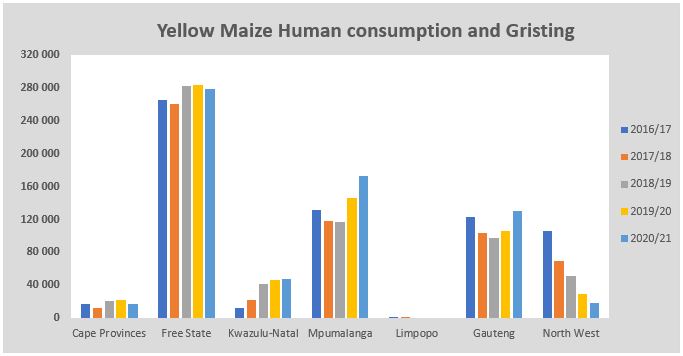
Source: Sagis
- Exchange rate
NWK Group is exposed to foreign exchange rate risk on various business areas, such as commodity prices and trade imports.
Source: Standard Bank, Corporate and Investment Banking & SARB
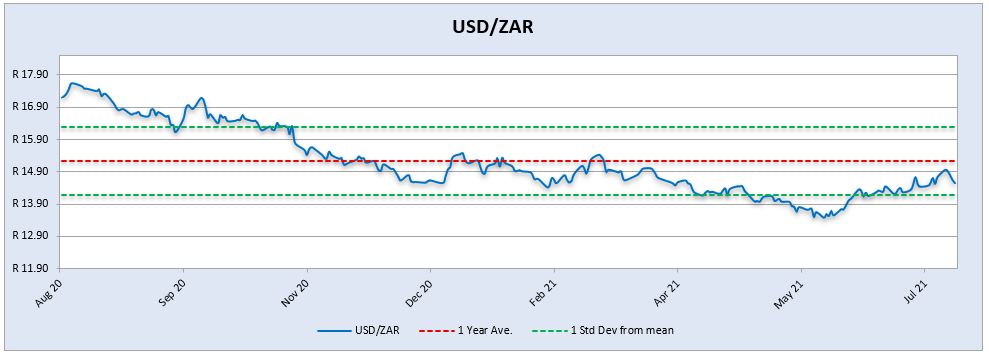
On a monthly average basis, the rand depreciated against the US dollar with 4,4% (0,61c) over the period June 2021 to July 2021. The one-year average for rand/US dollar is R15,23. Moreover, the average rand/US dollar exchange rate for the period July 2021 was R14,54 compared to R13,92 of June 2021 (Graph 15).
According to Moneyweb the rand dropped to a three-month low on 13 July 2021, local and hard currency bonds suffered as violent protests over economic hardship and inequality rippled across the country.
Exchange rate forecast: Graph 16 shows the actual USD/ZAR for 2021 Quarter 1 (Q1) and 2021 Quarter 2(Q2) against the forecasted figures. Trading Economics’s forecast for 2021 Q1 was the closest to actual and The Economy Forecast Agency’s forecast for 2021 Q2 was the closest to actual. According to Nedbank and Trading Economics the rand will strenghten in the year 2021 but Absa and The Economy Forecast Agency say the opposite.
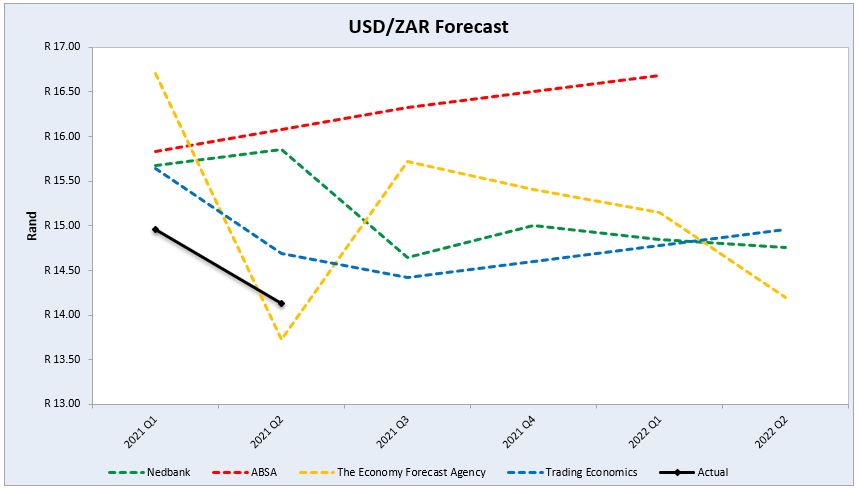
Source: Nedbank CIB; Absa; The Economic Forecast Agency; Trading Economics
- Future prices
Graphs 17 and 18 illustrate the market sentiment for maize, in the form of future contracts, for the upcoming contract months. The market sentiment is the expectation of supply and demand fundamentals relating to white and yellow maize in South Africa.
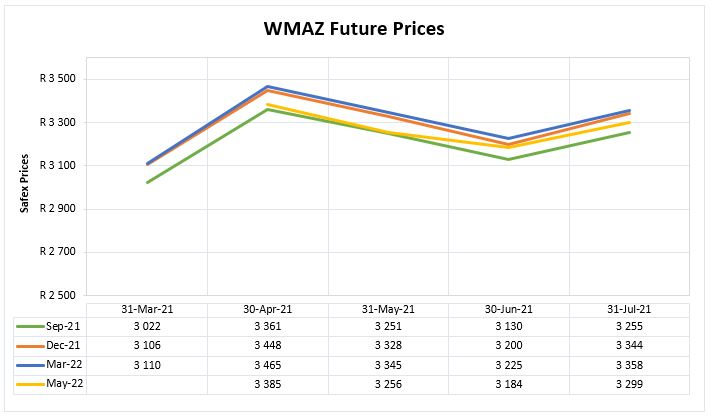
Source: Sagis
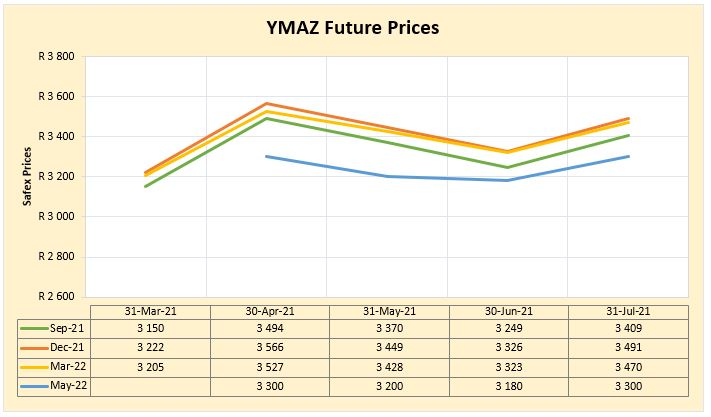
Source: Sagis
WEATHER AND CLIMATE
ENSO-neutral conditions continued during August, with near-to-below average sea surface temperatures observed across most of the equatorial Pacific Ocean. Subsurface temperature cooled in July reflecting the emergence of below-average subsurface temperatures east of the Date Line.
La Niña chances increase to above 50% during the months of August 2021 until March 2022.
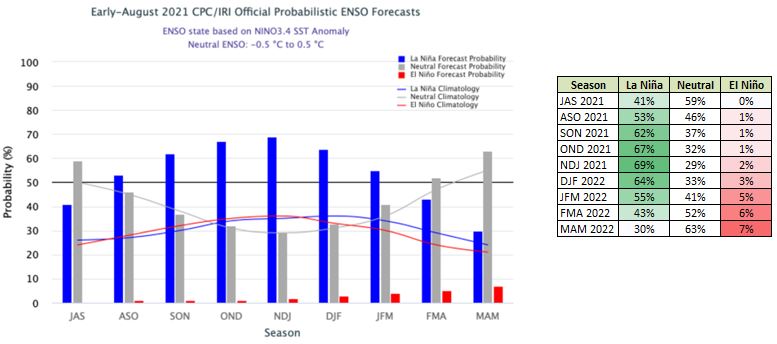
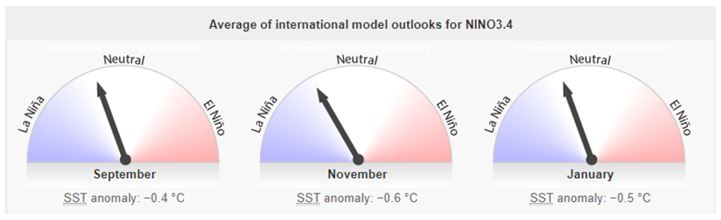
The El Niño-Southern Oscillation (ENSO) is neutral. The model outlooks for NINO 3.4 indicates that the central tropical Pacific will cool in the coming months with three models predicting the cooling will be sufficient to meet La Niña thresholds during spring.
INTEREST RATE RISK
On 27 March 2020, Moody’s downgraded South Africa’s sovereign credit rating to sub-investment grade and placed a negative outlook on the rating. The key drivers for this downgrade include weak economic growth, continuing deterioration in fiscal strength, and slow progress on structural economic reforms. It is now the first time in post-apartheid South Africa where all major rating agencies, that is, Moody’s, Fitch and S&P, have South Africa’s credit ratings in sub-investment grade territory.
The COVID-19 pandemic forced the South African Reserve Bank to make a number of interest rate cuts to bring relief to the economy. Interest rate movement:
- 20 March 2020 – 8,75%
- 15 April 2020 – 7,75%
- 22 May 2020 – 7,25%
- 23 July 2020 – 7,00%
Since the meeting in July the interest rate stayed unchanged.

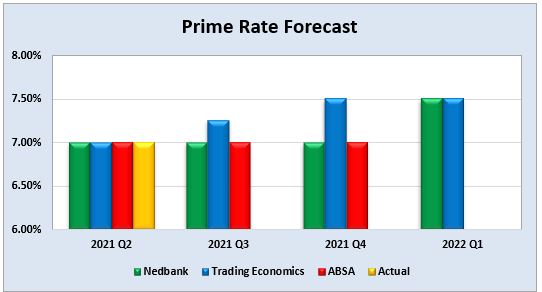
Graph 19 shows the prime rate forecast for 2021 Q2 to 2022 Q1. Trading Economics’ forecast that the prime interest rate will increase with 25 basis points for 2021 Q3 and again for 2021 Q4. The next MPC meeting date is 23 September 2021.
Fraud risk
FRAUD AWARENESS
SymQuest believes that business data is more vulnerable than ever before. Cybersecurity is necessary for NWK to efficiently operate. It is also critical for protecting our customers’ information.
Following IT best practices goes beyond using the latest technology; it’s about staying ahead of risks and disasters. When creating cybersecurity procedures, SymQuest suggests using a layered security model. This model begins with the internet and ends with the company employees. The fourth point in this layered security model that will be referred to is employee education. In the coming reports, additional points of the model will be included.

With cybersecurity becoming such an important component of almost any business The Committee of Sponsoring Organisations of the Treadway Commission (COSO) plans to issue detailed recommendations on how organizations can better manage risks related to cloud computing, artificial intelligence and outside contractors, among other topics in the year ahead.
The Ppresident signed the Cybercrime Bill into law on 26 May 2021. According to Michalsons the Cybercrimes Act will only come into operation on a date fixed by the President. The law will effectively deal with cybercrimes.
FRAUD TIP
The fraud prevention tip for this month is: Update your software.
In order to protect your organisation against cyber criminals, install an antivirus software and update it regularly, create backup copies and make use of external technology experts where necessary. Software which is outdated cannot adequately protect your information. Software updates are important and they do a lot of things. They often include repairing security holes that have been discovered and they might fix or remove computer bugs. Updates can also add new features to your devices and remove outdated ones to ensure optimal functionality.


