
The NWK Limited external factors report provides an overview of the main external factors that NWK and its clients are exposed to at a specific point in time. This report opts to aid in a timely basis to foresee external market and other factors that may have an impact on any business and clients. The main focus of this document is to have a closer look at external factors that can affect any business and our customers.
Executive summary
The National Agricultural Marketing Council (NAMC) predicts 30 April 2022 ending stock for white and yellow maize to exceed that of the 2020/2021 season. Their forecast for white maize for the season is that of an excellent harvest. The estimated maize crop is 7% bigger than the 2020 crop. The three main maize producing areas, namely the Free State, Mpumalanga and North West provinces are expected to produce 84% of the 2021 crop.
The repo rate has been cut by 300 basis points this year to help mitigate the economic fallout of the COVID-19 pandemic. The repo rate is currently 3,5% and the prime lending rate 7%.
Market risk
1. Grain market analysis
- Ending stock – national
Ending stock data is gathered from the NAMC. The estimates are reassessed and reported by the Grain and Oilseeds Supply and Demand Estimates Committee. The following is a summary of the September 2021 ending stock estimates for the 2020/2021 season:
- Wheat = 563 608 tons
The following is a summary of the February 2022 ending stock estimates for the 2021/2022 season:
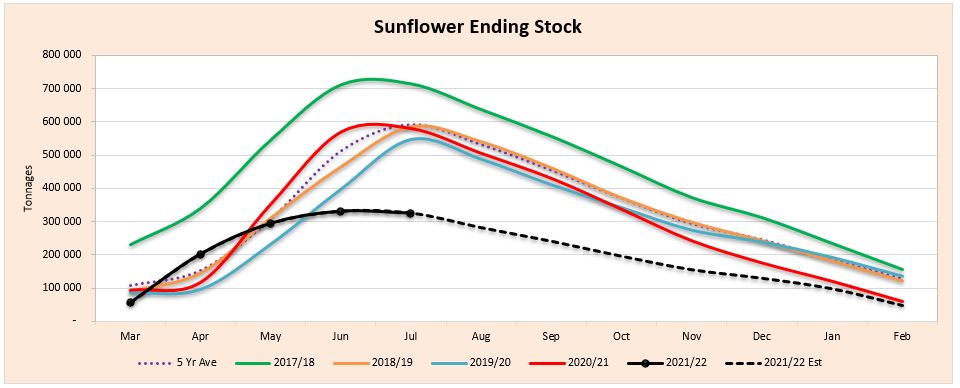
- Sunflower => 47 504 tons
- Soybeans => 302 503 tons
- Sorghum => 99 265 tons
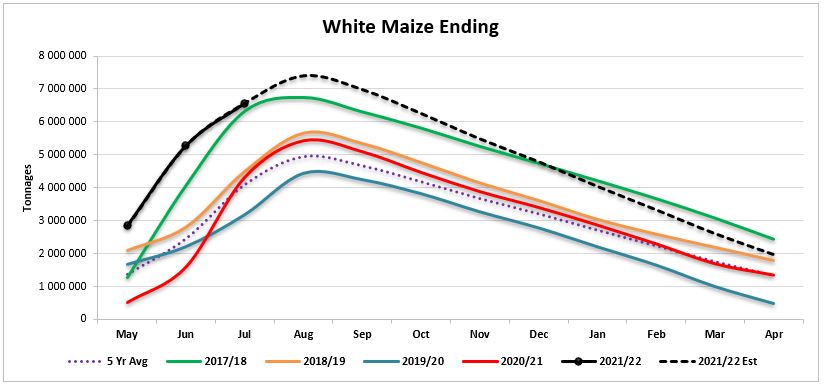
The following is a summary of the April 2022 ending stock estimates for the 2021/2022 season in tonnages:
- White maize => 1 987 482 tons
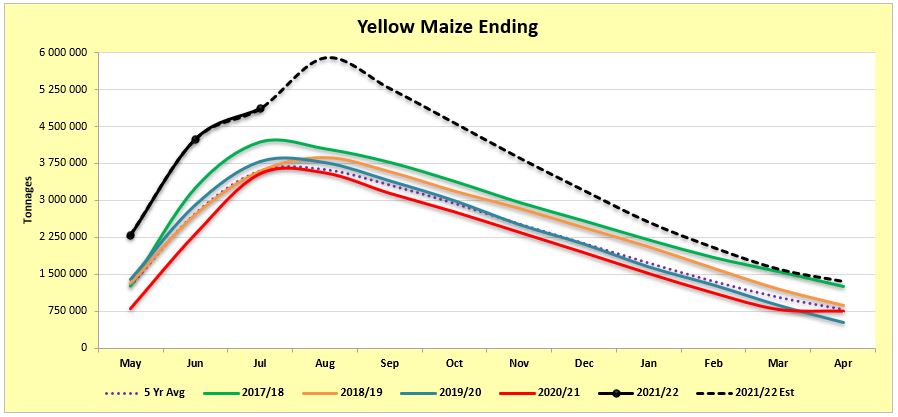
- Yellow maize => 1 348 382 tons
Graph 1 shows white maize ending stock for April 2022 which is 632 529 tons or 47% more than the 2020/2021 season. Graph 2 shows a 586 429 tons or a 77% increase in ending stock estimation for the 2021/2022 season over the previous season.
Source: Sagis
Source: Sagis
The actual soya ending stock for February 2022 is 256 450 tons more than February 2021 (Graph 3).
The actual sunflower ending stock is 22% (13 460 tons) less than the previous seasons ending stock (Graph 4).

Source: Sagis
Source: Sagis
- Crop estimations
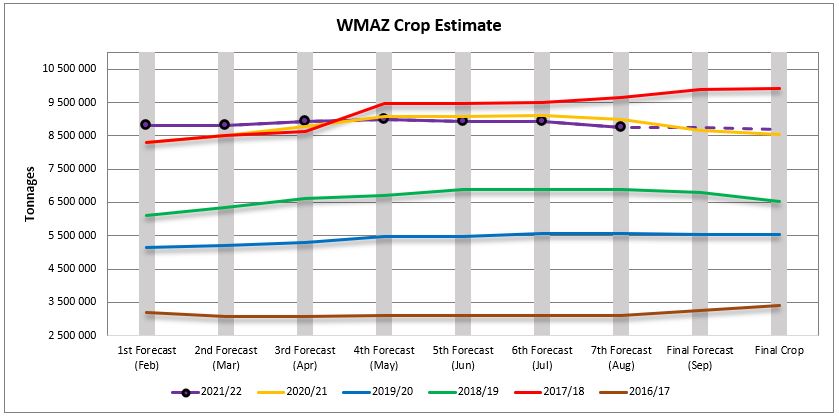
According to the Crop Estimate Committee (CEC) the size of the expected commercial maize crop has been set at 16,316 million tons, which is 0,7% or 114 850 tons less than the previous forecast of 16,431 million tons. The area estimate for maize is 2,755 million hectares, while the expected yield is 5,92 t/ha. The estimated maize crop is 7% bigger than the 2020 crop. The three main maize producing areas, namely the Free State, Mpumalanga and North West provinces re expected to produce 84% of the 2021 crop.
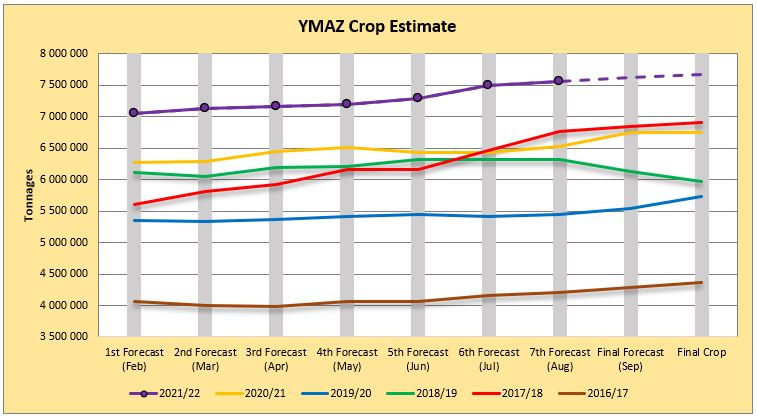
The area estimate for white maize (Graph 5) is 1,692 million hectares and for yellow maize the area estimate is 1,064 million hectares. The production forecast of white maize decreased by 172 250 tons against the previous forecast, from 8,937 million tons to 8,765 million tons. The yield for white maize is 5,18 t/ha. In the case of yellow maize (Graph 6) the production forecast is 7,552 million tons, which is 0,77% or 57 400 tons more than the 7,494 million tons of the previous forecast. The yield for yellow maize is 7,10 t/ha.
Source: CEC
Source: CEC
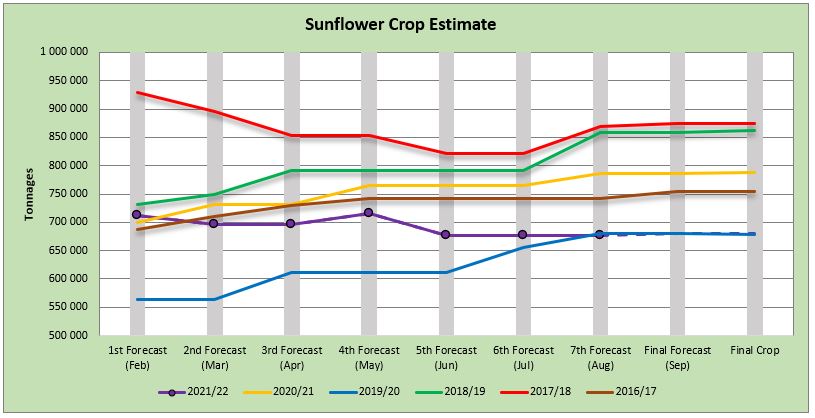
The production forecast for sunflower seed (Graph 7) remained unchanged at 677 240 tons. The area estimate for sunflower seed is 477 800 ha, while the expected yield is 1,42 t/ha.
Source: CEC
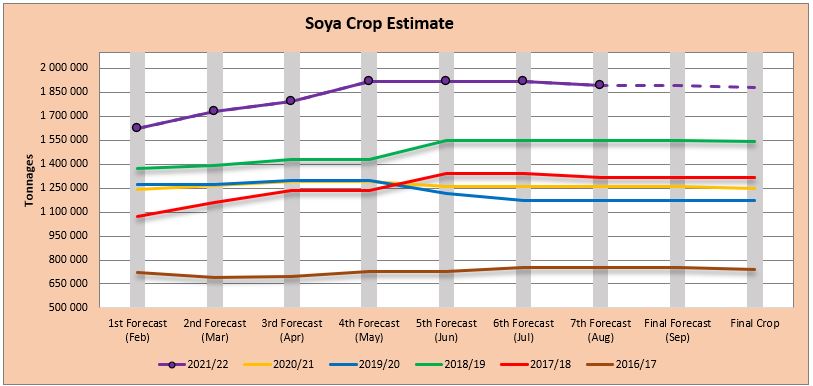
The production forecast for soybeans decreased by 27 700 tons (1,44%), from 1,890 million tons. The estimated area planted to soybeans is 827 100 ha and the expected yield is 2,29 t/ha (Graph 8).
Source: CEC
- Imports and exports – national
Source: Sagis
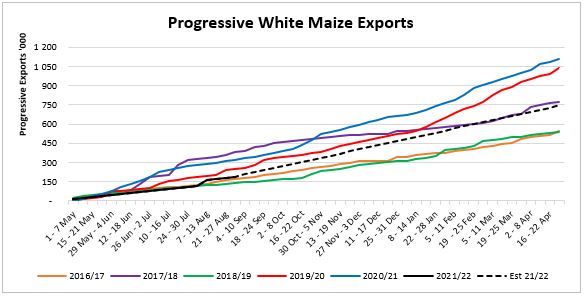
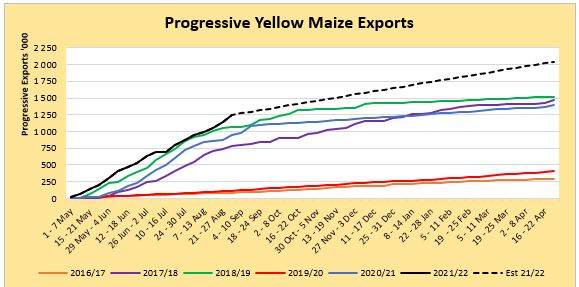
To date, 190 122 tons of white maize (Graph 9) and 1 248 002 tons (Graph 10) of yellow maize have been exported since the beginning of May 2021.
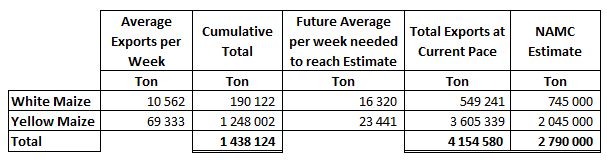
As seen in Table 1 the average white maize exports per week are currently 10 562 tons. If theoretically, white maize exports remain at the current average of 10 562 tons per week then there would be 195 759 tons less white maize exports than anticipated.
The average yellow maize exports per week are currently 69 333 tons. If theoretically, yellow maize exports remain at the current average of 69 333 tons tons per week then there would be 1 560 339 tons more yellow maize exports than anticipated.
Source: Sagis
- Parity prices
South Africa is a small producer compared to other countries and is thus a price taker (meaning that we cannot influence world prices). Because of this, our local prices are normally between import and export parity, which is illustrated in which is illustrated in Graphs 11 and 12. An import parity price is defined as the price which a buyer will pay to buy the product on the world market. This price will include all the costs incurred to get the product delivered at the buyer’s destination.
An export parity price is defined as the price that a local seller could receive by selling his product on the world market for example, excluding the export costs. The price which the seller obtains is based on the condition that he deliver the product at the nearest export point (usually a harbour) at his own expense.
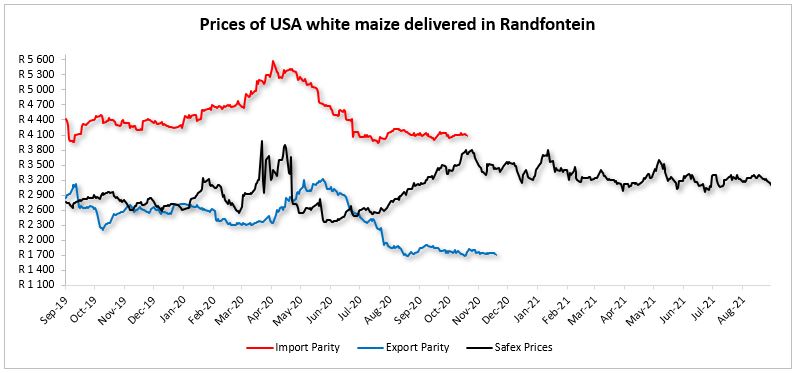
Source: Grain SA (No further import and export parity data available for white maize)
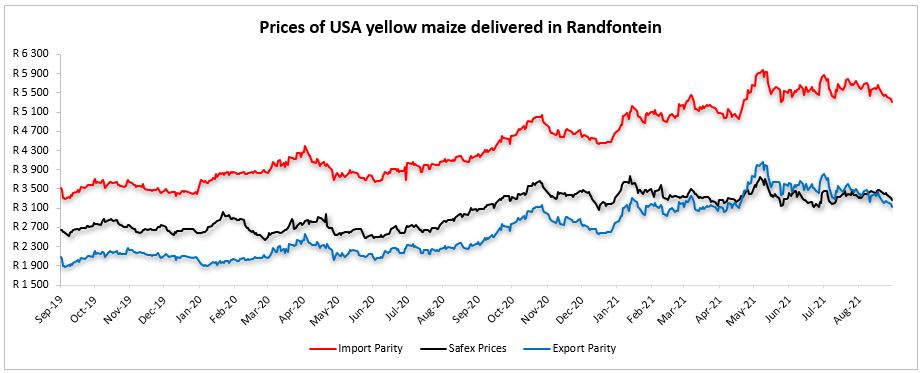
Source: Grain SA
- Producer deliveries – provincial
For the marketing year which is May to April the Free State province dominates the white maize that is used for human consumption and gristing. North West showed a significant increase for the 2020/2021 season with a 1% rise over the previous season (Graph 13).
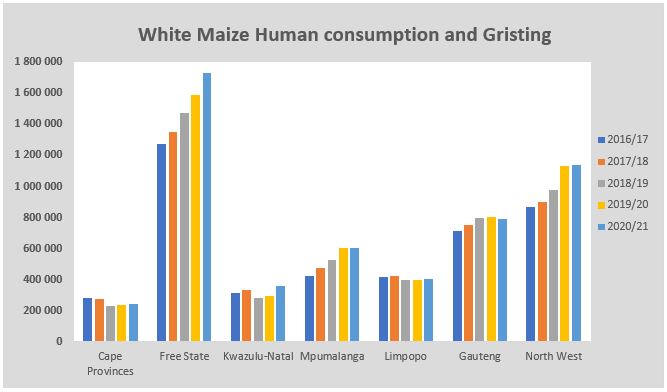
Source: Sagis
North West have a decreasing trend in yellow maize which is used for consumption and gristing. Only 18 563 tons of yellow maize was used in the 2020/2021 season that ended April 2021 (Graph 14).
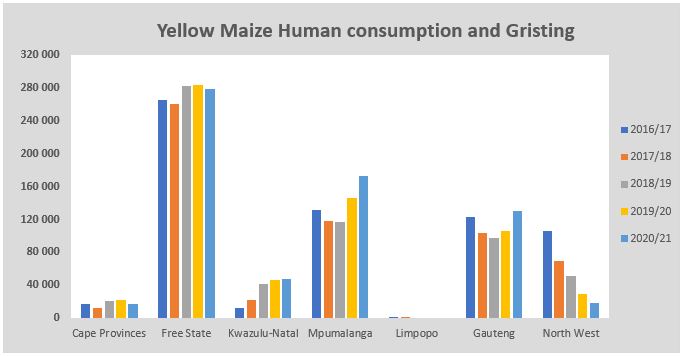
Source: Sagis
- Exchange rate
NWK Group is exposed to foreign exchange rate risk on various business areas, such as commodity prices and trade imports.
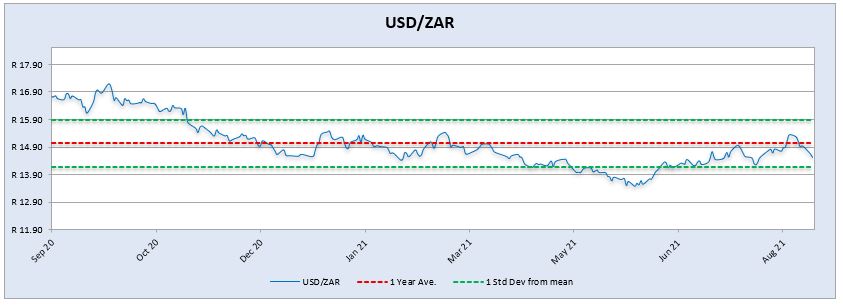
Source: Standard Bank, Corporate and Investment Banking & SARB
On a monthly average basis, the rand depreciated against the US dollar with 1,77% (0,26c) over the period July 2021 to August 2021. The one-year average for rand/US dollar is R15,03. Moreover, the average rand/US dollar exchange rate for the period August 2021 was R14,79 compared to R14,54 of July 2021 (Graph 15).
Exchange rate forecast: Graph 16 shows the actual USD/ZAR for 2021 Quarter 1 (Q1) and 2021 Quarter 2(Q2) against the forecasted figures. Trading Economics’s forecast for 2021 Q1 was the closest to actual and The Economy Forecast Agency’s forecast for 2021 Q2 was the closest to actual. According to Nedbank and Trading Economics the rand will strenghten in the year 2021 but Absa and The Economy Forecast Agency say the opposite.
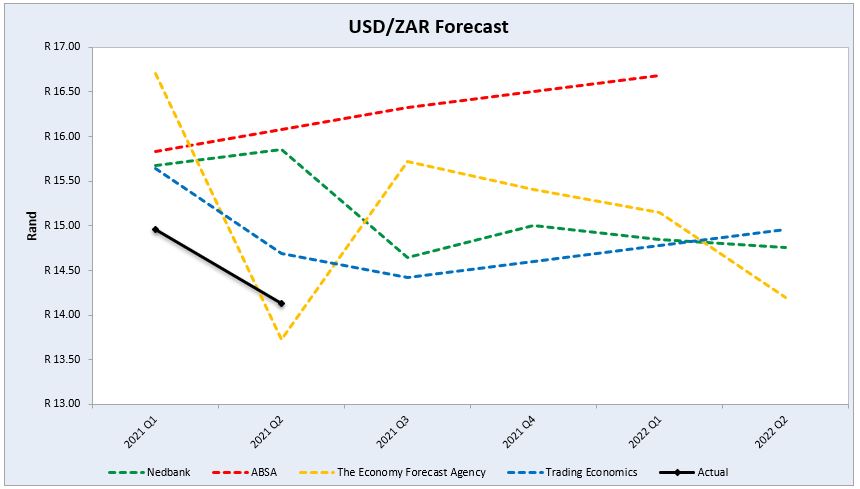
Source: Nedbank CIB; Absa; The Economic Forecast Agency; Trading Economics
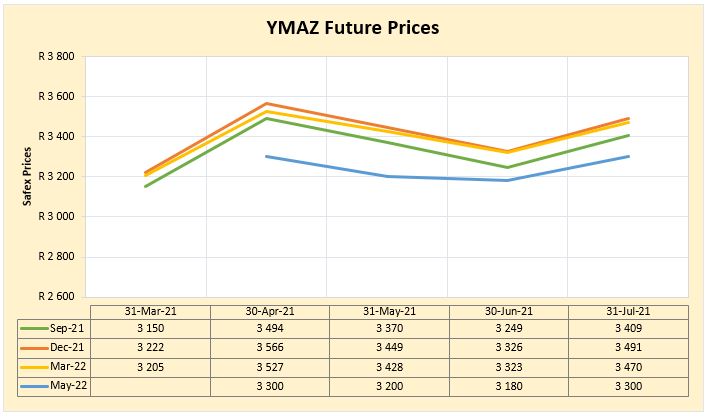
- Future prices
Graphs 17 and 18 illustrate the market sentiment for maize, in the form of future contracts, for the upcoming contract months. The market sentiment is the expectation of supply and demand fundamentals relating to white and yellow maize in South Africa.
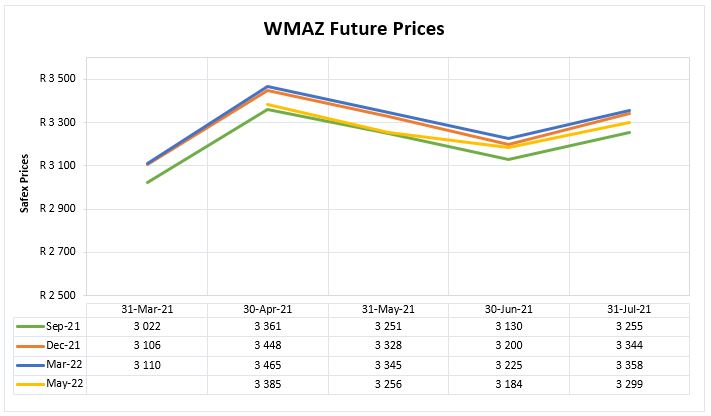
Source: Sagis
Source: Sagis
WEATHER AND CLIMATE
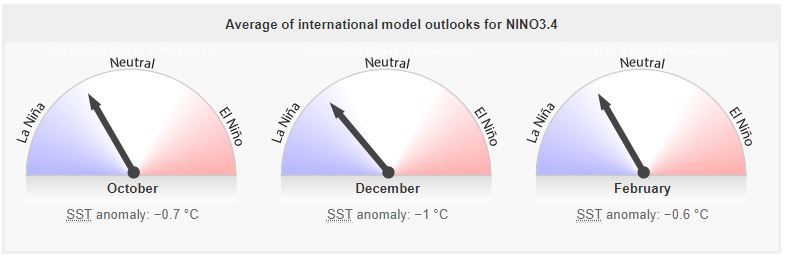
ENSO-neutral conditions continued during September, but is edging toward La Niña. At this time, forecasters anticipate La Niña to be of weak strength. In summary, a transition from ENSO-neutral to La Niña is favoured in the next couple of months, with a 70% to 80% chance of La Niña during the Northern Hemisphere winter 2021/22.
La Niña chances increase to above 50% during the months of August 2021 until March 2022.
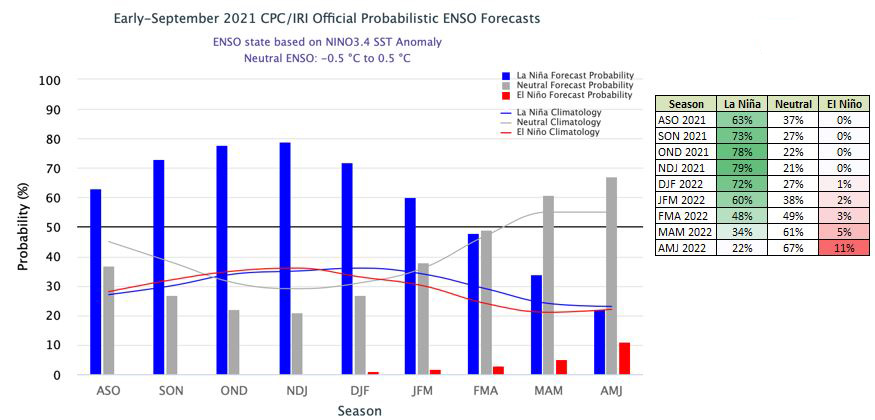
The El Niño–Southern Oscillation (ENSO) is currently neutral, that is, neither El Niño nor La Niña. Most model outlooks indicate the central tropical Pacific will cool in the coming months. Three of seven models indicate this cooling will be sufficient, and sustained for long enough, to meet minimum La Niña event criteria from mid to late spring through to at least January 2022.
INTEREST RATE RISK
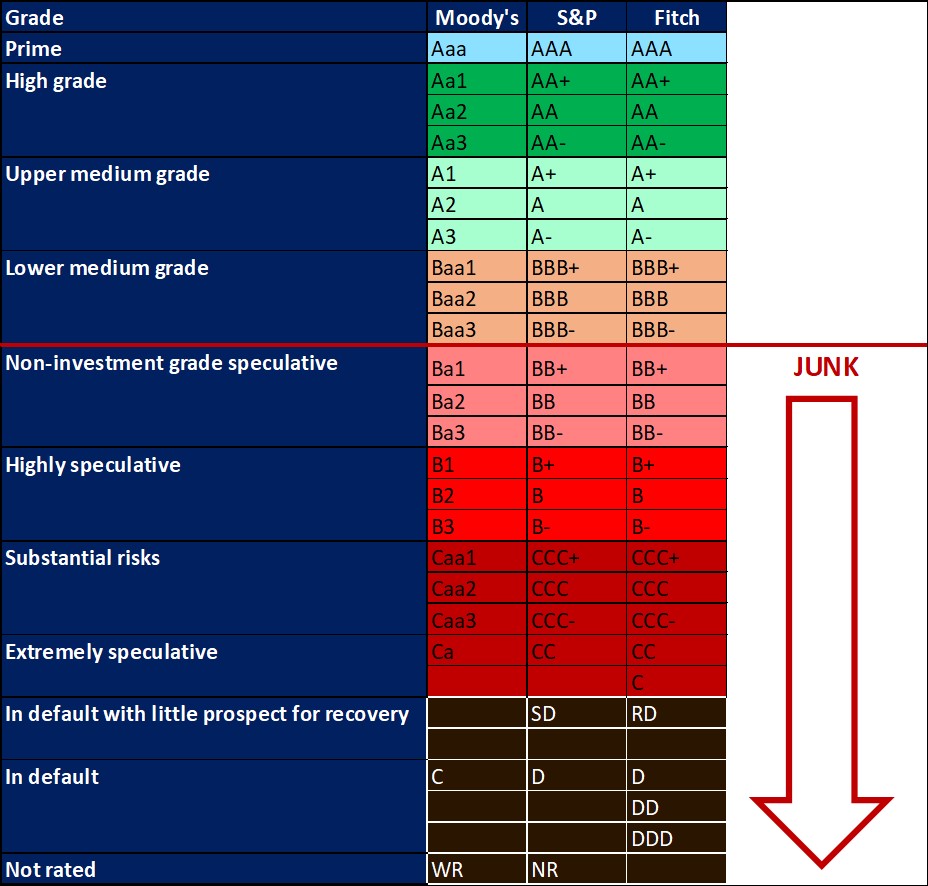
On 27 March 2020, Moody’s downgraded South Africa’s sovereign credit rating to sub-investment grade and placed a negative outlook on the rating. The key drivers for this downgrade include weak economic growth, continuing deterioration in fiscal strength, and slow progress on structural economic reforms. It is now the first time in post-apartheid South Africa where all major rating agencies, that is, Moody’s, Fitch and S&P, have South Africa’s credit ratings in sub-investment grade territory.
The COVID-19 pandemic forced the South African Reserve Bank to make a number of interest rate cuts to bring relief to the economy. Interest rate movement:
- 20 March 2020 – 8,75%
- 15 April 2020 – 7,75%
- 22 May 2020 – 7,25%
- 23 July 2020 – 7,00%
Since the meeting in July the interest rate stayed unchanged.
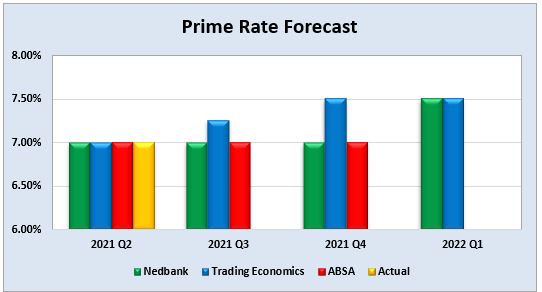
Graph 19 shows the prime rate forecast for 2021 Q2 to 2022 Q1. Trading Economics’ forecast that the prime interest rate will increase with 25 basis points for 2021 Q3 and again for 2021 Q4. The next MPC meeting date is 23 September 2021.
Fraud risk
FRAUD AWARENESS
SymQuest believes that business data is more vulnerable than ever before. Cybersecurity is necessary for NWK to efficiently operate. It is also critical for protecting our customers’ information.
Following IT best practices goes beyond using the latest technology; it’s about staying ahead of risks and disasters. When creating cybersecurity procedures, SymQuest suggests using a layered security model. This model begins with the internet and ends with the company employees. The fourth point in this layered security model that will be referred to is employee education. In the coming reports, additional points of the model will be included.

With cybersecurity becoming such an important component of almost any business The Committee of Sponsoring Organisations of the Treadway Commission (COSO) plans to issue detailed recommendations on how organizations can better manage risks related to cloud computing, artificial intelligence and outside contractors, among other topics in the year ahead.
The president signed the Cybercrime Bill into law on 26 May 2021. According to Michalsons the Cybercrimes Act will only come into operation on a date fixed by the President. The law will effectively deal with cybercrimes.
FRAUD TIP
The fraud prevention tip for this month is: Know your employees.
It is not all about the physical controls when it comes to preventing or deterring fraud. Soft skills and a positive, hands on, work environment is also important.
Managers need to know their employees and engage them in conversation in order to pick up on behavioural changes. Fraudster often display behavioural traits that may reveal the intention to commit fraud. A change in attitude should be closely observed. It might just prevent a fraud from occurring or render early detection.


