
The NWK Limited external factors report provides an overview of the main external factors that NWK and its clients are exposed to at a specific point in time. This report opts to aid in a timely basis to foresee external market and other factors that may have an impact on any business and clients. The main focus of this document is to have a closer look at external factors that can affect any business and our customers.
Executive summary
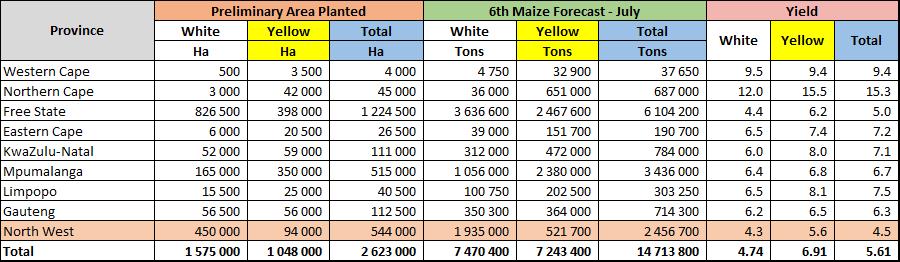
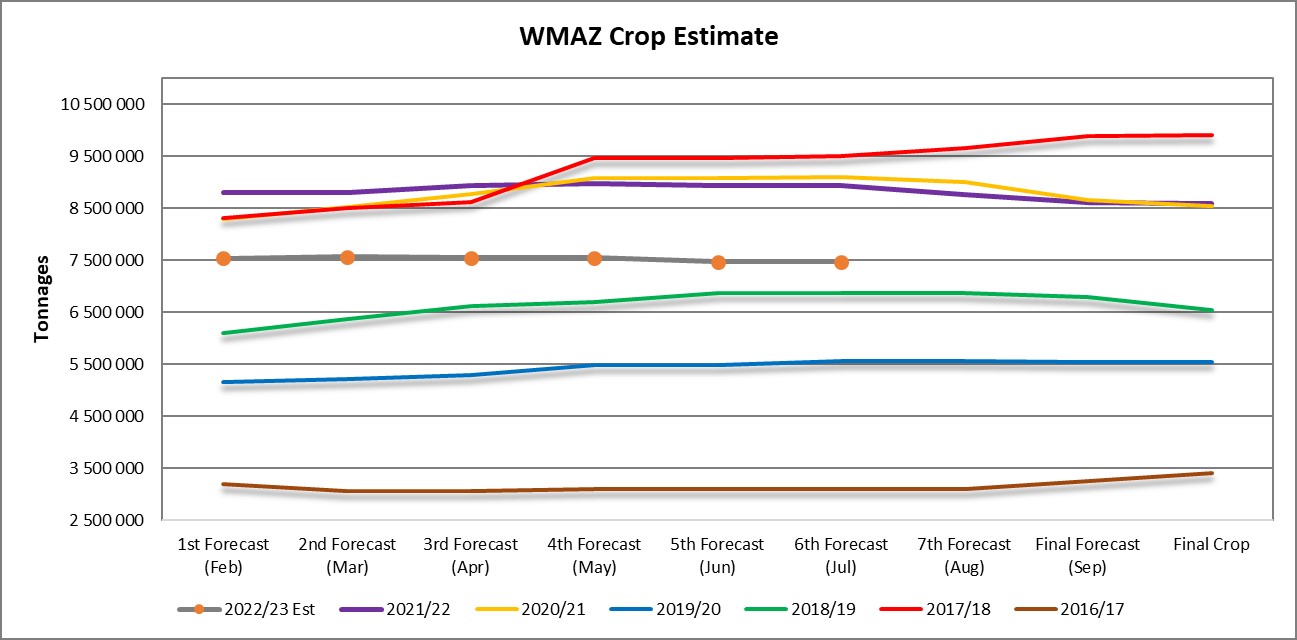
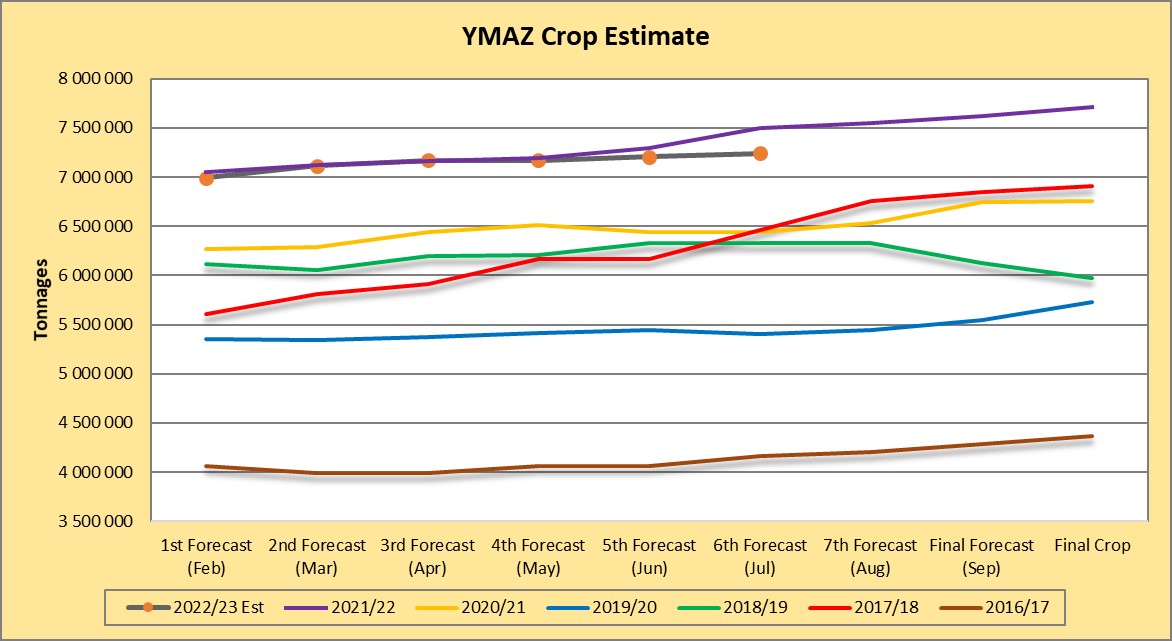
The Agribusiness Confidence Index for June (Q2), compiled by the Agricultural Business Chamber (Agbiz), presents a picture of a sector that is still on solid footing. The National Agricultural Marketing Council (NAMC) predicts 30 April 2022 ending stock for white and yellow maize to exceed that of the 2020/2021 season. Their forecast for white maize for the season is that of an excellent harvest. The estimated maize crop is 10% less than the 2021/2022 crop. According to the sixth maize forecast the three main maize producing areas – the Free State, Mpumalanga and North West – are expected to produce 82% of the 2022/2023 crop.
The repo rate has been cut by 300 basis points to help mitigate the economic fallout of the COVID-19 pandemic until November 2021. During November 2021 the Monetary Policy Committee (MPC) of the South African Reserve Bank (SARB) increased the repo rate with 125 basis points. The repo rate is currently 4,75% and the prime rate is 8,25%. A tough year lies ahead for businesses and consumers as it has a negative impact on employment and growth. Experts also warn that the MPC must proceed with caution in deciding if and by how much interest rates should be further raised this year.
The Russia-Ukraine conflict has a big impact on the global economy as these two countries are rich in minerals and key role-players in the export of oil, natural gasses, sunflower oil, palladium and fertiliser materials amongst others. With exports influenced the increasing demand for these resources cause prices to rise. The spill over effect of rising brent crude oil prices is higher fuel prices which result in higher food prices and in turn causes inflation to rise. When inflation goes up interest rates also tend to go up in an effort to get inflation under control.
The latest increase of 75 basis points (bps) is the biggest hike since 2002. This is followed by a consumer inflation rate of 7,4%. The South African Reserve Bank made a number of interest rate cuts amounting to 300 bps to bring relief to the economy, but as from November 2021 the prime interest rate experienced five increases amounting to a total of 200 bps. The repo rate is currently 5,5% and the prime rate is 9%. Professor Raymond Parsons is of the opinion that given present global and domestic economic crosscurrents, a more aggressive monetary policy raises the risk that it may well now come at a cost in growth and employment. He also mentions that there are external and internal reasons to expect that the inflation rate will decline towards the end of 2022.
Load shedding poses long term risks for the agricultural sector on a supply and input cost level. When farmers struggle to produce outputs, NWK is directly impacted through less silo stock income and the farmers’ ability to repay loans. Cost effective and sustainable alternative solutions must be considered in order to reduce the dependency on Eskom for electricity.
Agbiz/IDC ACI moderates in Q2, 2022
Agbiz quarterly conducts a survey in order to create an Agribusiness Confidence Index (ACI). The Agbiz/IDC ACI, which was released on 13 June 2022, reflects the perceptions of at least 25 agribusiness decision-makers on the ten most important aspects influencing a business in the agricultural sector.
These ten aspects are:
-
- turnover;
- net operating income;
- market share;
- employment;
- capital investment;
- export volumes;
- economic growth;
- general agricultural conditions;
- debtor provision for bad debt; and
- financing cost.
These aspects are used by agribusiness executives, policymakers and economists to understand the perceptions of the agribusiness sector. It also serves as a leading indicator of the value of the agricultural output while providing a basis for agribusinesses to support their business decisions. The graph below shows the Agribusiness Index from 2002 to 2022.
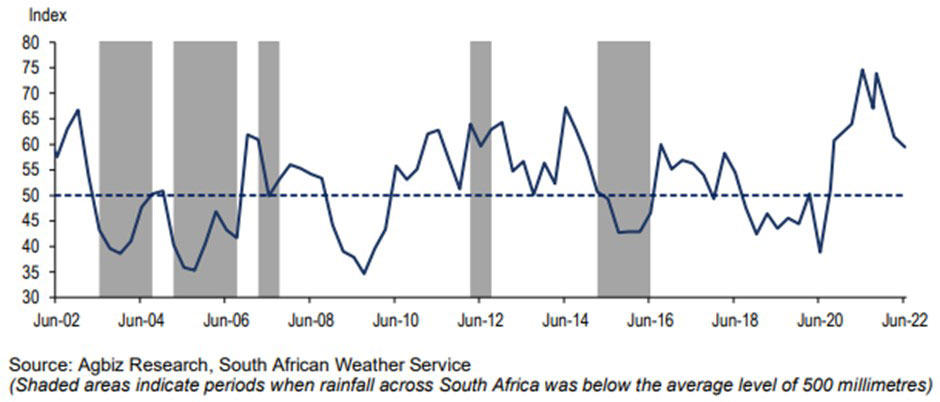
The ACI is comprised of ten subindices, of which eight declined in the second quarter of this year. The turnover subindex lifted by 7 points 93, while the net operating income subindex remained unchanged at 79 points. The lifted turnover is mainly due to higher agricultural commodity prices and the expected decent harvest in field crops and horticulture.
The market share of the agribusiness’s subindex fell by 5 points from the first quarter of 2022 to 71. The agribusinesses in horticulture, agricultural machinery and financial services were among the first respondents who signalled weaker expectations. However, most of the respondents maintained a broadly unchanged view from the previous quarter.
The employment subindex confidence increased by 5 points from the first quarter of 2022 to 73 in Q2 2022. This is unsurprising as the second quarter of the year is relatively busy with the harvesting of both summer crops and various horticulture products.
Confidence in the capital investments subindex increased with 6 points which is a pleasant surprise compared to the first quarter’s decrease of 13 points. It currently stands at 73 points. These are encouraging results at a time when farm input costs are rising and adding pressure on farmers and agribusinesses. An important signal of this activity is the tractor and combine harvester sales, which have remained positive for the first five months of this year. This comes on the back of two years of already solid sales growth.
The subindex measuring the volume of exports sentiment declined by 6 points from the first quarter to 71. This is reflects the expected decline in summer crop and wine grape harvests, as well as the temporary stoppage of livestock product exports because of the outbreak of foot-and-mouth disease. That said, a level of 71 still indicates robust export conditions.
Confidence in the general economic conditions fell by 5 points to 43. This reflects the uncertainty in the current geopolitical environment, inflation concerns, a general slowdown in the global economy, and more domestic events such as load-shedding, amongst other factors.
The general agricultural conditions subindex fell by 6 points to 54 in the year’s second quarter. The continued rains that slightly delayed the summer crop harvest might have influenced the respondents’ views here, along with delayed rains in the Western Cape for winter crops. Nevertheless, this subindex is still well above the 50-neutral mark, which shows that the sentiment about agricultural conditions in the country is broadly positive.
The debtor provision for bad debt and financing costs subindices are interpreted differently from the abovementioned indices. A decline is viewed as a favourable development, while an uptick is not a desirable outcome as it indicates that agribusinesses are financially constrained. In Q2 2022, the indices for debtor provisions for bad debt and financing costs fell by 2 and 14 points to 43 and 4, respectively. This is broadly favourable and reflects the tail end of the farmers’ financial gains of the last two robust seasons, which enabled them to service their debts. Still, the rising input costs and expected interest rate increases are aspects that most respondents flagged as crucial concerns.
In conclusion, Wandile Sihlobo, chief economist at Agbiz, said that the second-quarter results present a picture of a sector that is still on solid footing, but we still face numerous risks. The issues which are most concerning right now are the rising fuel, fertiliser and agrochemicals costs, which will pressure farmers and agribusinesses in the coming months. The ongoing war between Russia and Ukraine and the disruptions this has caused on some of our key fruit export markets and supply chains are also a major concern for the sector. However, some of our long-term challenges are within our reach as South Africans. These include the need to improve the efficiency of ports, electricity supply and water, quality of roads, curbing crime that devastates the rail network, and improving biosecurity. Addressing these aspects would have a far more positive impact on the long-term growth of this sector and, subsequently, job creation.
Source: www.agbiz.co.za, Issued by Wandile Sihlobo, chief economist: Agbiz
Weather and climate
NATIONAL ASSESSMENT
The long-term rainfall outlooks for:
- Summer rainfall areas are for below-average rainfall until about October, followed by above-average rainfall from about November 2022 to January 2023 (impact of both La Niña and the Indian Ocean.
- Winter rainfall areas will be about average until October with sporadic dry spells.
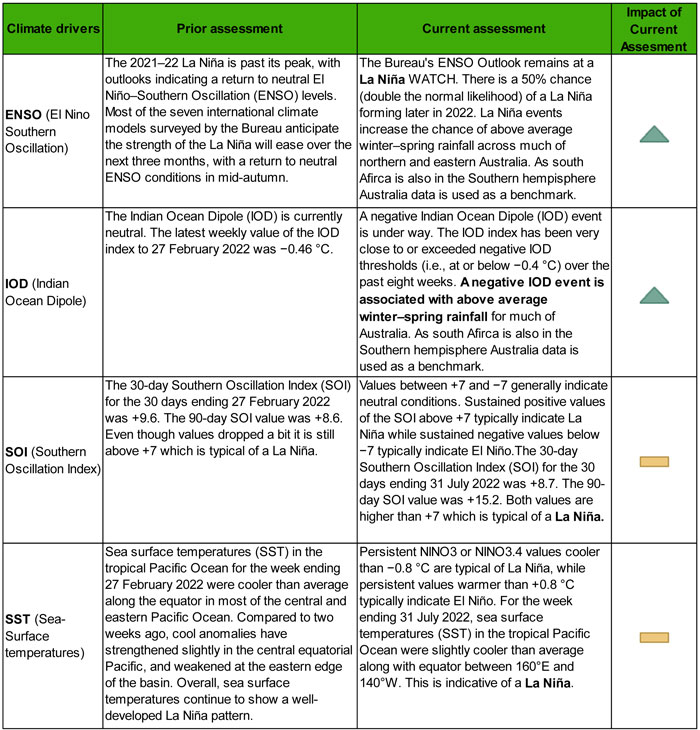
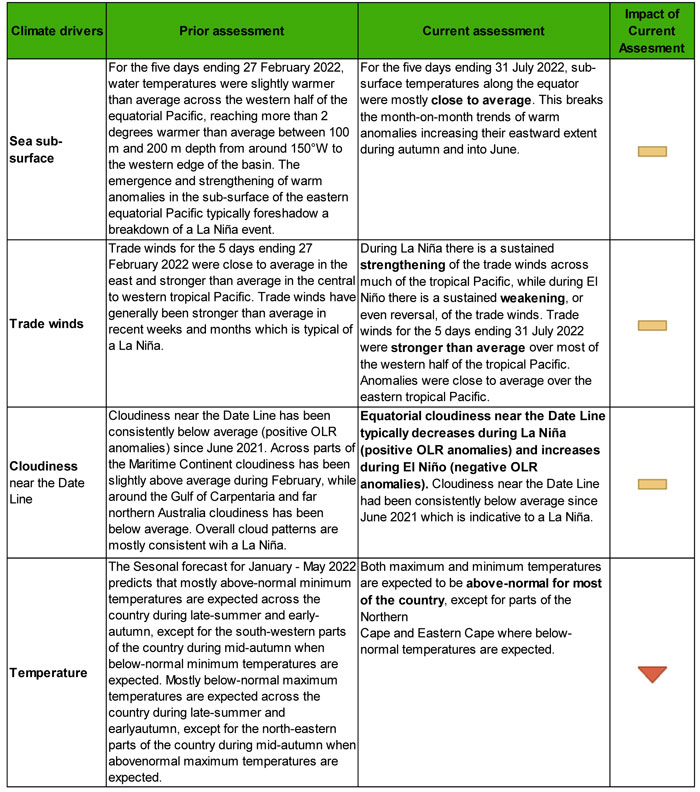
As seen in the graph and figure below, in mid-July, sea surface temperatures (SSTs) in the central-eastern equatorial Pacific remain below average. Key oceanic and atmospheric variables have remained consistent with La Niña conditions, although weakened. A La Niña Advisory still remains in place for July 2022.
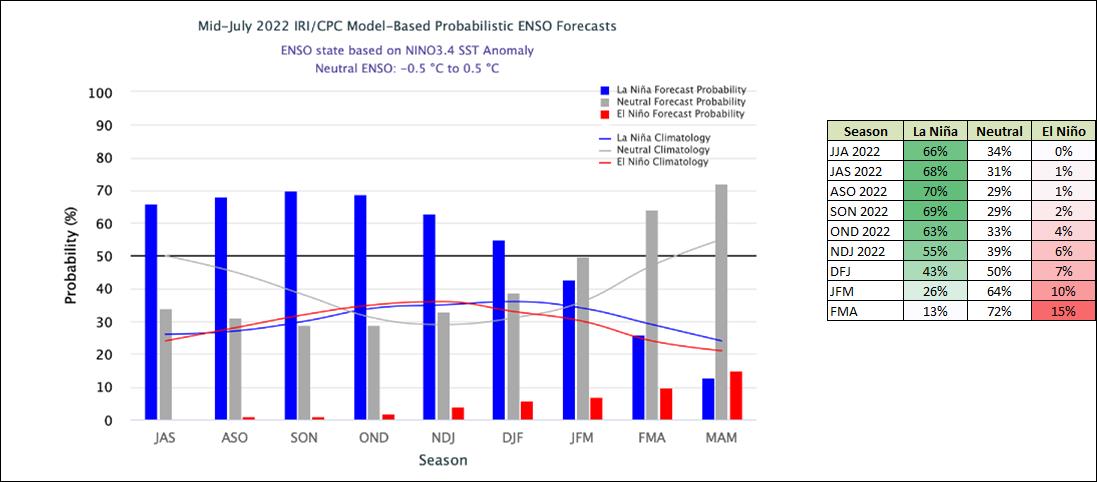
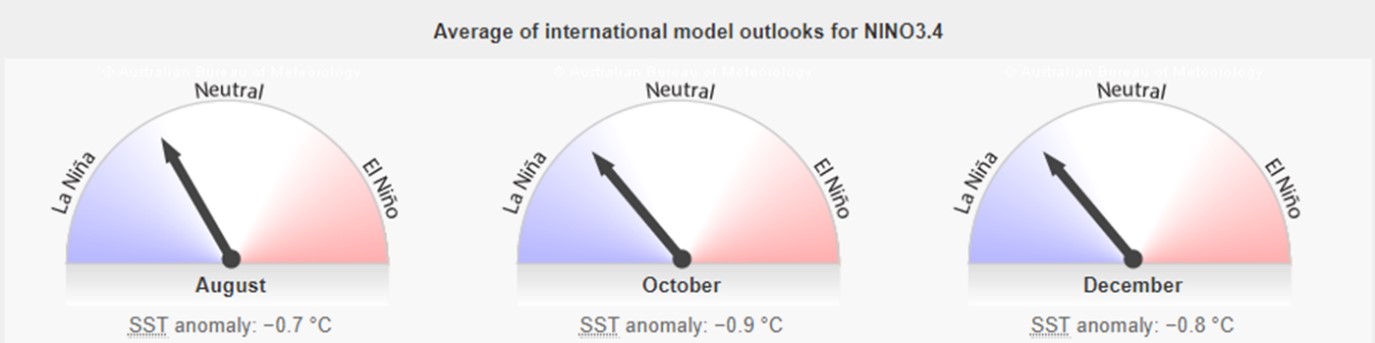
A large majority of the models in the plume predict SSTs to remain below-normal at the level of a weak La Niña until at least Sep-Nov 2022. Neutral ENSO SSTs are between -0,5°C and 0,5°C. The current SSTs for August to December range from -0,7°C to -0,9°C.
The tables below reflects the movement of the eight ENSO indicators. The table will be included in the report for the months August to February when rainfall patterns are more relevant for the planting season. Since the table was last inserted most of the indicators remained the same – favourable of a La Niña.
 While back-to-back La Niña events are not uncommon and have occurred in approximately half of all past events since 1900, three in a row is less common and has only occurred three times since 1900: 1954 to 1957; 1973 to 1976 and 1998 to 2001.
Despite the end of the 2021/2022 La Niña, the bureau’s long-range climate outlook remains wetter than average for most of Australia, reflecting a range of climate drivers including a developing negative Indian Ocean Dipole, and warmer than average waters around Australia. South Africa is situated far from the Pacific Ocean where most of these analyses take place, but it is also situated in the southern hemisphere which is why Australia is used as a benchmark.
Source: http://www.bom.gov.au/climate/enso/#tabs=Pacific-Ocean&pacific=Sea-surface
In summary, most of the indicators favour a La Niña season with above-average rainfall predicted for the rest of 2022. Good rainfall is pivotal for agriculture, but correct timing is of the essence. Late rainfall earlier this year had a negative impact on the production season as too wet conditions hindered farmers from getting into their land in time to harvest. The wet conditions also caused a lower grade of grain to be produced. Sclerotinia flourishes in cold and wet conditions and as a result, sclerotinia infects sunflower crops causing major damage. Therefore, good rainfall is welcomed, but the timing is of the utmost importance.
Market risk
GRAIN MARKET ANALYSIS
- Ending stock – national
Ending stock data is gathered from the NAMC. The estimates are reassessed and reported by the Grain and Oilseeds Supply and Demand Estimates Committee. The following is a summary of the April 2023 projected final ending stock for the 2022/2023 season in tonnages:
- White maize => 879 549 t
- Yellow maize => 770 222 t
The following is a summary of September 2022 ending stock estimates for the 2021/2022 season:
- Wheat => 554 304 t
The following is a summary of February 2023 estimated ending stock for the 2022/23 season:
- Sunflower => 102 520 t
- Soybeans => 376 837 t
- Sorghum => 91 202 t
The graph below for white maize shows the estimated ending stock for white maize in April 2023, which is 585 988 tons or 40% less than the 2021/2022 season.
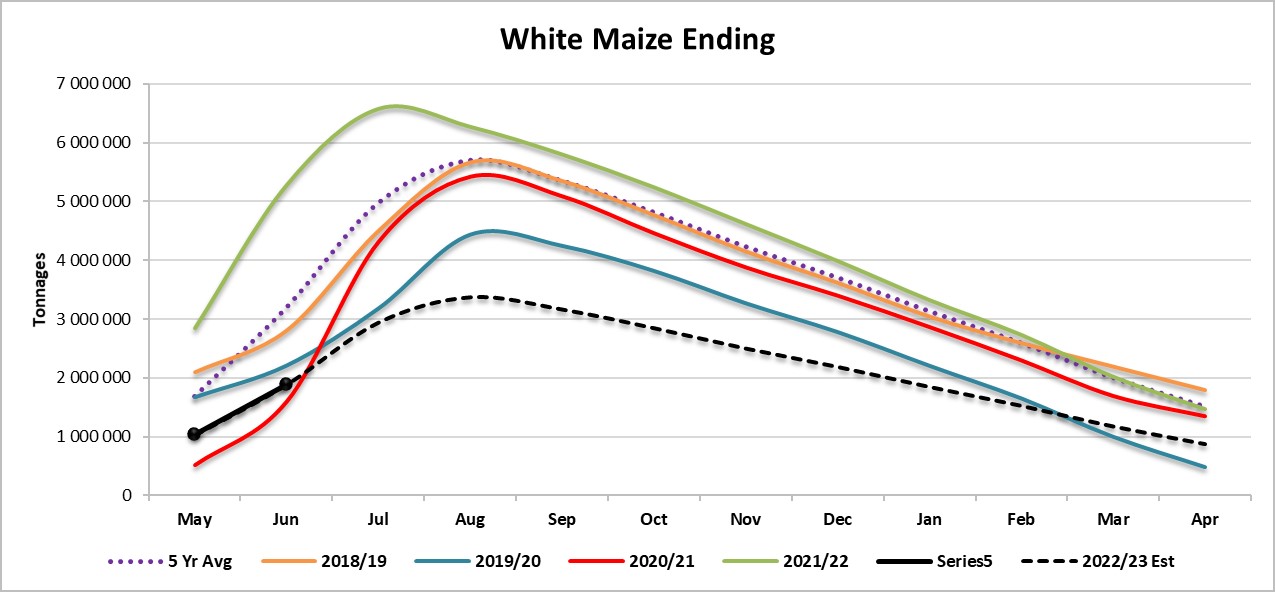
Source: Sagis
Yellow maize shows an estimated 111 540 tons or 17% increase in ending stock compared to the previous season – see graph below.
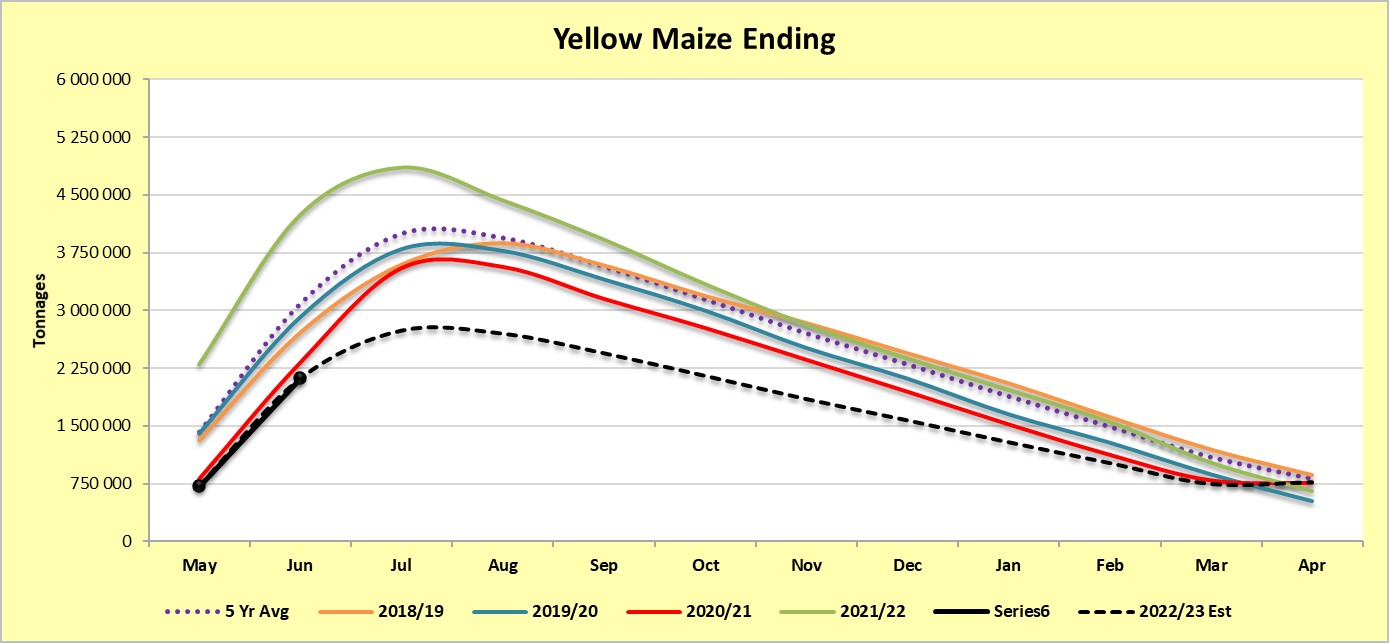
Source: Sagis
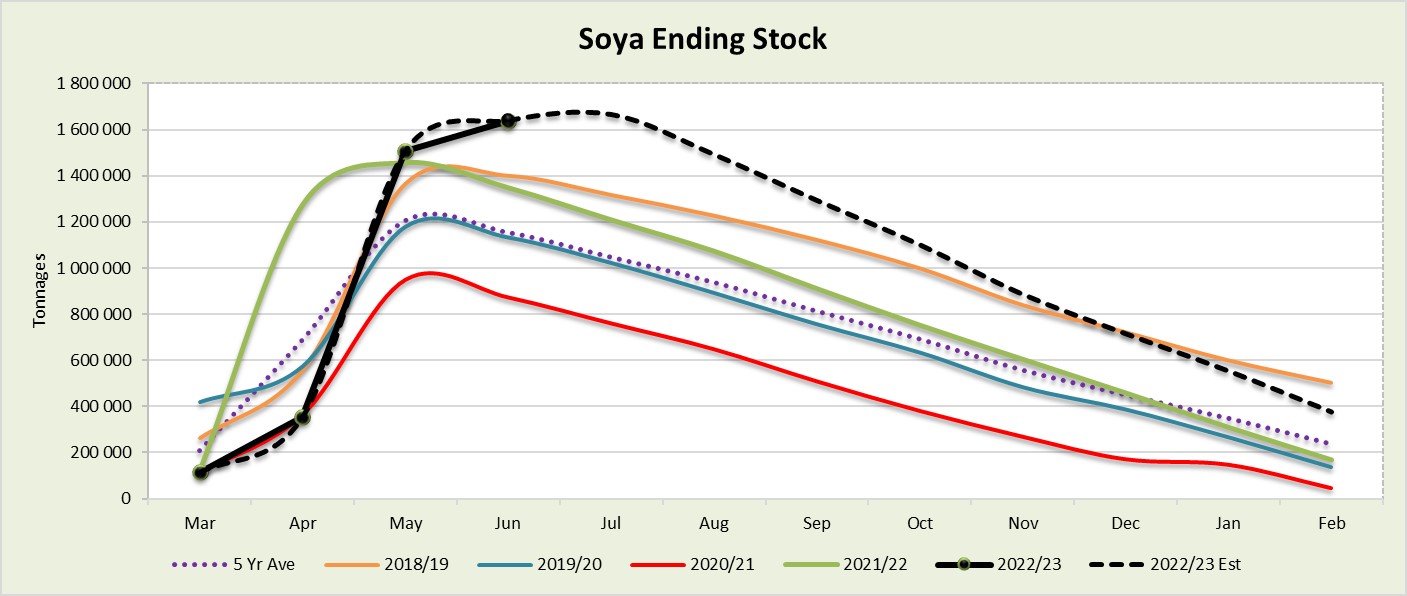
The estimated soya ending stock for February 2023 is 124% (208 450 tons) more than February 2022.
Source: Sagis
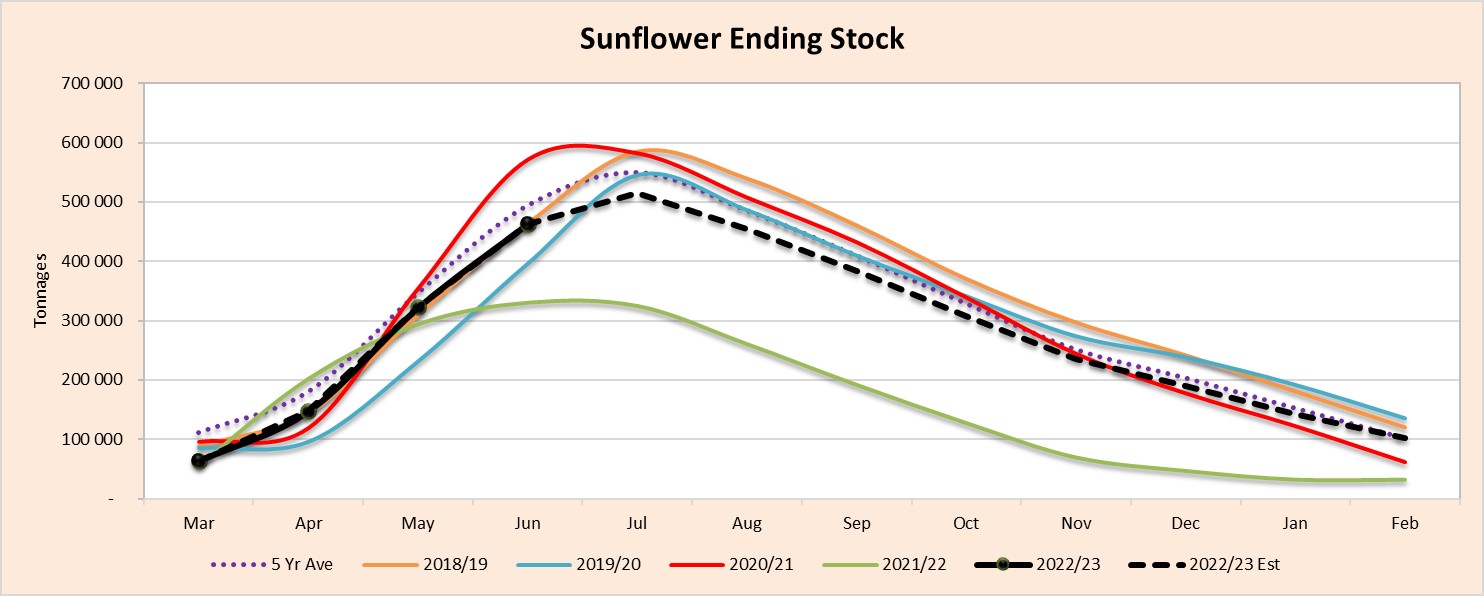
The estimated sunflower ending stock is 223% (70 734 tons) more than the previous season ending stock. The sharp rise in the graph after January for both soybeans and sunflowers may indicate that the actual ending stock can be more than the forecasted figures.
Source: Sagis
- Crop estimations
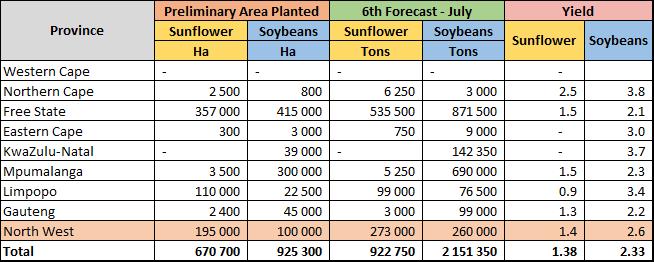
According to the Crop Estimate Committee’s (CEC) fourth forecast for 2022/2023 the preliminary area estimate for maize is 2,623 million ha, which is 5% or 132 400 ha less than the actual 2,755 million ha planted for the previous season.
For the sixth forecast the preliminary area estimate for white maize is 1,575 million ha, which represents a decrease of 7% or 116 900 ha compared to the actual 1,692 million ha planted last season. In the case of yellow maize, the area estimate is 1,048 million ha, which is 1,5% or 15 500 ha less than the actual 1,064 million ha planted last season.
Source: CEC (Crop Estimates Committee)
Source: CEC (Crop Estimates Committee)
Source: CEC (Crop Estimates Committee)
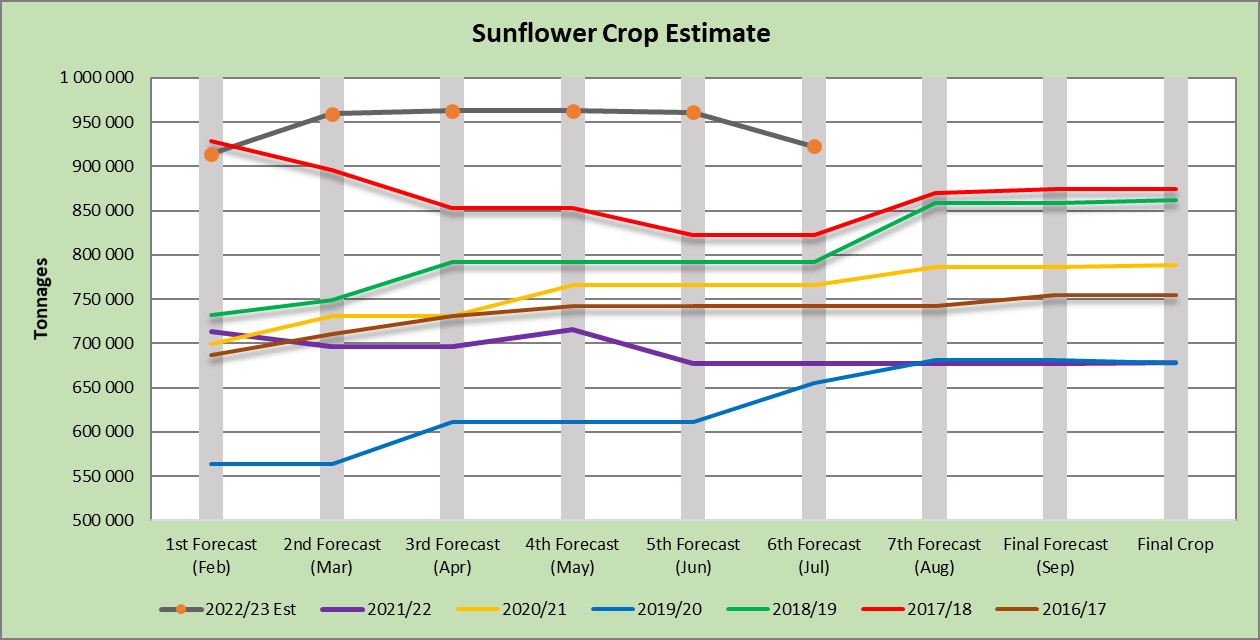
The sunflower seed estimate is 670 700 ha, which is 40% or 192 900 ha more than the 477 800 ha planted the previous season.
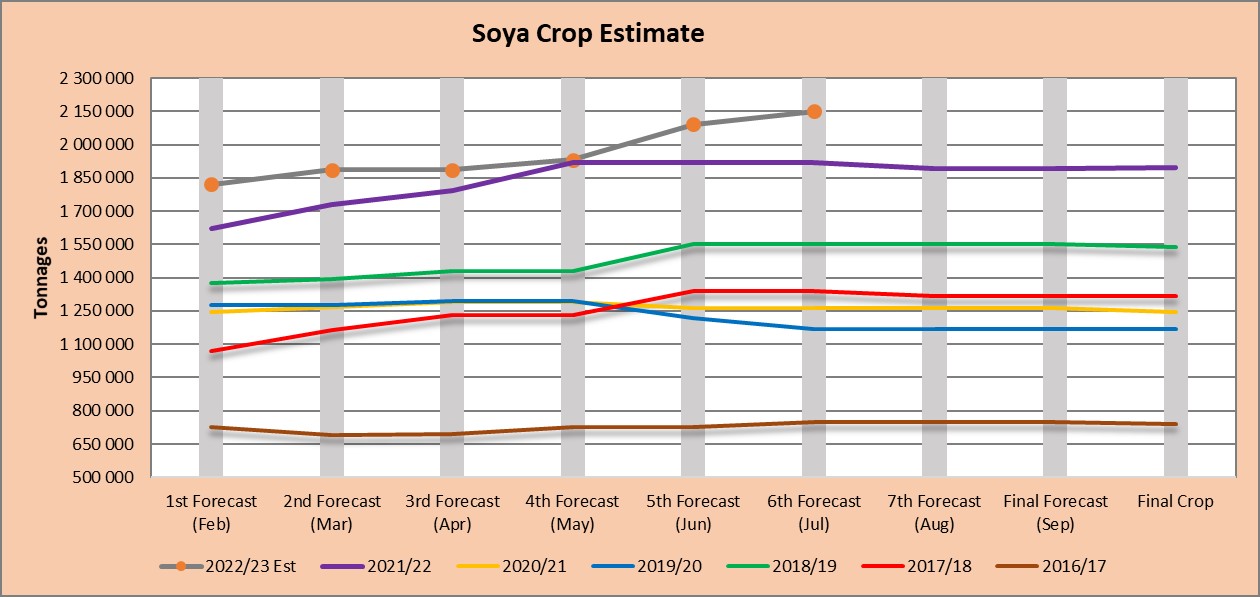
It is estimated that 925 300 ha have been planted to soybeans, which represents an increase of 12% or 98 200 ha compared to the actual 827 100 ha planted last season. This is the highest area planted to soybeans in the history of South Africa.
Source: CEC (Crop Estimates Committee)
Source: CEC (Crop Estimates Committee)
Source: CEC (Crop Estimates Committee)
- Imports and exports – national
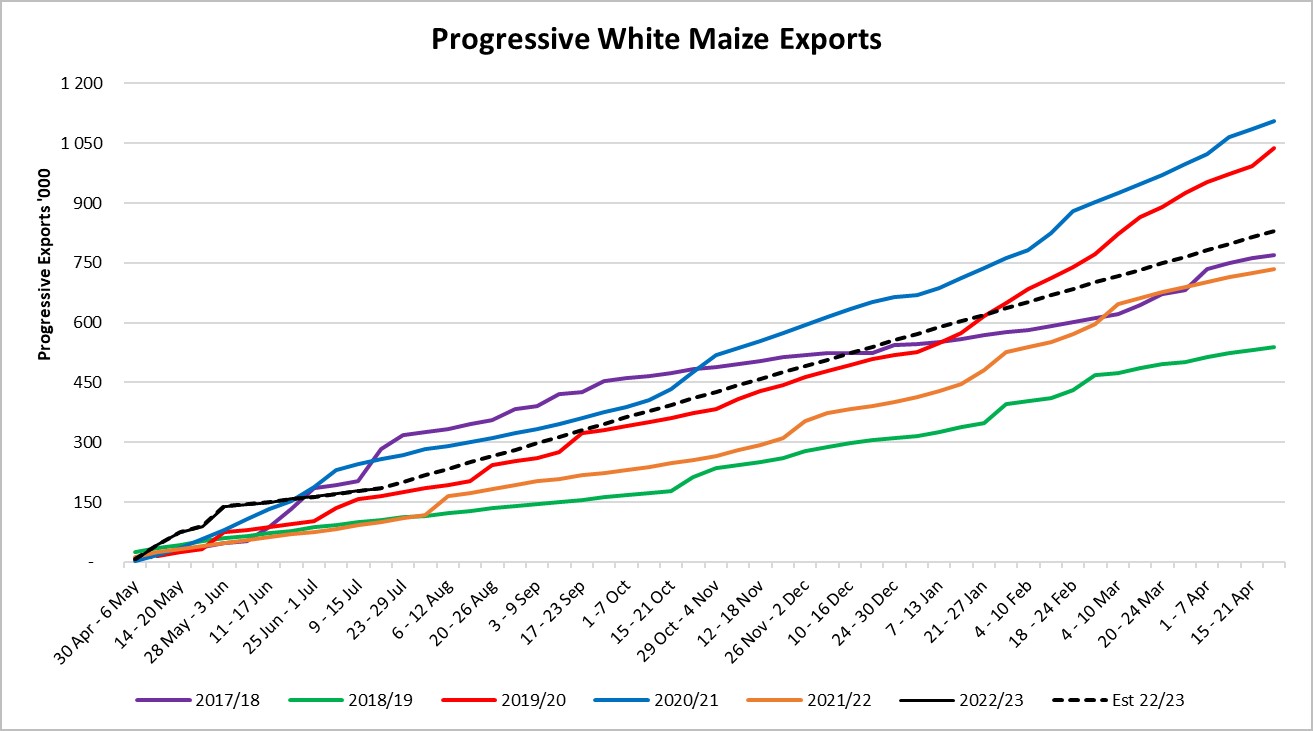
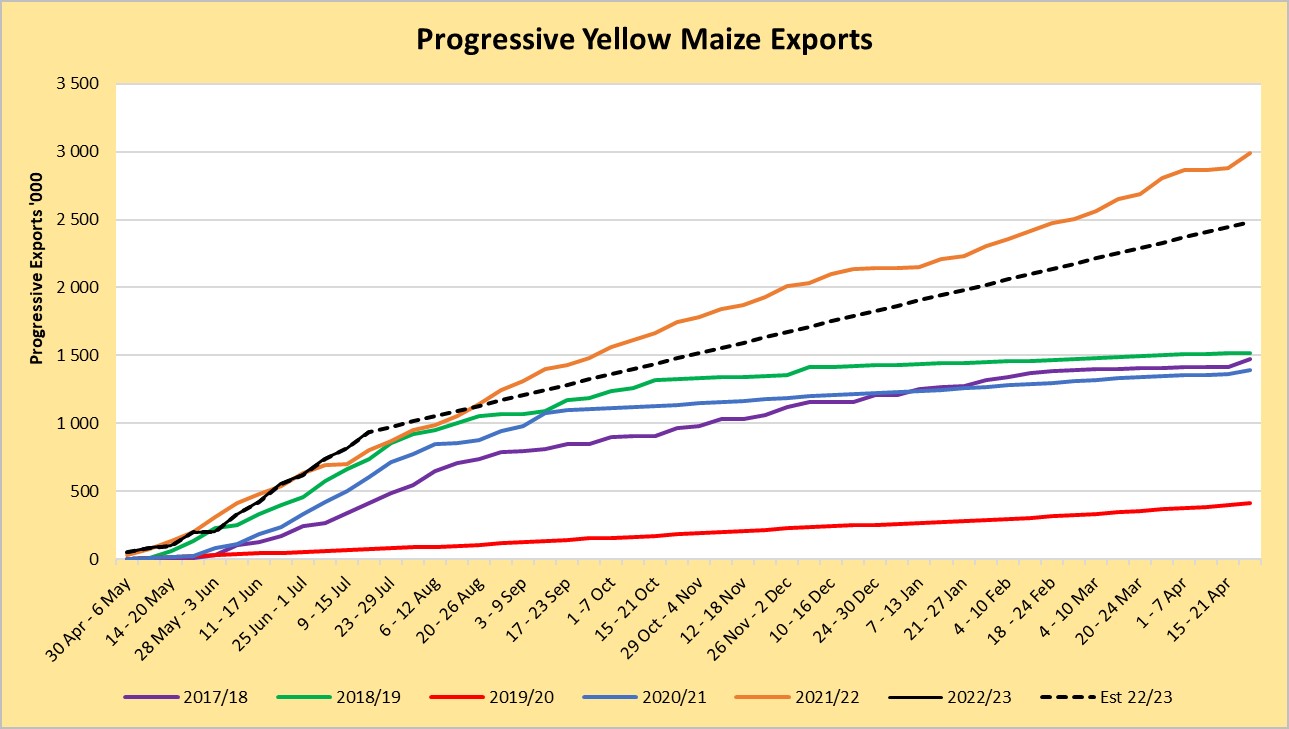
For the production season ending April 2023 185 167 tons of white maize and 936 916 tons of yellow maize have been exported to date as seen on the graphs below. In the previous season a record number of 2 991 129 tons yellow maize was exported. This was mainly due to South Africa’s competitive export parity prices compared to the rest of the world.
Source: Sagis
To date, 185 167 tons of white maize and 936 916 tons of yellow maize have been exported since the beginning of May 2022.
As seen in the table above, the average white maize exports per week are currently 15 431 tons. If theoretically, white maize exports remain at the current average per week then there would be 27 610 tons less white maize exports than anticipated.
The average yellow maize exports per week is currently 78 076 tons. If theoretically, yellow maize exports remain at the current average per week then there would be 1 574 969 tons more yellow maize exports than anticipated.
Source: Sagis
- Parity prices
South Africa is a small producer compared to other countries and is thus a price taker (meaning that we cannot influence world prices). Because of this, our local prices are normally between import and export parity, which is illustrated in the graph below. An import parity price is defined as the price which a buyer will pay to buy the product on the world market. This price will include all the costs incurred to get the product delivered to the buyer’s destination.
An export parity price is defined as the price that a local seller could receive by selling his product on the world market e.g., excluding the export costs. The price which the seller obtains is based on the condition that he delivers the product at the nearest export point (usually a harbour) at his own expense.
The graph below reflects the Safex price, import parity and export parity of yellow maize as well as the Safex price of white maize. The import and export parity prices for white maize is not released by Grain SA for this period.
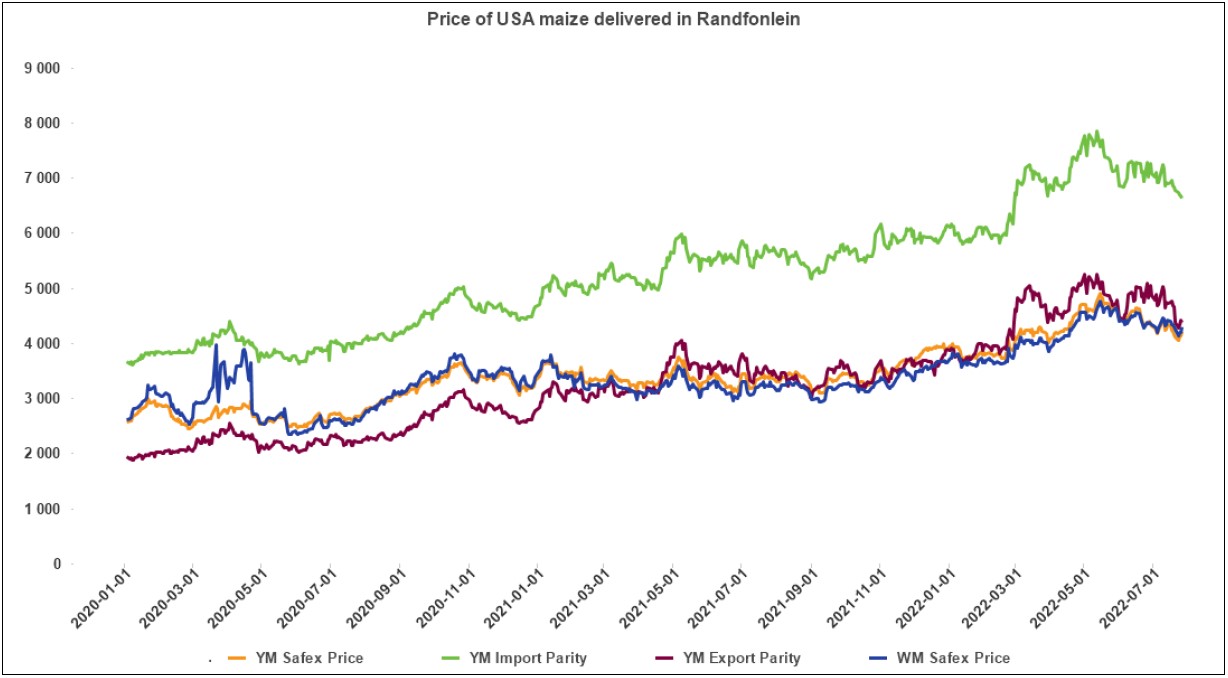
Source: Grain SA
- Producer deliveries – provincial
For the marketing year which is May to April the Free State dominates the white maize which is used for human consumption and gristing. The graph below shows that North West showed a significant increase for the 2020/2021 season with 1% compared to the previous season, but for the 2021/2022 season it decreased again with 17%.
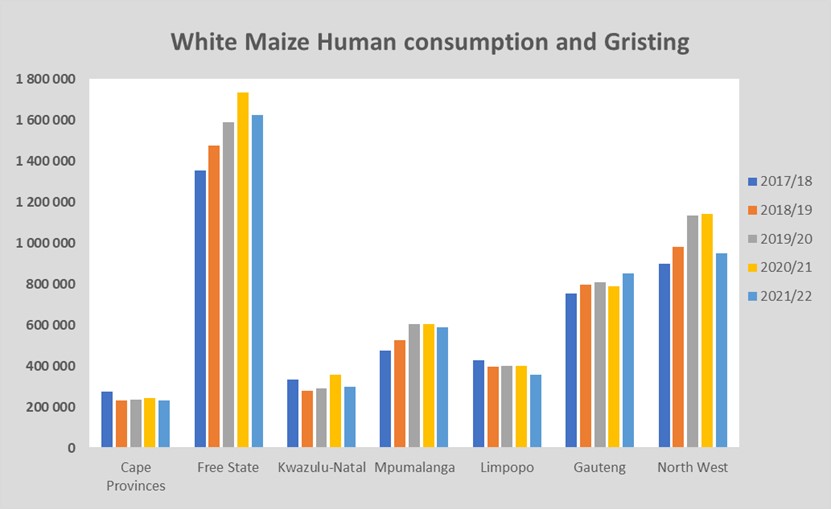
Source: Sagis
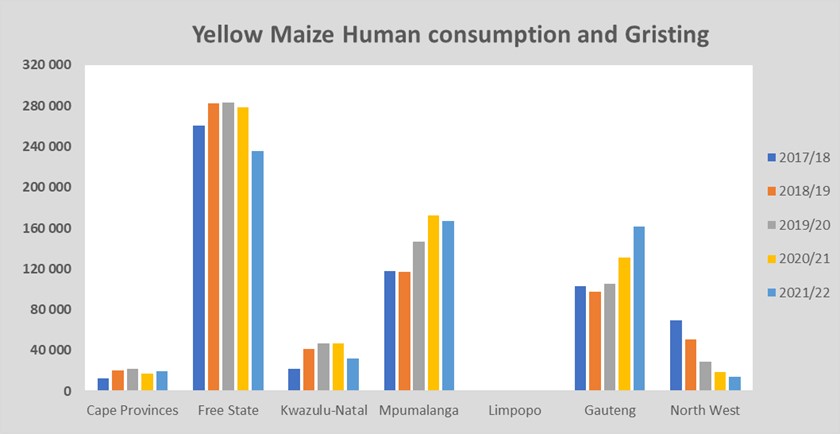
North West has a decreasing trend in yellow maize which is used for consumption and gristing. According to the graph below only 14 450 tons of yellow maize was used in the 2021/2022 season that ended April 2021. That is 22% less than in the 2020/2021 season.
Source: Sagis
- Exchange rate
NWK Group is exposed to foreign exchange rate risk on various business areas, such as commodity prices and trade imports.
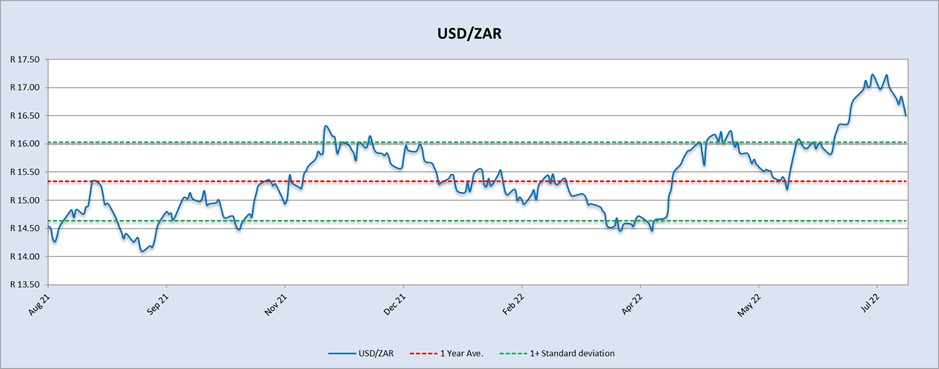
Source: Standard Bank, Corporate and Investment Banking & SARB
On a monthly average basis, the rand depreciated against the US dollar with 6,79% (R1,07) over the period June 2022 to July 2022. The one-year average for rand/US dollar is R15,21. Moreover, the average rand/US dollar exchange rate for the period July 2022 was R16,85 compared to R15,78 in June 2022. Since June the rand/US dollar exchange rate is once again higher than the first standard deviation from the mean.
Exchange rate forecast:
The graph below shows the actual USD/ZAR for 2021 Quarter 4 (Q4) and 2022 Quarter 1 (Q1) against the forecasted figures. The Economy Forecast Trading’s exchange rate forecast for 2022 Q1 was the closest to the actual exchange rate. According to Nedbank and The Enonomy Forecast Agency and Trading Economics the rand will weaken in the year 2022.
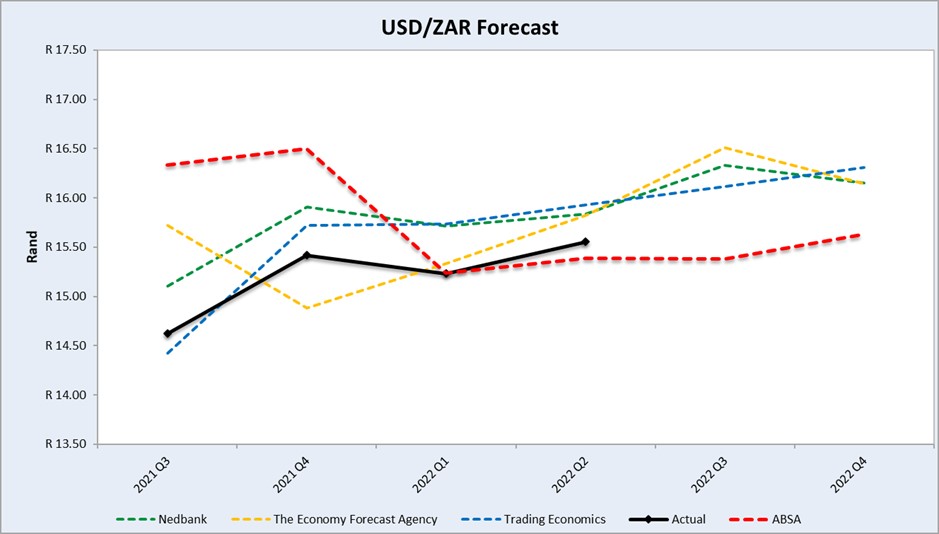
Source: Nedbank CIB; Absa; The Economic Forecast Agency; Trading Economics
- Highlights in the agrochemical sector
A victory for import fertiliser farmers realised on Monday, 18 July, when the US International Trade Commission voted against imposing import tariffs on urea ammonium nitrate from Russia and Trinidad and Tobago. This will bring some relief to producers who are reliant on imported fertiliser.
Furthermore, fertiliser prices also started to decline after the planting season. The evidence found in a fertiliser study determined that increased production costs and supply chain issues were responsible for higher fertiliser prices in 2021 and 2022. The month-to-month change (R/t) for herbicides, insecticides and fertiliser were positive as most of the products experienced prices decreases.
Herbicides
The following products are the main products regarding herbicides that may have an impact on input costs for producers:
- Glyphosate (95%)
- Acetochlor (92%)
- Atrazine (97%)
- Metolachlor (97%)
- Trifluralin (95%)
The following comparison in the tables below is from the July 2022 Grain SA report which reports the previous month’s prices (Table 4 and 5).
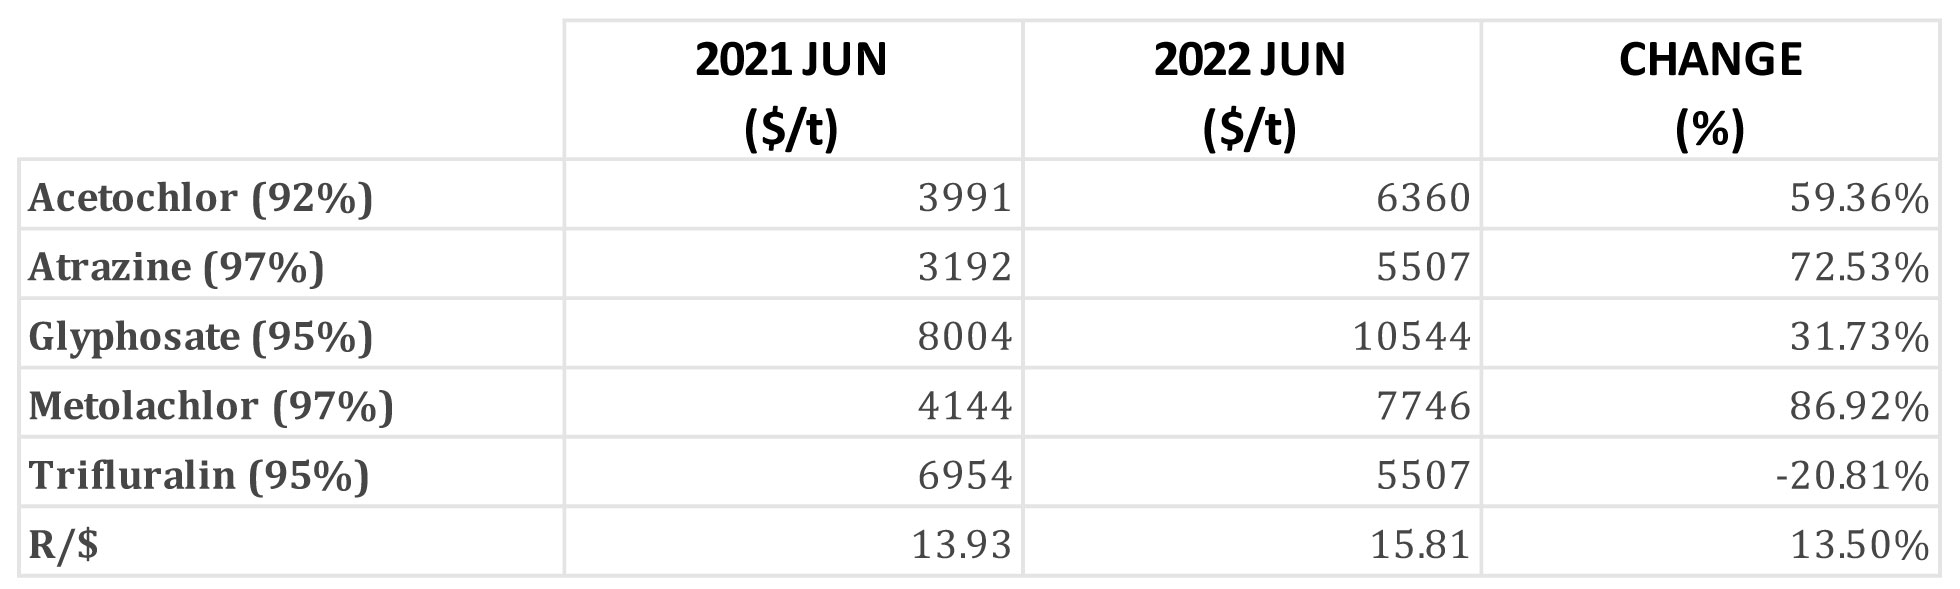
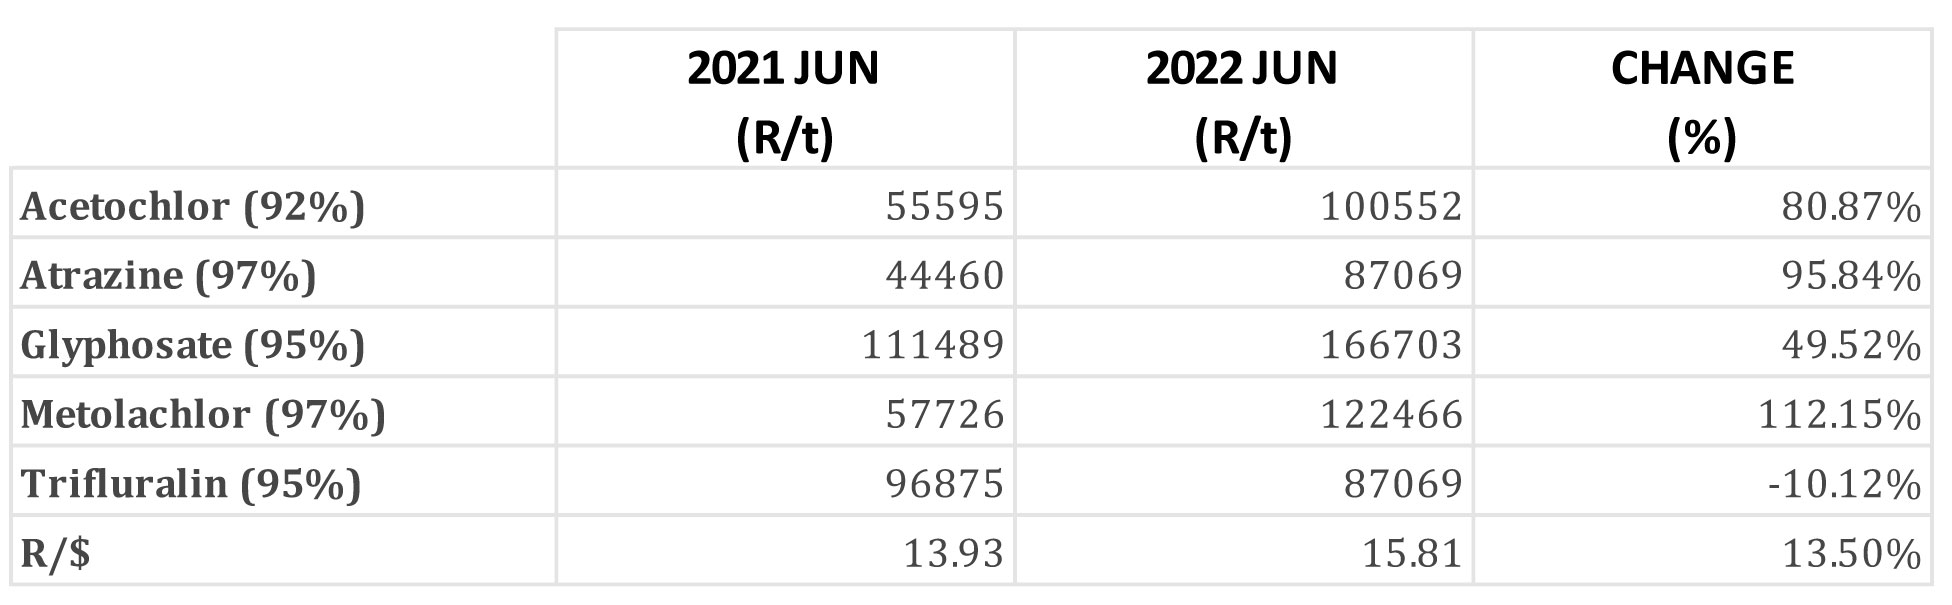
Year to year change (R/t): In comparison with the previous year’s prices, there was a significant increase in prices in four of the five main products. The only product that had a price decrease was Trifluralin with a decrease of -10,12%.
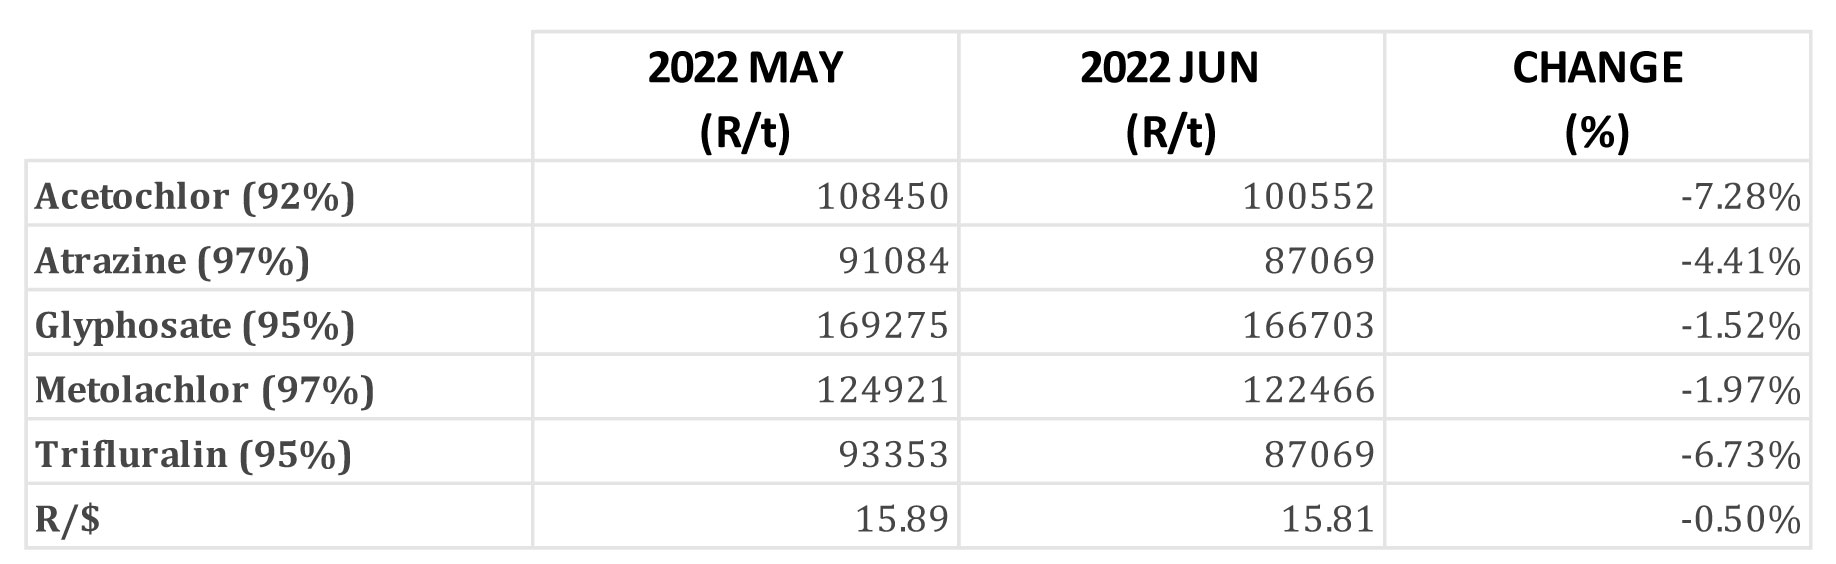
Herbicides – month to month change (R/t): From May 2022 to June 2022 all five products experienced a price decrease. The graph below shows the international herbicides prices (R/t) per product from November 2019 to June 2022.
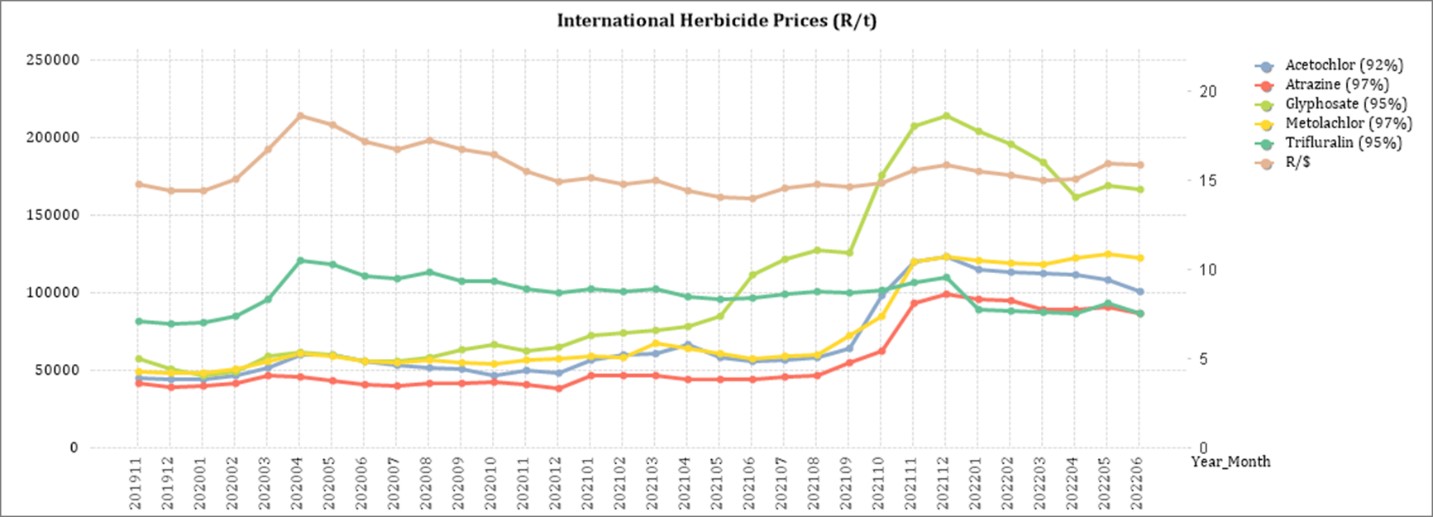
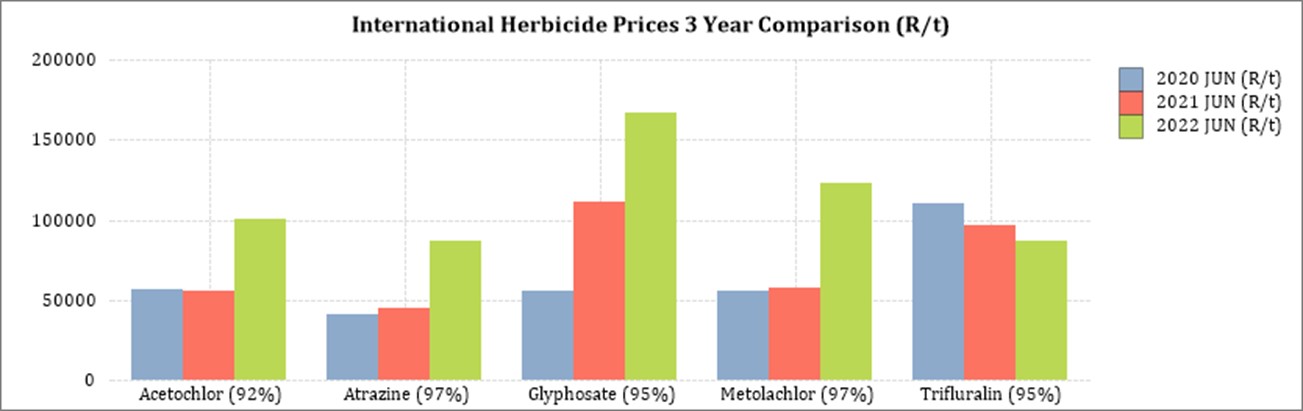
The graph below compares the international herbicides prices (R/t) per product over the last three years. An increase in all of the products excluding Trifluralin can be seen here.
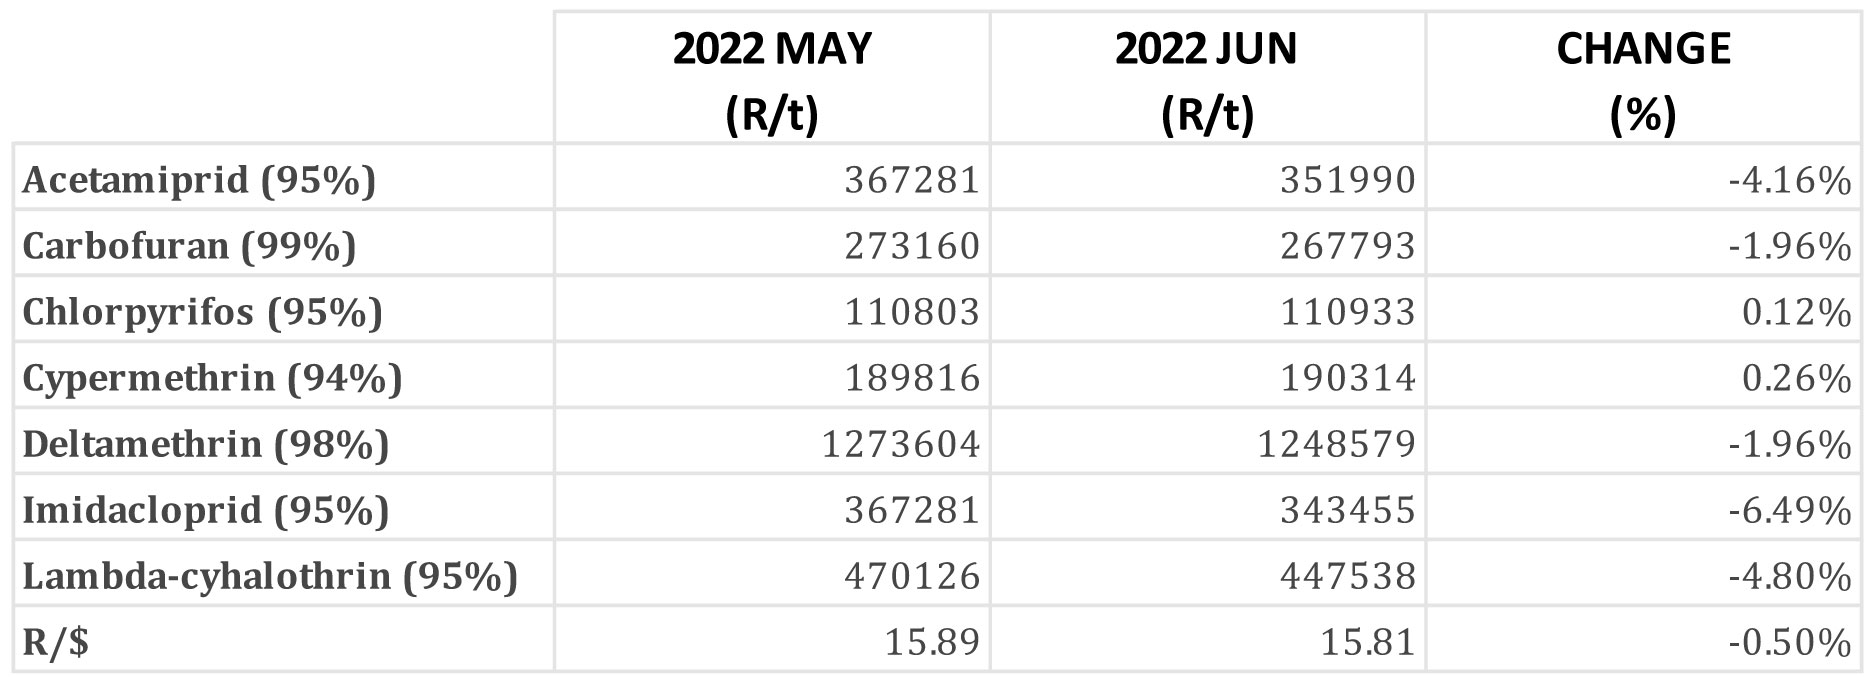
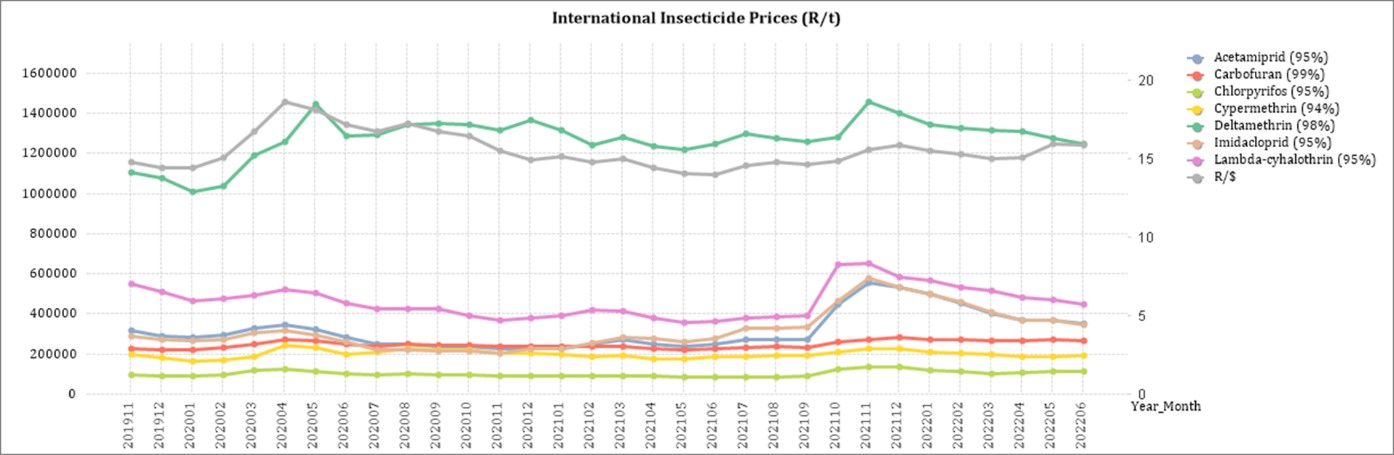
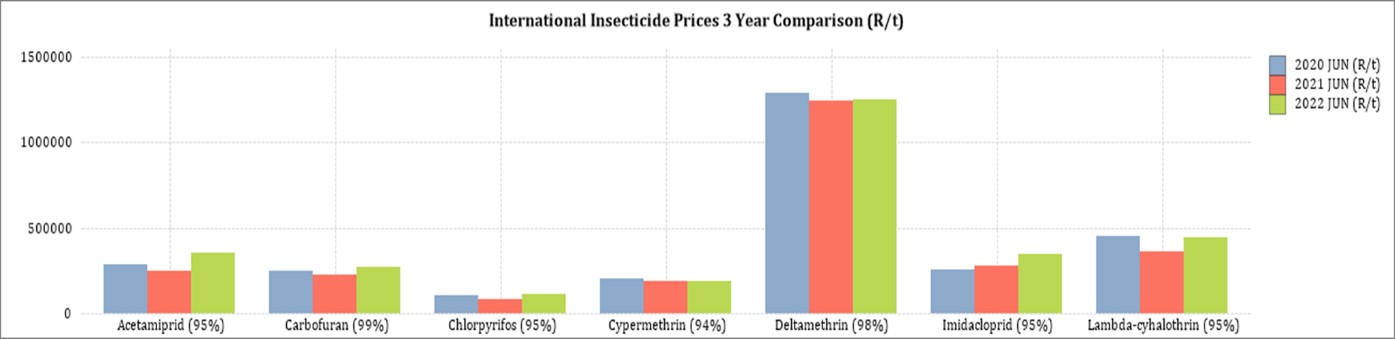
Insecticides
The following products are the main products regarding insecticides that may have an impact on input costs for producers.
Imidacloprid (95%)
Lambda-cyhalothrin (95%)
Carbofuran (99%)
Deltamethrin (98%)
Acetamiprid (95%)
Chlorpyrifos (95%)
Cypermethrin (94%)
Insecticides – year to year change (R/t): In comparison with the previous year’s prices, there was a noticeable increase in prices for four of the four main products. The largest increase was Acetamiprid with an increase of 42,29%.

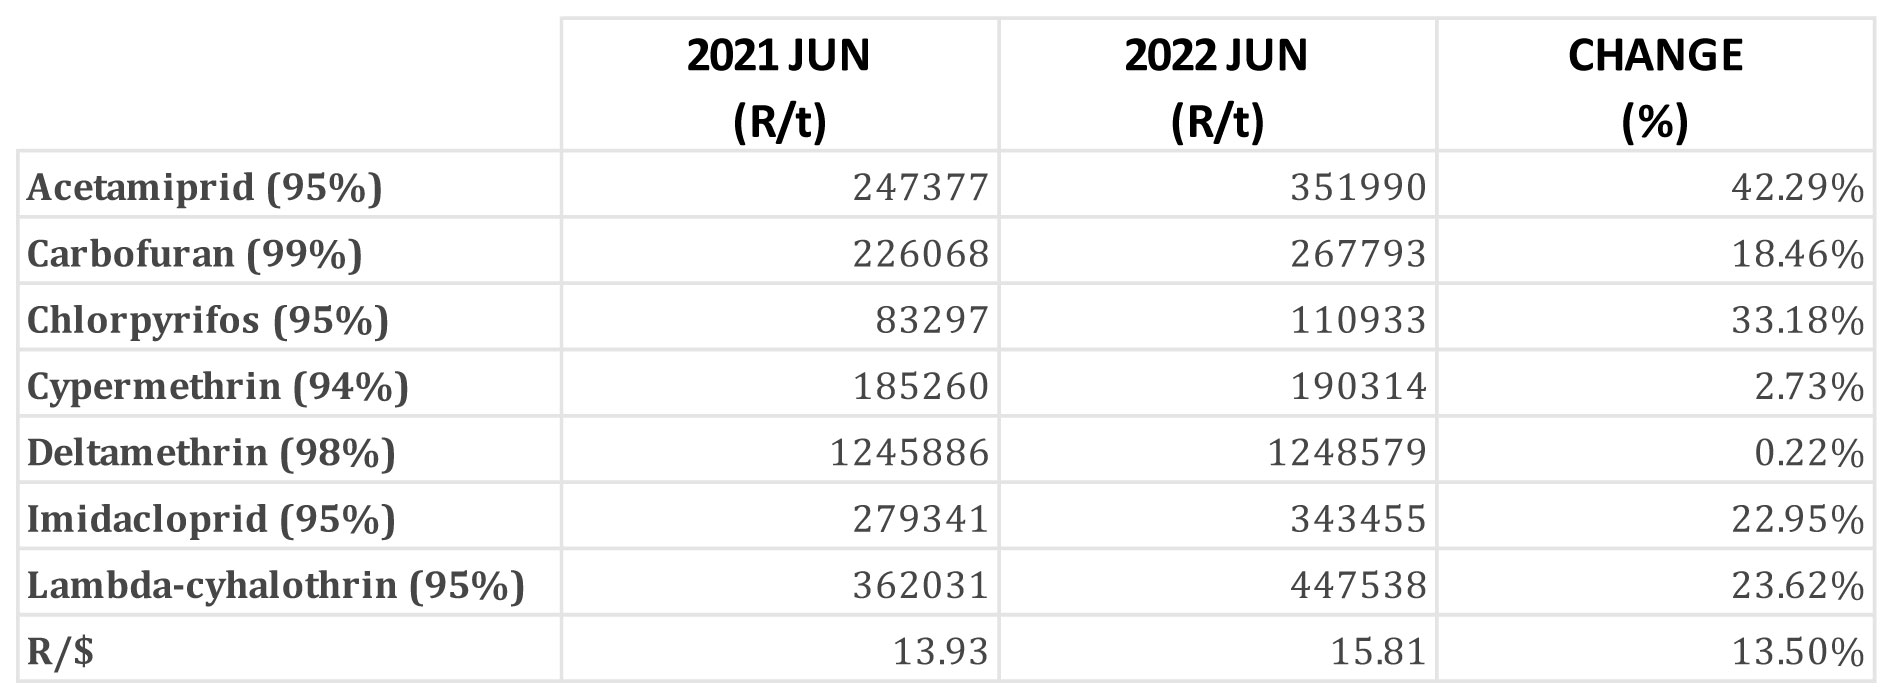
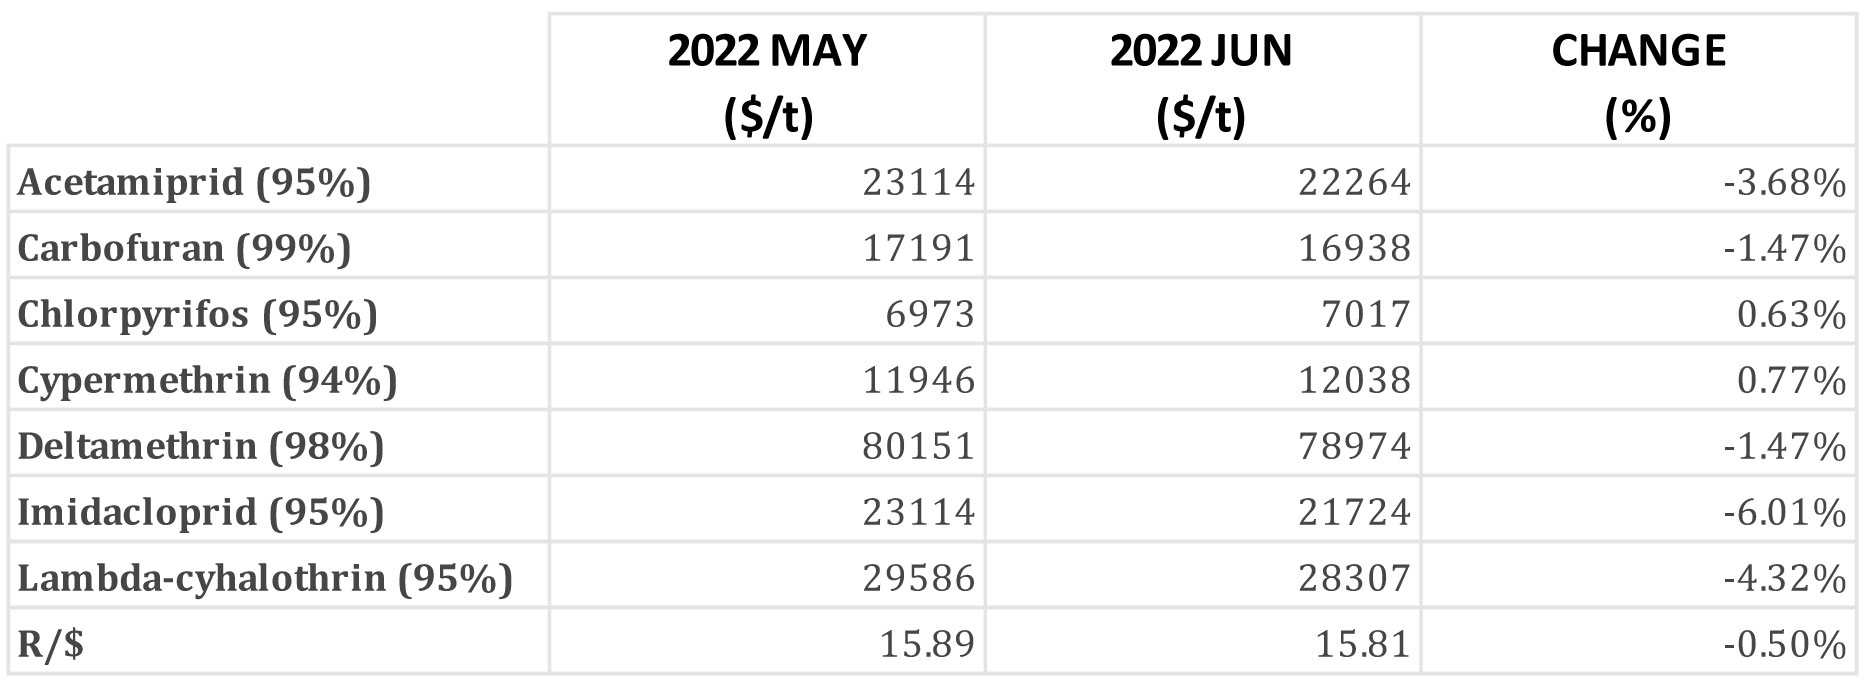
Insecticides – month to month change (R/t): Most of the products experienced a price decrease with only Chlorpyrifos and Cypermethrin experiencing minor price increases of 0,12% and 0,26% respectively.
The graph below shows the international insecticide prices (R/t) per product from November 2019 to June 2022.
The graph below compares the international insecticide prices (R/t) per product over the last three years.
Fertiliser
The following fertiliser products are being analysed:
- Ammonia (Middle East)
- Urea (46%) (Eastern Europe)
- DAP (USA Gulf)
- KCL (CIS)
Urea market: Apparently, a dozen of the biggest Chinese urea producers have been requested by the government to suspend urea exports and this kept traders from purchasing Chinese product. The urea market is expected to remain volatile, with the price ready to turn either up or down very quickly as events unfold. Many urea producers around the world are reporting high inventory levels, which is not unusual for this time of year as the market emerges from the quietest quarter of the year and anticipates Q3 buying to pick up.
Ammonium nitrate market (AN): The unexpected surge in European gas prices caused havoc with ammonia prices. Most European ammonia producers idled their plants and are therefore dependent on imported ammonia. The ammonia traders are of course aware of this dependency and were quick to seize the opportunity when European ammonia consumers came into the market, and this increased Middle East ammonia price (this is unhappy news for the primary ammonia importers such as Omnia and Foskor).
Phosphates: In Brazil, Russian imports boosted stock levels and with limited demand, the importers are forced to discount the price. International, lack of demand (due to high prices) is putting MAP prices under pressure. Opinions suggest that MAP should settle around the $900/t FOB mark. Approximately 2 million tons of phosphate export quotas have been approved by the Chinese government. For Q3 2021 Chinese phosphate exports were around 3,7 million tons so the quota volume is still well short of historical volumes.
The quota volume is expected to grow as Q3 has only just started and applications are ongoing, with estimates suggesting around 2.5 million tons could be exported during this quarter. Recent trade data for South Africa shows that MAP imports for January to May period were similar to the same period last year. The bulk of this volume comprised two shipments – one from Russia and the other from the Middle East. In the same period South Africa (Foskor) exported 224 000 tons of phosphate rock, whereas for the same period last year no rock was exported at all.
Potash: The potash market is characterized by very weak demand and prices that have been under downward pressure are now starting to edge lower. Supply from Russia and Belarus are more than expected with the result that stocks are relatively high in many importing regions. The high price of potash negatively impacted demand and retail sales volumes decreased compared to previous years. The market is focusing on Brazil and looking at retail sales to gauge demand as Q3 progresses. If sales remain slow, then potash prices will come under further downward pressure that will cascade across most markets, including Southern Africa. If Brazilian sales are very strong, then potash prices will likely stay at the current $1,000/t level for the coming months.
General highlights
- The Durban port inefficiency is creating a massive challenge and cost for the agricultural industry. Inbound vessels are realizing a minimum of 15 days demurrage and in many cases, the demurrage is 30 or more days (vessel time-charter rates are $35 000 to 40 000 per day).
- Warnings by industry experts are that producers should think more proactive about fertiliser purchases and seriously consider buying earlier than later, not just for price reasons but also to reduce exposure to the port chaos which might result in higher costs.
Source: F Curve Insight
Source: Agweb JounalStoneX Fertilizer Prices Have Dropped, Should You Book 2023 Needs? | AgWeb
Source: GrainSA
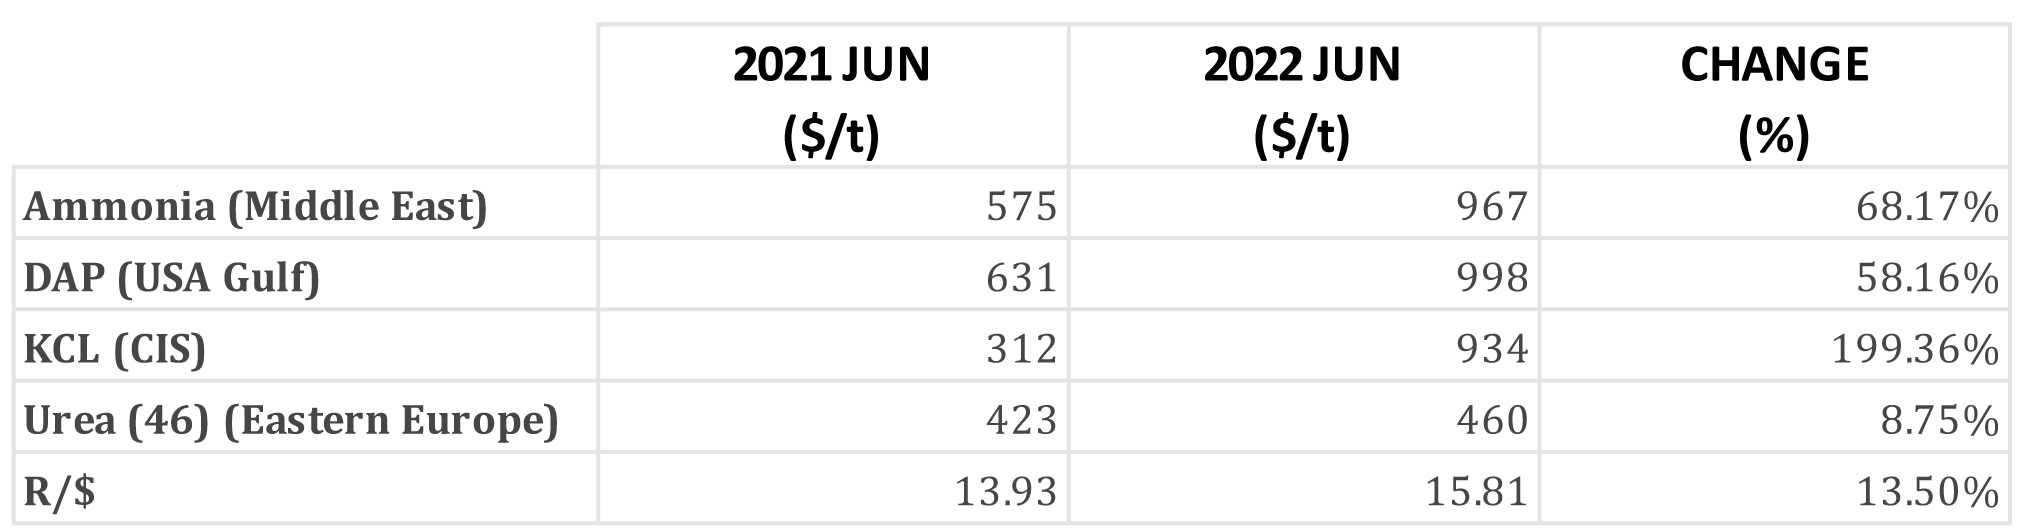
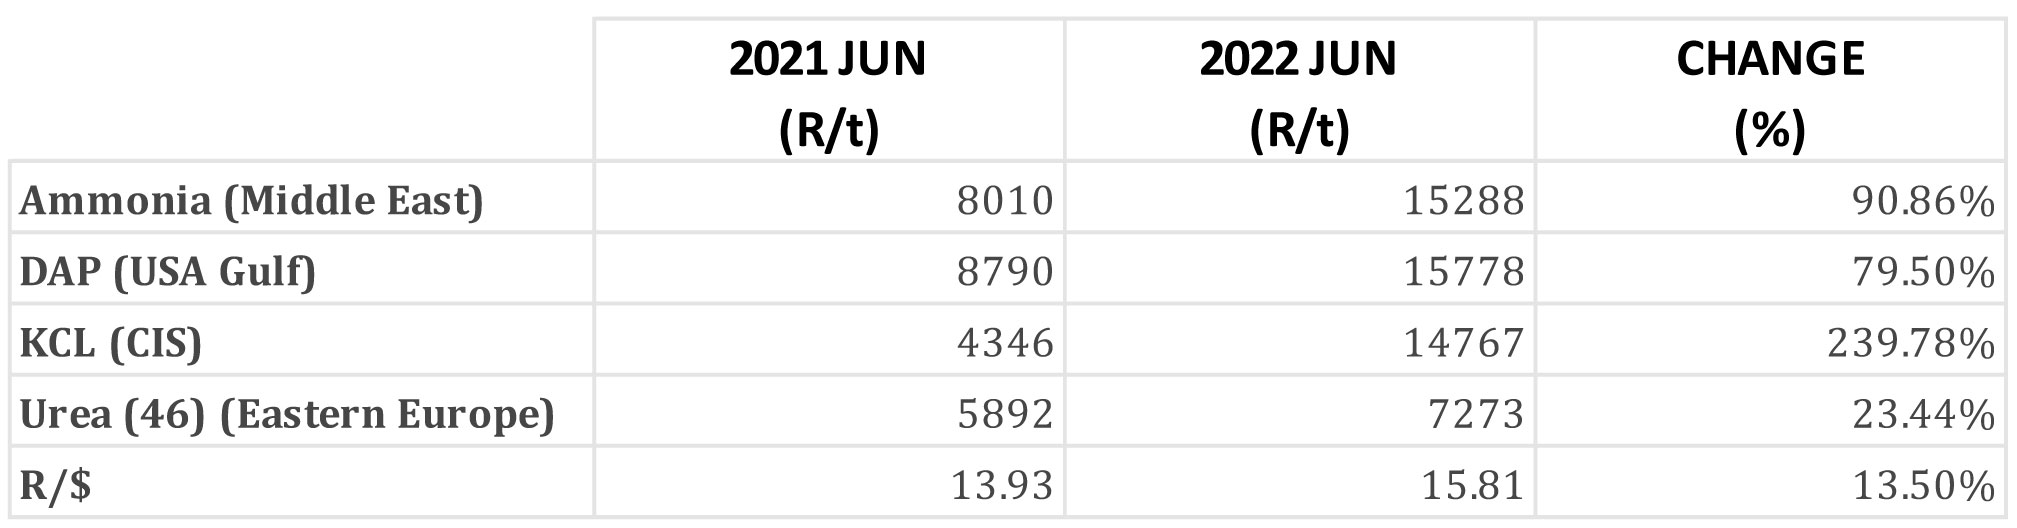
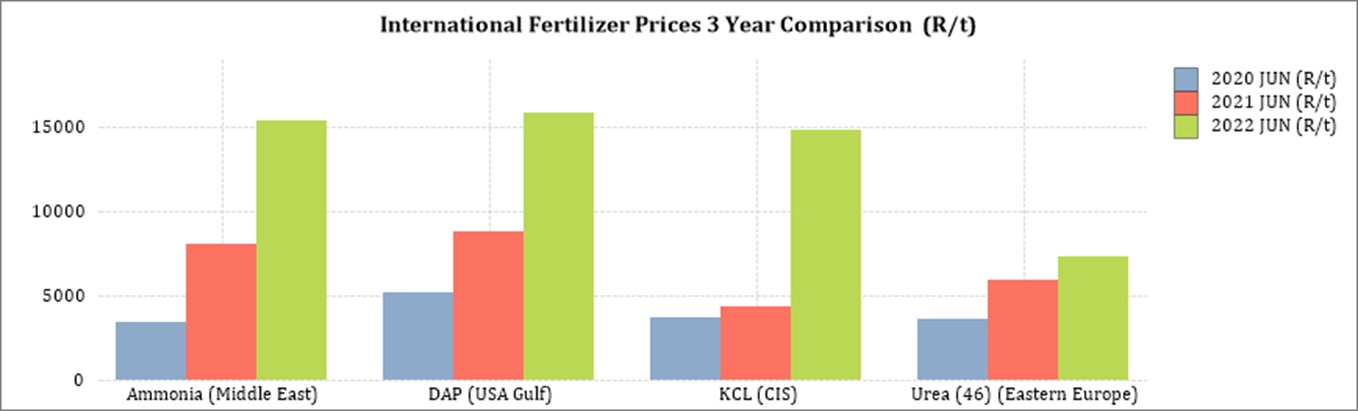
Fertiliser – year to year change (R/t): As seen in the table above all of the main fertiliser products increased significantly from June 2021 to June 2022. The biggest increase, based on average international prices (R/t), was KCL (239,78%), followed by ammonia (90,86%), DAP (79,50%) and urea (23,44%).
The exchange rate differs 4,3 % from the previous year, meaning the increase in rand terms was also due to the exchange rate.
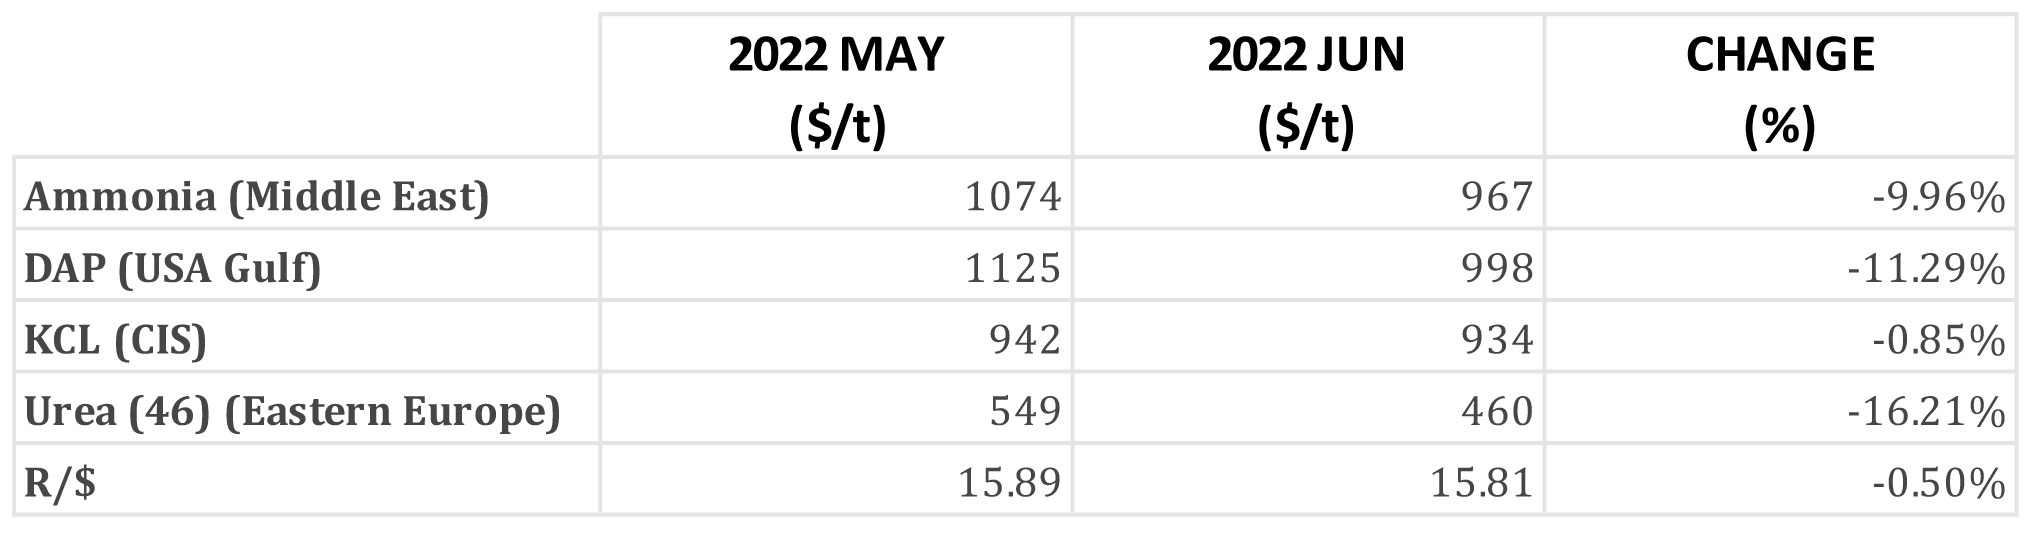
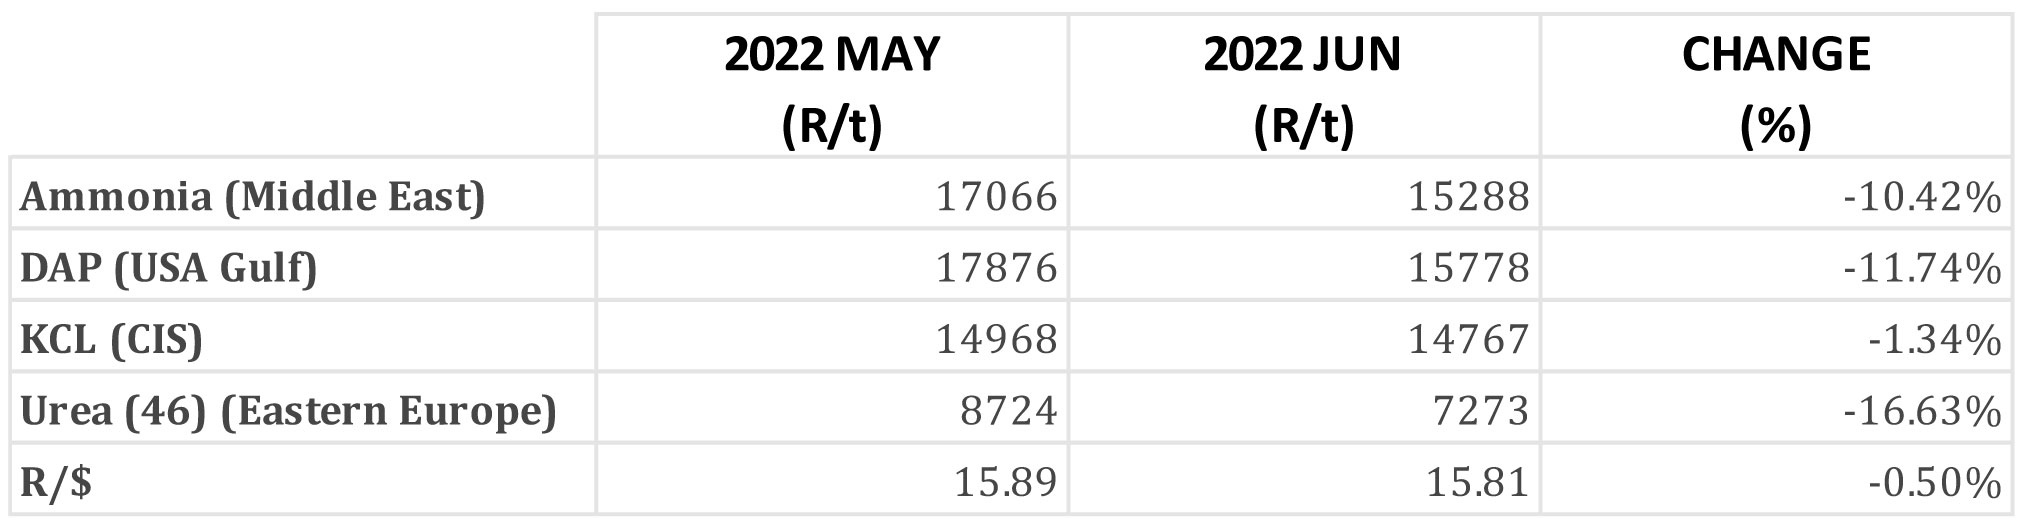
Fertiliser – month to month change (R/t): For the two months May 2022 to June 2022, all products experienced a decrease in price per ton.
The graph below shows the international fertiliser prices (R/t) per product from November 2019 to June 2022.
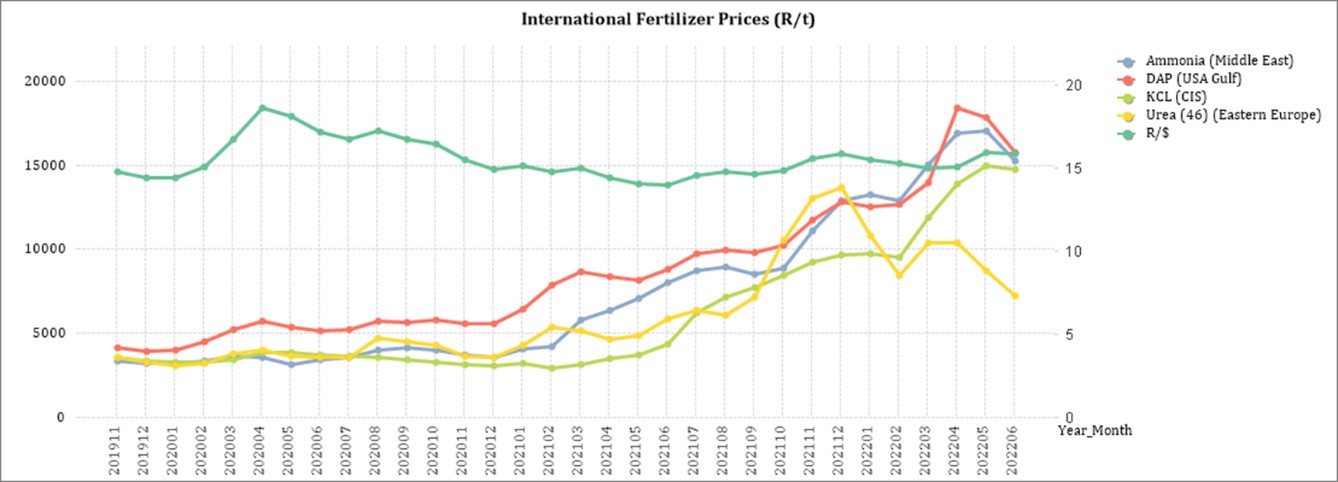
On the graph below the significant increase in international fertiliser prices can be seen.
Sources:
Grain SA
https://www.dtnpf.com/agriculture/web/ag/crops/article/2022/07/18/itc-rules-import-tariffs-uan-russia
https://www.dtnpf.com/agriculture/web/ag/crops/article/2022/06/29/fertilizer-prices-fade-demand
https://www.dtnpf.com/agriculture/web/ag/crops/article/2022/06/23/fertilizer-study-sheds-light-higher
- Economic impact of the Russia-Ukraine war
Impact on the broader economy
Despite South Africa’s special role with Russia via the BRICs (Brazil, Russia, India, China, and South Africa) grouping of middle-income countries, the South African government took a stronger stance, calling for Russia to withdraw its forces.
The invasion of Ukraine by Russia has a ripple effect on the world economy. Various countries will feel the short- and long-term effects of this war. Not all is however negative as a few possibilities arise in the short term.
For one, Ukraine is the biggest exporter of Sunflower oil followed by Russia. Russia also ranks first in the world for holding 24% of the world’s total natural gas reserves. Europe receives 30% to 40% of its total gas from Russia and it is going to be difficult to wean itself from Russia to loosen Vladimir Putin’s grip on European countries. Evidentially the price of sunflower oil and natural gasses increased as exports from Russia and Ukraine are backed-up. Brent crude oil recently reached $130 per barrel and analysts predict even further increases. European natural gas also jumped 62%. Despite this several other countries who are also suppliers of sunflower oil and natural gasses may benefit from this war as countries will have to look elsewhere for their usual imported resources.
International sanctions placed on Russia could place a growing demand on palladium as Russia is the world’s biggest producer of palladium with South Africa second. Palladium is a critical component in the manufacturing of automobiles and electronics. Similarly, Russia and South Africa are major exporters of gold and the South African rand has been strengthening as a result of rising global prices for the precious metal.
Despite these possibilities the attack on Ukraine could pose hardships for households, the agricultural sector and food security. The rising price of oil is causing fuel prices to increase and consequently lead to transport being a luxury. In fact, South Africa’s automobile association (SAA) predicts record-high fuel prices for March. On 6 March City Press reported that fuel prices may even hit R40 a litre. Ridiculously high fuel prices and fertiliser prices (see point 3.1.7) will shake the economy and consumers hard.
Source: Business Tech
Economic impact of load shedding on the agricultural sector
Energy experts have warned that maintenance being done on Eskom’s ageing and failing fleet of power stations is ineffective – with the power utility itself admitting that it is only able to temporarily halt the decline. The reality is that load shedding will continue for years to come and the negative impact on the economy is severe.
Alexander Forbes chief economist Isaah Mhlanga said Eskom’s prolonged stage 6 load shedding has already caused significant damage to the country’s economy, with over R4 billion wiped from the GDP for each day it continues. Analysis by Bloomberg pointed out that at 2,276 gigawatt-hours cut by Eskom this year so far, South Africa is already at 90% of the gigawatt-hours cut in 2021 entirely.
The table below indicates the GDP lost per hour per sector due to load shedding:
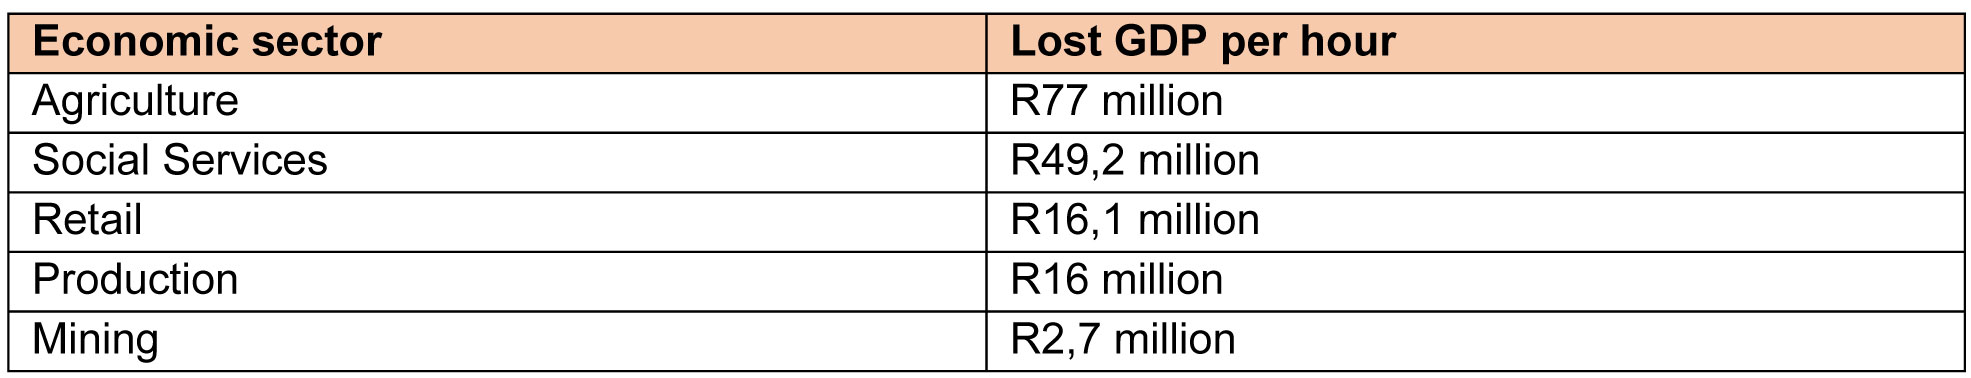
From this table it is clear that the agricultural sector loses the most GDP per hour. Modern farming businesses have become extremely dependent on electricity to run their irrigation, cooling, pumping stations, and mechanization. producers may need to find alternative power sources. These sources, while reliable, come at a cost. With increasing fuel costs as a result of the Russian-Ukrainian war and the big fuel consumption nature of generators, investing in a generator as a power source may not be a sustainable solution – especially for small-scale producers who are sensitive to increasing variable costs. When producers fail to find alternative sources, they take the risk of forfeiting water quotas for irrigating purposes which can cause the business to go under.
Machinery and equipment are damaged and repairment comes to a standstill as a result of power outages. producers may be forced to work after hours when there is electricity, leading to increased expenditure on overtime wages and increasing production costs. Some producers may not be able to afford this, given that production costs such as fertilizer and fuel have already increased a lot over the last few months.
When producers struggle, the agricultural sector is bound to feel the impact. A decline in production poses the biggest threat to the sector as it is, among other things, reliant on stock made available by producers. In summary, no yield means no stock in the silos and no income from millers. Not to mention the transport income, income from premiums received on commodities sold and the loss of sales in retail stores due to less expenditure by producers.
The producers’ production has a direct impact on their ability to repay loans. With increasing inflation and higher interest rates in South Africa, the repayment capacity of loans decreases and are less likely.
Decreased economic growth possible implications:
- Decreased foreign investment.
- Decreased sales – grain and retail.
- Increased operation cost (generator fuel cost).
- Decreased income from mechanisation.
- Weakening infrastructure.
- Inflation leads to higher input costs.
- Fluctuating and volatile markets.
- Decreased productivity and efficiency.
- Damage to electronic devices as power goes on and off.
- Increased theft.
- Overall increased risk and uncertainty.
According to Christo van der Rheede, Agri SA’s executive director, load shedding also poses a risk for food security and social stability.
In response to this energy crisis, Solidarity has appealed to everyone who is able to generate electricity on small scale to apply for power generating permits in an attempt to solve the electricity crisis. Regulations have been amended and up to 100 MW can be generated with a permit. However, a license is required when generating more than 100 MW.
In summary, load shedding poses long term risks for the agricultural sector on a supply and input cost level. Cost effective and sustainable alternative solutions must be considered in order to lighten the load on Eskom and reduce the dependency on Eskom for electricity.
Sources
https://businesstech.co.za/news/energy/602470/experts-give-bleak-outlook-for-load-shedding-in-south-africa-report/
https://maroelamedia.co.za/nuus/sa-nuus/tshwane-bekommerd-oor-beurtkrag-wipwaentjierit/
https://maroelamedia.co.za/nuus/sa-nuus/private-verskaffers-kan-kragrevolusie-veroorsaak/
https://www.chaifm.com/podcast/2022-07-06-christo-van-der-rheede
- Future prices
The graphs below illustrate the market sentiment for maize, in the form of future contracts, for the upcoming contract months. The market sentiment is the expectation of supply and demand fundamentals relating to white and yellow maize in South Africa.
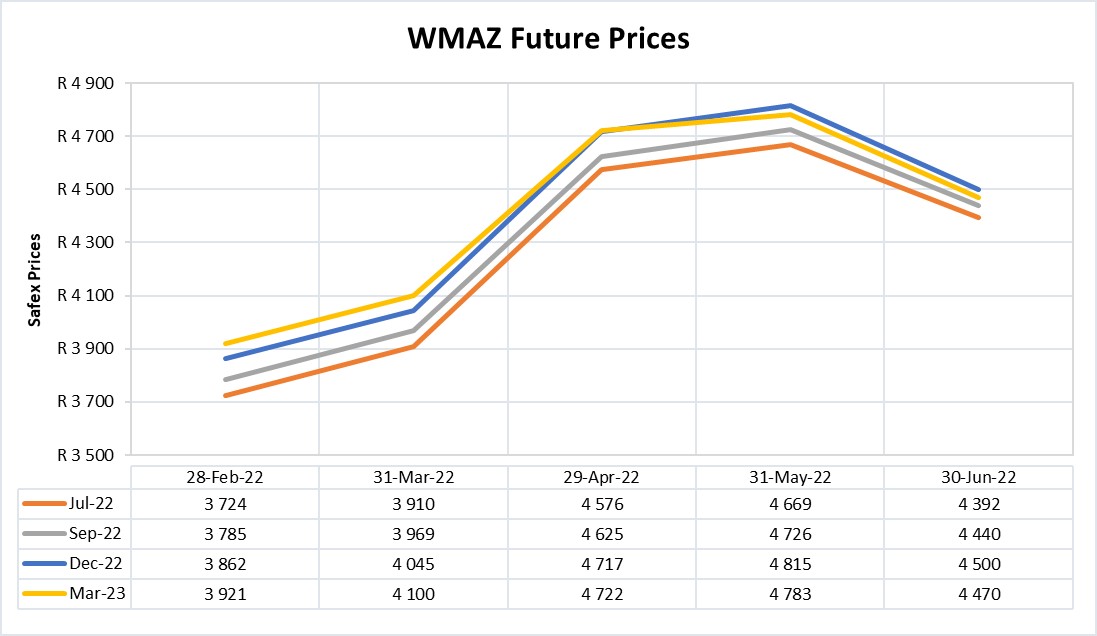
Source: Sagis/JSE
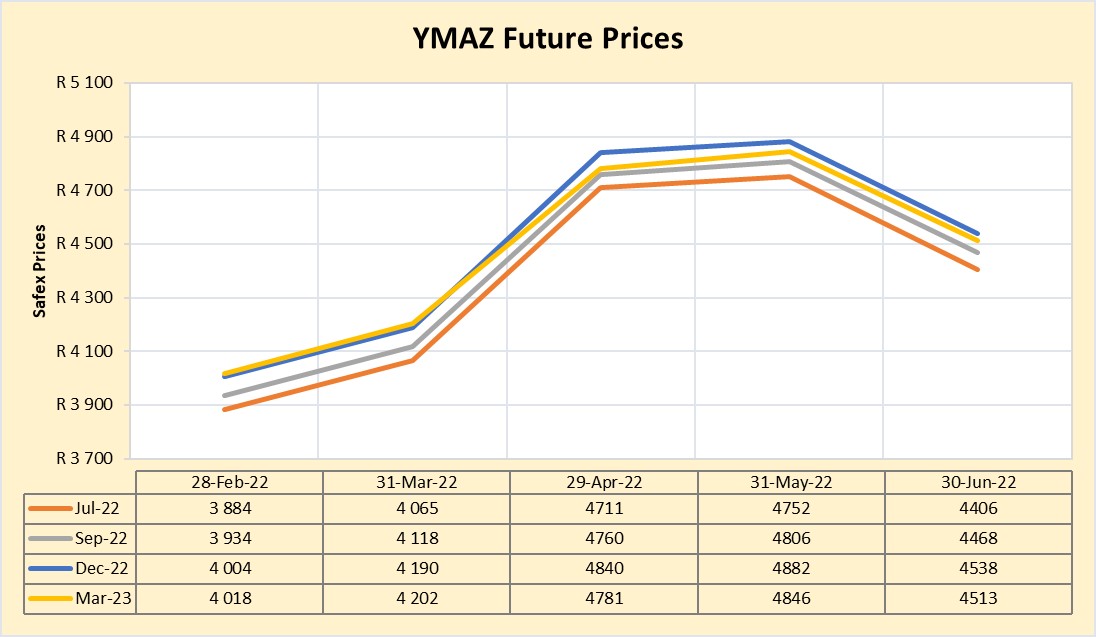
Source: Sagis/JSE
The decrease in WMAZ and YMAZ future prices are due to more supply during harvest season and the unfavourable exchange rate due to the strengthening dollar.
INTEREST RATE RISK
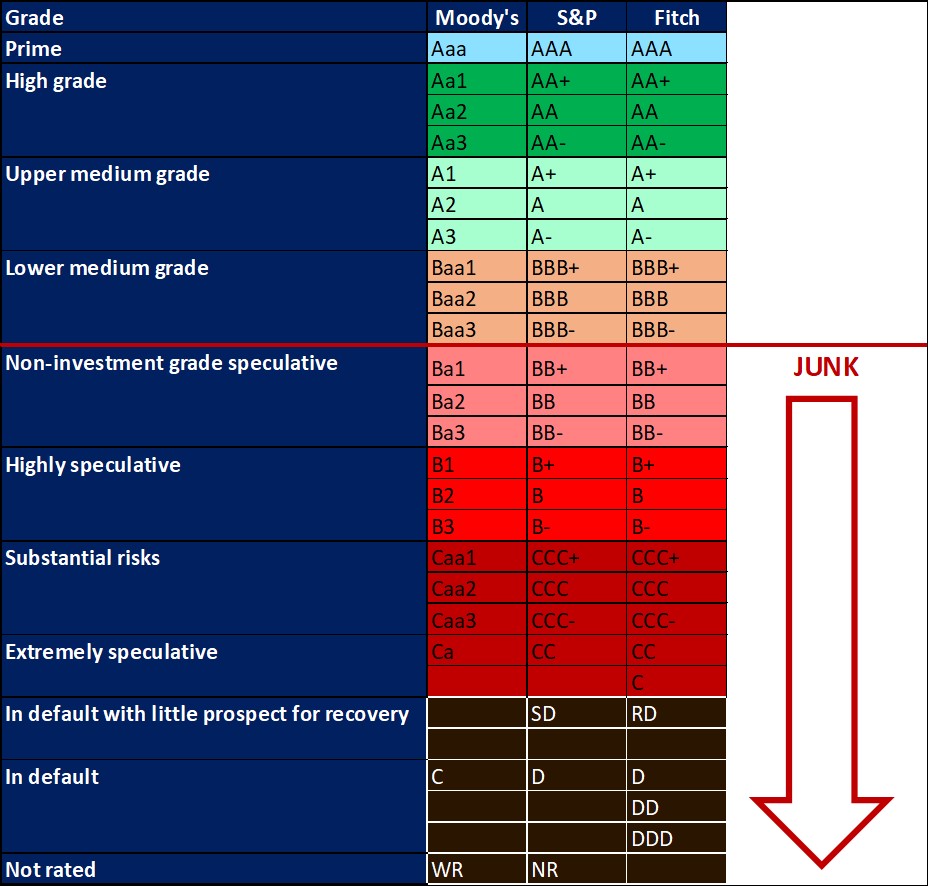
On 27 March 2020, Moody’s downgraded South Africa’s sovereign credit rating to sub-investment grade and placed a negative outlook on the rating. The key drivers for this downgrade include weak economic growth, continuous deterioration in fiscal strength, and slow progress on structural economic reforms. It is now the first time in post-apartheid South Africa where all major rating agencies, i.e., Moody’s, Fitch and S&P, have South Africa’s credit ratings in sub-investment grade territory. More than a year later and our Moody’s rating remains the same.
The Covid-19 pandemic forced the South African Reserve Bank to make a number of interest rate cuts to bring relief to the economy, but as from November 2021 the prime interest rate experienced five increases. The latest increase of 75 bps is the biggest hike since 2002. Professor Raymond Parsons is of the opinion that given present global and domestic economic cross-currents, a more aggressive monetary policy raises the risk that it may well now come at a cost in growth and employment. The next MPC meeting date is 22 September 2022.
Interest rate movement:
- 18 November 2021: 7,25%
- 27 January 2022: 7,50%
- 24 March 2022: 7,75%
- 19 May 2022: 8,25%
- 21 July 2022: 9,00%
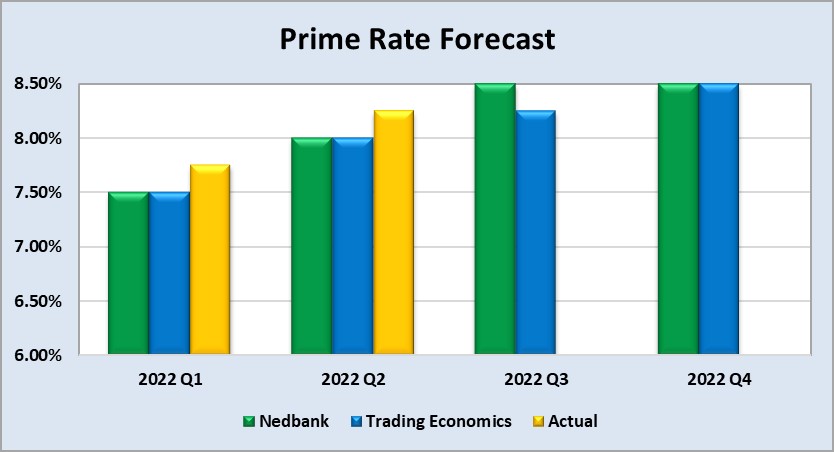
The graph below shows the prime rate forecast for 2022 Quarter 1 to 2022 Quarter 4. Nedbank as well as Trading Economics’ forecast that the prime interest rate will increase with 50 basis points by the end of Q2. The forecast realised on 19 May 2022 when the MPC increased the prime interest rate with a further 50 basis points. Both Q1 and Q2 experienced higher interest rates than anticipated by Nedbank and Trading Economics.
Fraud risk
FRAUD AWARENESS
Here are three fraud prevention tips:
- Resist pressure: Legitimate companies and charities will be happy to give you time to make a decision. It’s probably a scam if they demand that you act immediately or won’t take “no” for an answer. Some scammers may also demand you pay off a loan immediately or damaging consequences may occur, always take time to look into who is requesting the money before you pay up.
- Don’t believe promises of easy money: If someone claims that you can earn money with little or no work, get a loan or credit card even if you have bad credit, or make money on an investment with little or no risk, it’s probably a scam. Oftentimes, offers that seem too good to be true, actually are too good to be true.
- Fully understand the offer: A legitimate seller will give you all the details about the products or services, the total price, the delivery time, the refund and cancellation policies, and the terms of any warranty. Contact the seller if any of these details are missing, if they are unable to provide the details, it may be a sign that it’s a scam.


