The NWK Limited external factors report provides an overview of the main external factors that NWK and its clients are exposed to at a specific point in time. This report opts to aid in a timely basis to foresee external market and other factors that may have an impact on any business and clients. The main focus of this document is to have a closer look at external factors that can affect any business and our customers.
Executive summary
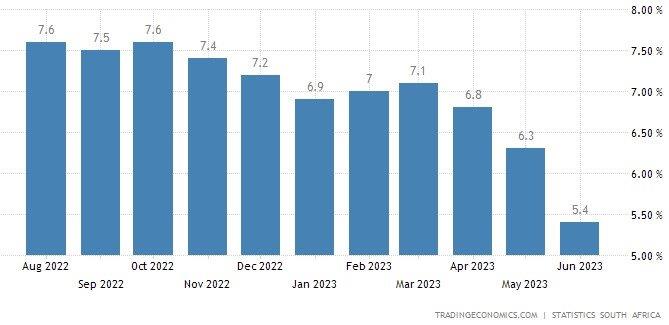
Fortunately, the inflation rate fell further in June to 5,4%. Retail trade decreased with 0,9% in June on a year-to-year basis. The unemployment rate eased slightly to 32,6% in the first quarter of 2023. The GDP growth for the first quarter was 0,4% which enabled South Africa to avoid a technical recession. The Policy Uncertainty Index reached a new historical level high of 76,2 points in Q2.
The National Agricultural Marketing Council (NAMC) projected the ending stock for 30 April 2024 of white and yellow maize to be less than the 2022/2023 season. According to the sixth maize forecast the three main maize producing areas, namely the Free State, Mpumalanga and North West are expected to produce 83% of the 2022/2023 crop.
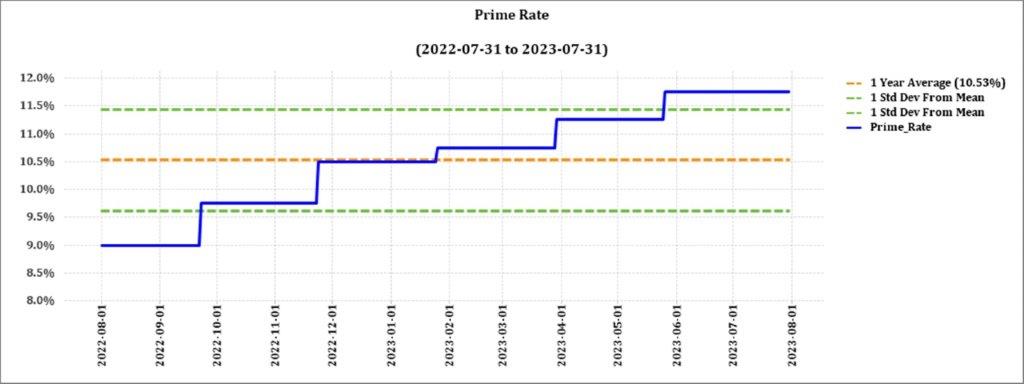
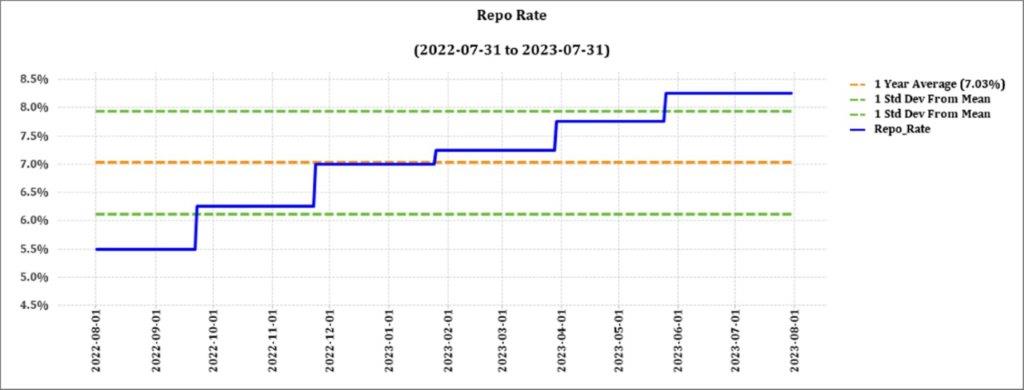
During the previous Monetary Policy Committee (MPC) meeting held on 20 July the committee decided that interest rates will remain unchanged. The repo rate is currently 8,25% and the prime rate 11,75%.
Load shedding poses long term risks for the agricultural sector on a supply and input cost level. Cost-effective and sustainable alternative solutions must be considered in order to reduce the dependency on Eskom for electricity. Even more so now that tariff hikes of 18,65% have been approved.
According to the World Economic Forum (WEF) the number one short term risk is cost of living despite the ease in inflation.
Business climate: Key risk drivers
A few highlights regarding certain risk drivers are mentioned below.
According to Trading Economics South Africa’s annual inflation rate fell to 5,4% in June 2023 from 6,3% in the prior month, still above the upper limit of the South African Reserve Bank’s target range of 3% to 6%. Food (11%) saw a 0,8% decline in inflation during June.
Brent crude oil monthly average prices increased by $5,27 per barrel from June to July. South Africa’s retail trade decreased with 0,9% from a year earlier in June. The seventh consecutive month of decline in retail activity.
According to Statistics SA, South Africa’s unemployment rate was at 32,6%. According to Statistics SA, South Africa’s unemployment rate eased slightly to 32,6%. In the second quarter of 2023, about 894 000 people were employed in primary agriculture, up 1% q/q and 2% y/y. This is the highest farm employment level since the last quarter of 2016 and is well above the long-term agricultural employment of 780 000.
The GDP growth rate rose to 0,4% on quarter for the first quarter in 2023, thus avoiding a technical recession. Eight of the ten activities picked up in the first quarter.
The local Safex price was considered unprofitable according to July 2023 white maize spot prices. According to the World Bank’s grain price index wheat and maize prices declined 8% in the first quarter. The war in Ukraine remains a major risk that could unsettle wheat, maize, oilseeds, and fertiliser prices. South Africa’s new season looks positive and it seems that Africa will once again have a high demand for maize which will support prices. Agricultural prices are forecast to decline by 7% in 2023 before stabilizing in 2024.
Adverse weather patterns can reduce yields and also affect the Safex price; during June sea-surface temperatures rose, moving toward an El Niño by June to December. The solar cycle is approaching its turning point in 2025, which also indicates less rainfall predicted for coming years.
The iron ore price saw a slight increase of $0,48 per metric ton from June to July. Prices for iron ore cargoes with a 63,5% iron ore content for delivery into Tianjin were near $105 per tonne, close to the two-month low of $103,50.
The Policy Uncertainty Index (PUI) reached a new historical level high of 76,2 points in Q2. Global and domestic factors outweighed the positive resulting in a significant increase of uncertainty. The PUI is the net outcome of positive and negative factors influencing the calibration of policy uncertainty over the relevant period. It is seen to have important implications for business confidence and the investment climate in the country.
Sources
https://tradingeconomics.com/south-africa/inflation-cpi
https://tradingeconomics.com/commodity/brent-crude-oil
https://tradingeconomics.com/south-africa/unemployment-rate
https://www.agbiz.co.za/content/open/21-august-2023-agri-market-viewpoint-747
https://tradingeconomics.com/south-africa/gdp%20growth#:~:text=South%20Africa%20GDP%20Grows%201.2,expectations%20of%20a%200.7%25%20growth
https://www.statssa.gov.za/?page_id=737&id=1
https://tradingeconomics.com/commodity/iron-ore
NWU Business School Policy Uncertainty Index (PUI) 4Q 2022_09012023_pdf
https://openknowledge.worldbank.org/server/api/core/bitstreams/6864d537-d407-4cab-8ef1-868dbf7e07e2/content
Agbiz/IDC ACI remains subdued in Q2, 2023
The Agricultural Business Chamber (Agbiz) quarterly conducts a survey in order to create an Agribusiness Confidence Index (ACI). The Agbiz/IDC ACI, which was released on 13 March 2023, reflects the perceptions of at least 25 Agribusiness decision-makers on the ten most important aspects influencing a business in the agricultural sector.
These ten aspects are:
- turnover;
- net operating income;
- market share;
- employment;
- capital investment;
- export volumes;
- economic growth;
- general agricultural conditions;
- debtor provision for bad debt; and
- financing cost.
These aspects are used by agribusiness executives, policymakers and economists to understand the perceptions of the agribusiness sector. It also serves as a leading indicator of the value of the agricultural output while providing a basis for agribusinesses to support their business decisions.
After a 4-point decline in Q4 2022, the Agbiz/IDC (ACI) deteriorated further by 5 points in Q1 2023 to 44. The current reading is the lowest since Q2 2020 when Covid-19 lockdown restrictions were first implemented. Notably, the first quarter reading is below the neutral 50-point level, implying that agribusinesses are downbeat about business conditions.
The persistent and intense episodes of load-shedding, higher input costs, rising protection in some export markets, rising interest rates, intensified geopolitical tensions which disrupted supply chains, and ongoing weaknesses in municipal service delivery, and network industries were again the key factors survey respondents cited as their primary concerns. This survey was conducted in the final two weeks of February, covering businesses operating in all agricultural subsectors across South Africa.
The graph below shows the Agribusiness Index from 2002 to middle 2022.
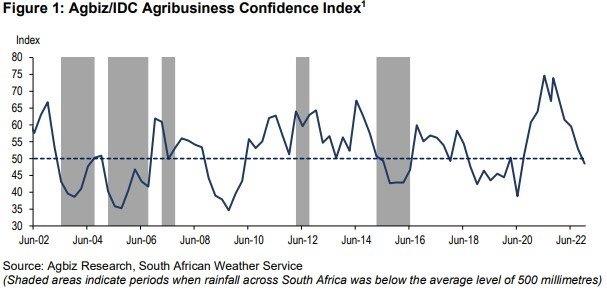
Agbiz/IDC Agribusiness Confidence Index.
The ACI is comprised of ten subindices, of which seven declined in the first quarter of 2023. The turnover subindex fell by 9 point to 69, while the net operating income subindex fell by 2 points to 61 points. The rise in net operating income subindex mainly reflects better operating conditions in the grains and oilseeds businesses.
The employment subindex confidence increased by 12 points to 47. This is below the 50 neutral level and signals concern about employment levels.
Confidence in the capital investments subindex decreased with 7 points to 59. This is not a surprise as interest rates keep rising and load-shedding is persistent.
The subindex measuring the volume of exports sentiment rapidly declined by 13 points to 63. This is unsurprising given the solid export activity we observed in 2022, and there are hopes that it will continue this year, notwithstanding worries about crop conditions in some areas.
Confidence in the general economic conditions fell by 14 point to 11. This speaks to the challenging business conditions.
The general agricultural conditions subindex fell by 9 points to 31, which is the lowest level since the last quarter of 2019. This perhaps reflects the effects of excessive rains at the start of South Africa’s 2022/2023 summer crop season which threatened yield prospects.
The warm weather at the end of January helped improve conditions on farms. Then again, the rainfall from mid-February provided a much-needed breather and improved crop conditions.
The market share of the agribusiness’s subindex dropped by 10 points to 58. The decline was mainly driven by respondents in the horticulture and livestock industries.
The subindices of the debtor provision for bad debt and financing costs are interpreted differently from the abovementioned indices. A decline is viewed as a favourable development, while an uptick signals growing financial strain. In the first quarter, the subindex for debtor provision for bad debt was up by 2 points to 36. Financing costs subindex decreased by 1 point to 3 as there are still concerns about relatively higher interest rates.
In conclusion, there are growing concerns about the economic conditions of the agriculture sector. “Addressing the electricity crisis, and sector-focused issues such as biosecurity, opening up more export markets and dealing with inefficiencies in municipality service delivery are some of the key issues that will help improve sentiment and the fortunes of our agriculture and agribusiness sectors,” says Wandile Sihlobo. The likelihood of an El Niño approaching won’t be favourable for an already stressed agricultural sector.
Source: www.agbiz.co.za, Issued by Wandile Sihlobo, chief economist: Agbiz, 13 March 2023
Weather and climate
NATIONAL ASSESSMENT
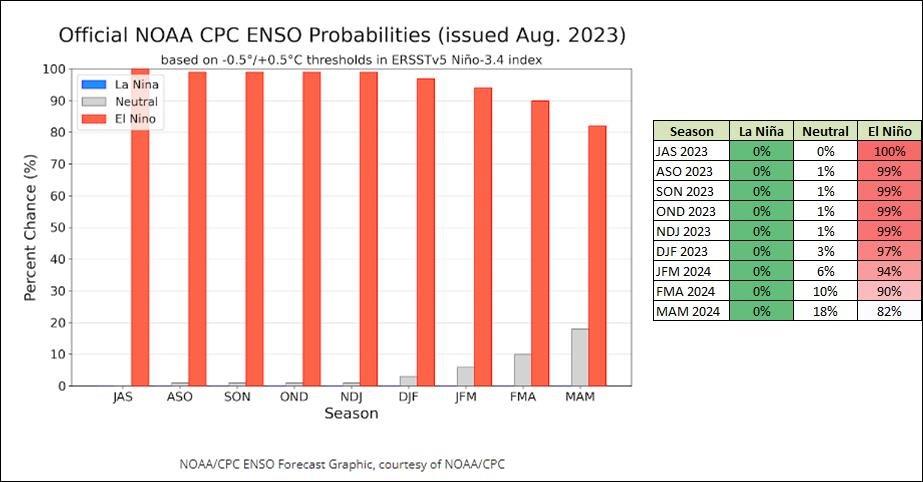
La Niña has ended in the tropical Pacific Ocean. The El Niño-Southern Oscillation (ENSO) is now in an El Niño phase at 100%. The chance of an El Niño still being present in March 2024 is 82%.
A strong El Niño is predicted for the coming rainfall season as the likelihood percentages vary from 100% to 90% until February 2024. The impact of El Niño on the coming 2023/2024 season is predicted to not have such a severe impact as the previous three years experienced above-average rainfall, allowing for enough soil moisture to still produce average to above-average yields. The impact on the 2024/2025 season will be analysed based on the 2023/2024 rainfall received.
The Burea’s ENSO Outlook is at El Niño Advisory which means that El Niño is anticipated to continue through the Northern Hemisphere winter (with greater than 95% chance through December 2023 to February 2024). The current SSTs for September to January range from +1,9°C to +2,3°C. Indicators show that an El Niño will be present in September. Persistent values warmer than +0,8°C are typical of an El Niño.
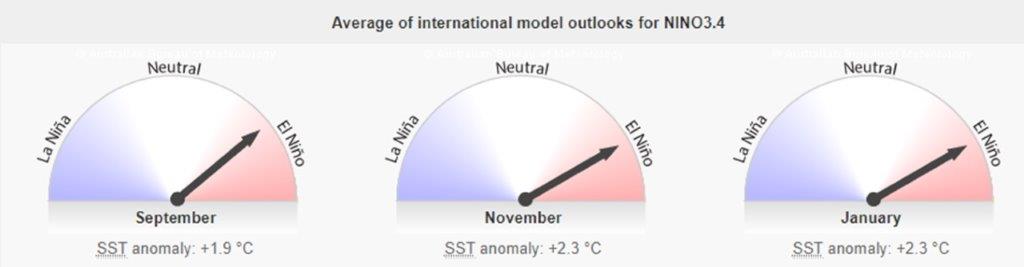
According to the graph below, ENSO is in an El Niño phase, and ocean temperatures near the equator are slowly starting to get warmer. The upward trajectory of the graph shows that there will be less rain than usual as temperatures rise.
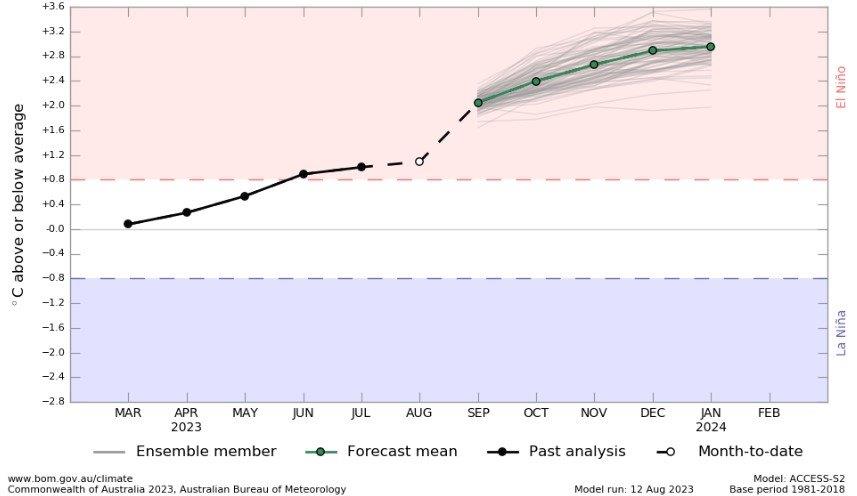
Source: Australian Government – Bureau of Meteorology
SUNSPOTS
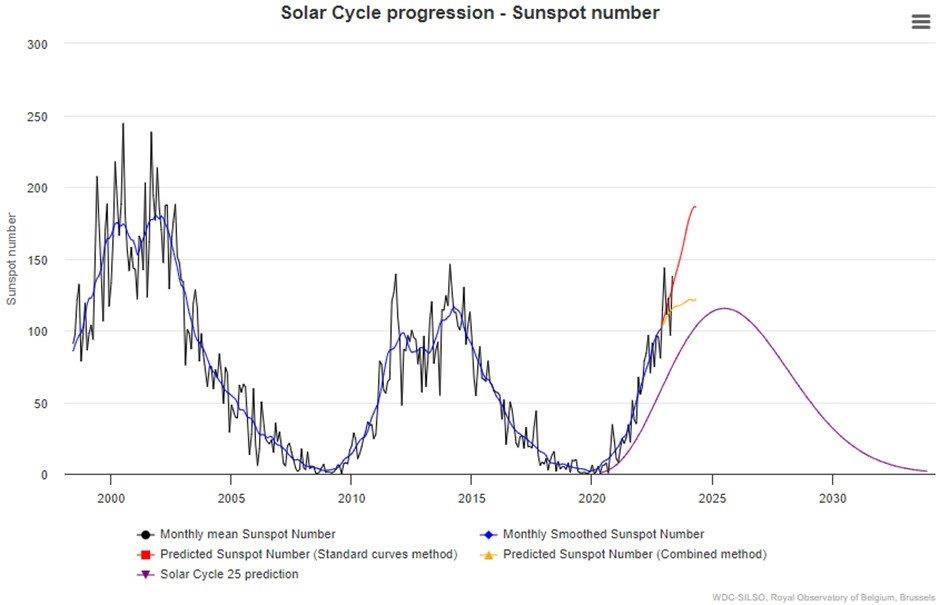
Sunspots are darker, cooler areas on the surface of the sun that arise due to disturbances in the sun’s magnetic field. Every eleven years, the number of spots dotting the surface of the sun increases and decreases and forms the solar cycle.
Sources
https://eos.org/articles/why-did-sunspots-disappear-for-70-years-nearby-star-holds-clues 10 June, 2022
https://www.sciencedirect.com/science/article/abs/pii/S136468262200116X#:~:text=It%20was%20observed%20that%20rainfall,an%20increasing%20effect%20on%20rainfall
https://www.space.com/solar-cycle-frequency-prediction-facts May 27,2022
According to science direct the rainfall rate is directly related to the sunspot number but shows different characteristics during solar maximum years. Though a lag correlation exists between sunspot number and rainfall, sunspots have an increasing effect on rainfall. Studies show that the more sunspots are present the higher the rainfall and the less sunspots the lower the rainfall.
ENSO occurs at irregular interval between three and seven years causing global climate system variation. Considering this event occurs periodically, it might be triggered by the eleven years of solar cycle as an energy source.
The graph below shows the eleven year solar cycles since before the 2000s. As the graph is in an upward trajectile higher rainfall can be expected – La Niña. As the graph reaches its turning point and moves in a downward trajectile less rainfall is expected characteristic of an El Niño.
The last three years were La Niña years and as the graph is approaching its forecasted turning point in 2025 an El Niño can be expected for the coming years. ENSO indicators are still currently in a La Niña phase but weakening.
One could make the assumption that ENSO-neutral conditions start to develop as the number of sunspots are close to reaching their maximum for the solar cycle and then turn towards El Niño as the sunspots get less and the graph is in a downward trajectile.
Market risk
GRAIN MARKET ANALYSIS
• Ending stock – national
Ending stock data is gathered from the NAMC. The estimates are reassessed and reported by the Grain and Oilseeds Supply and Demand Estimates Committee. The following is the projected ending stock for April 2024 in tonnages for the 2023/2024 season:
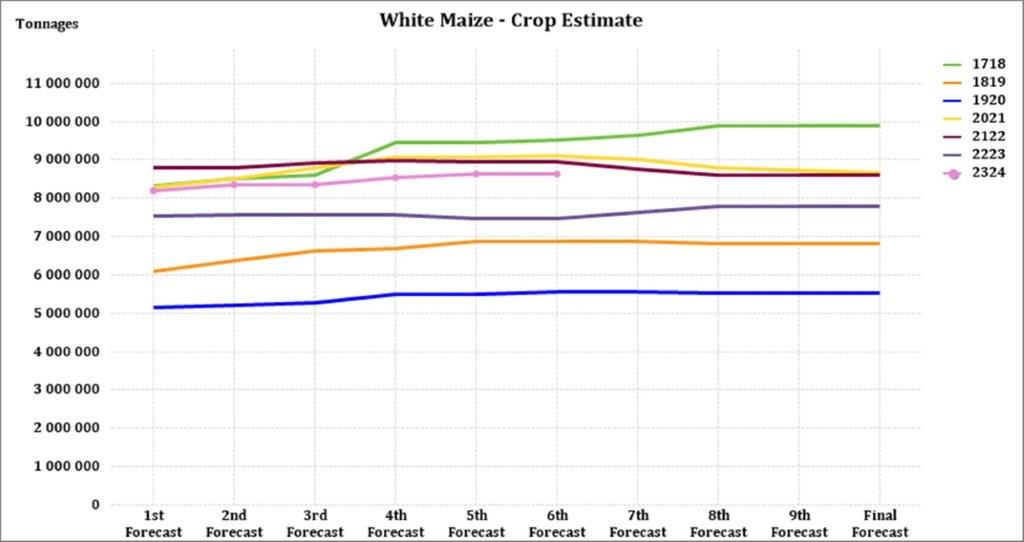
- White maize => 1 640 185 t
- Yellow maize => 1 209 147 t
The following is a summary of September 2023 ending stock estimates for the 2022/2023 season:
- Wheat => 513 883 t
The following is a summary of the February 2024 projected final ending stock for the 2023/2024 season:
- Sunflower => 53 727 t
- Soybeans => 491 747 t
- Sorghum => 10 441 t
The graph below shows the ending stock for white maize in April 2024, which is 460 545 tons more than the projected final for the 2022/2023 season. Yellow maize had a 399 856 t increase in ending stock compared to the previous season.
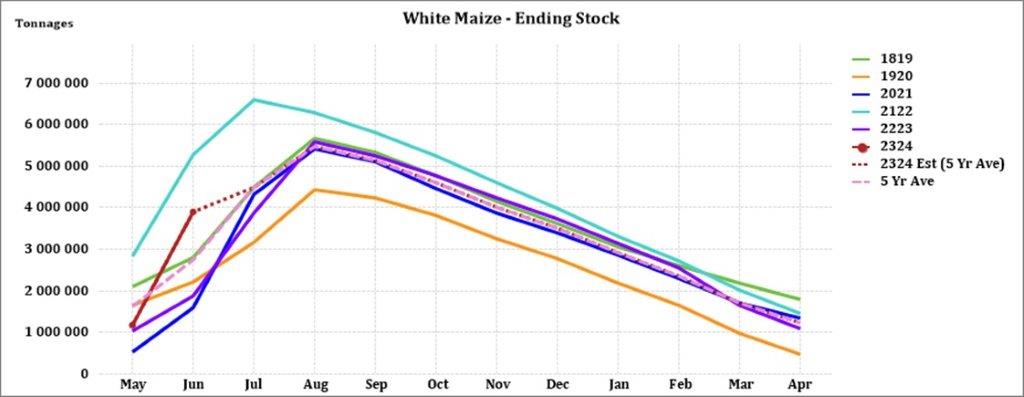
Source: Sagis
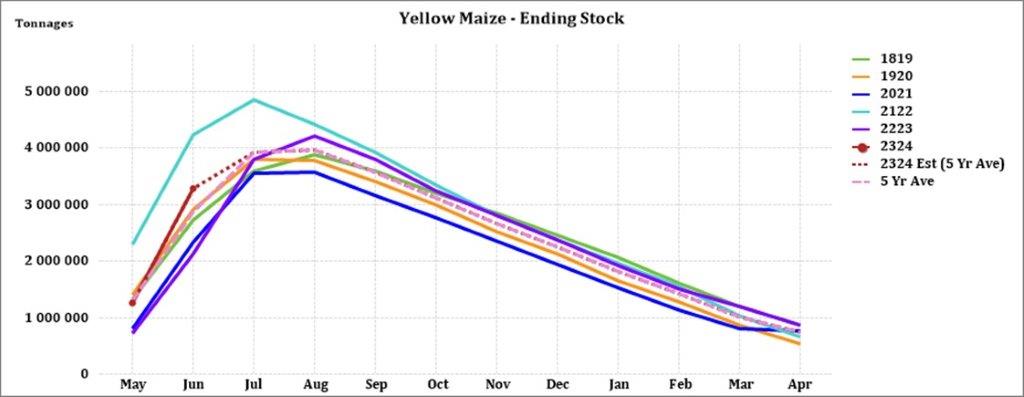
Source: Sagis
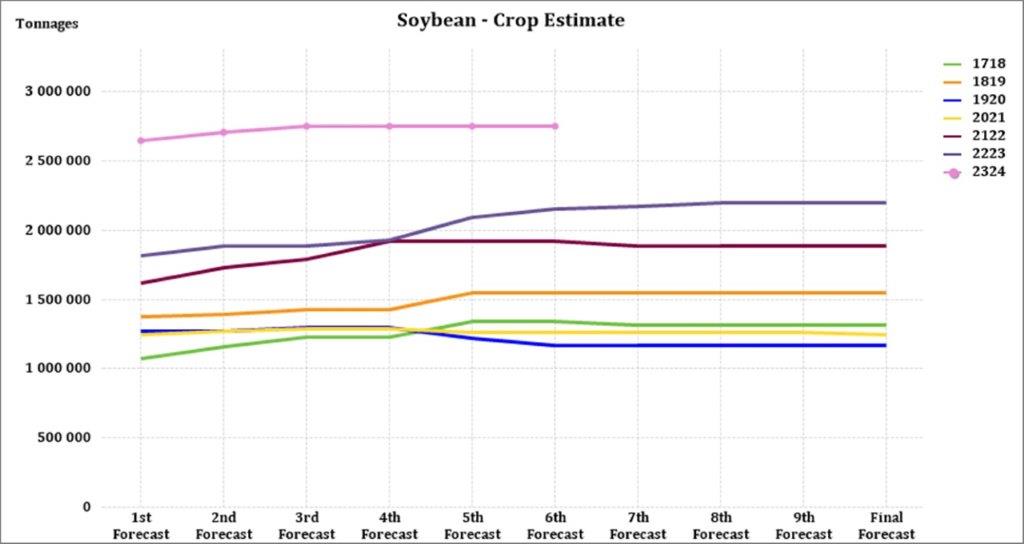
The final forecasted soybean ending stock for February 2024 is 319 850 tons more than February 2023.
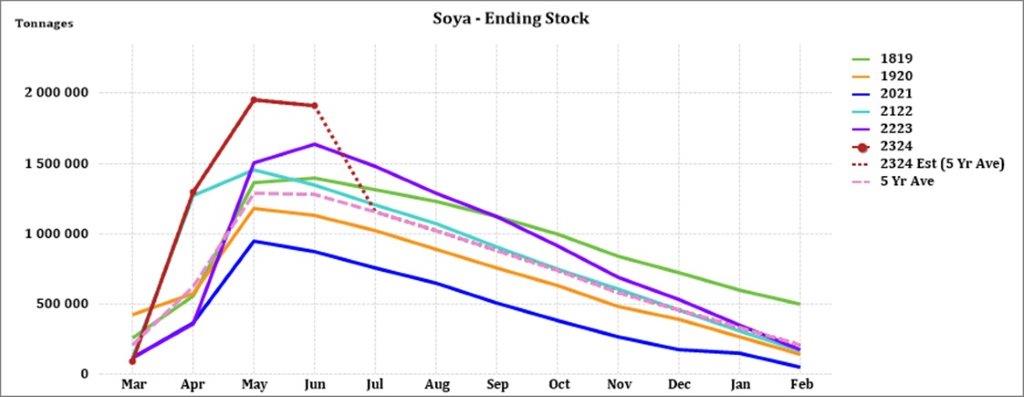
Source: Sagis
The final forecasted sunflower ending stock is 18 340 tons more than the previous season ending stock.
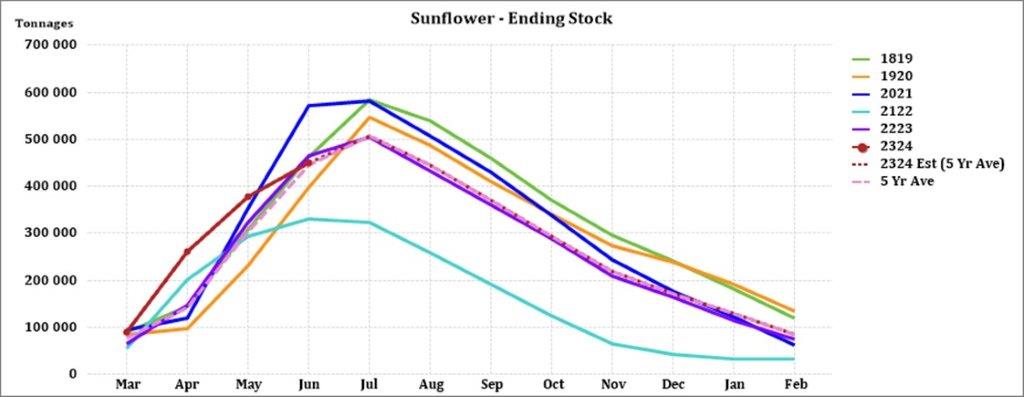
Source: Sagis
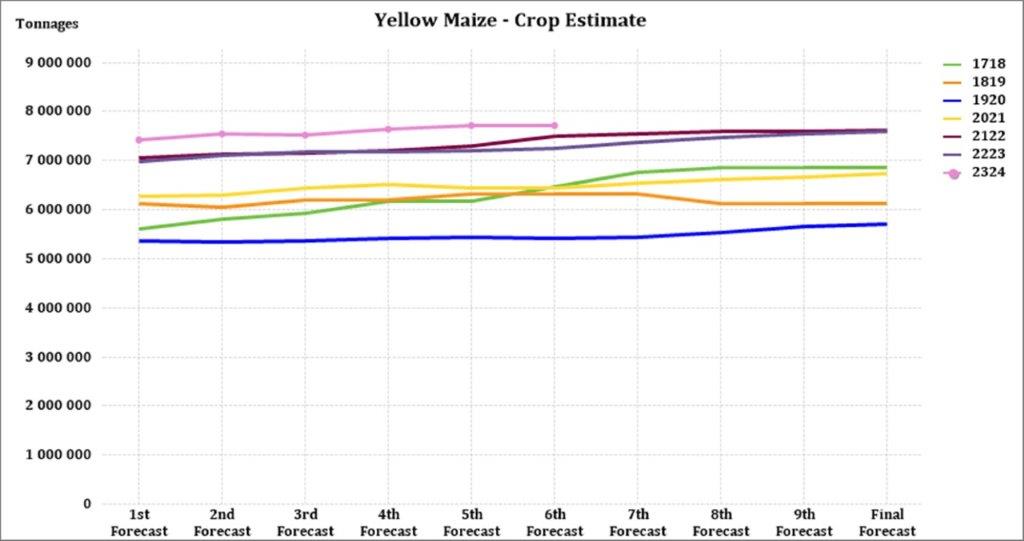
• Crop estimations
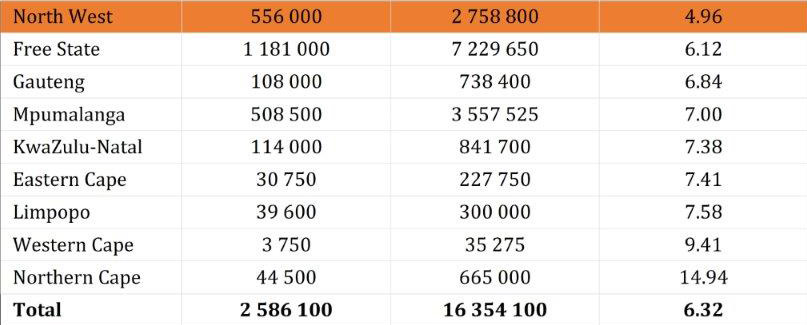
According to the Crop Estimate Committee (CEC) production forecast for 2023, the area estimate for maize is 2,586 million ha, which is 1,4% less than the actual 2,623 million ha planted for the previous season.
Although less hectares are planted to maize the harvest is estimated at 16,4 million tonnes, 6% higher than the previous season’s harvest and the second-largest harvest on record.
Source: CEC (Crop Estimates Committee)
Source: CEC (Crop Estimates Committee)
Source: CEC (Crop Estimates Committee)
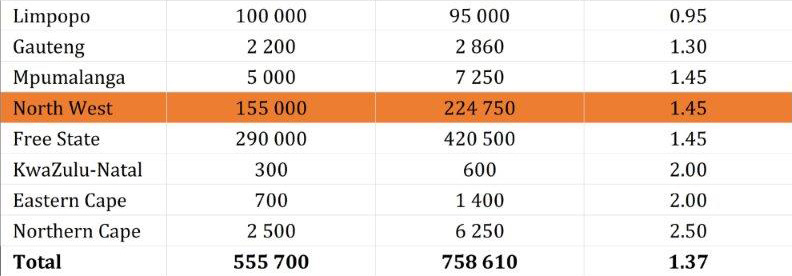
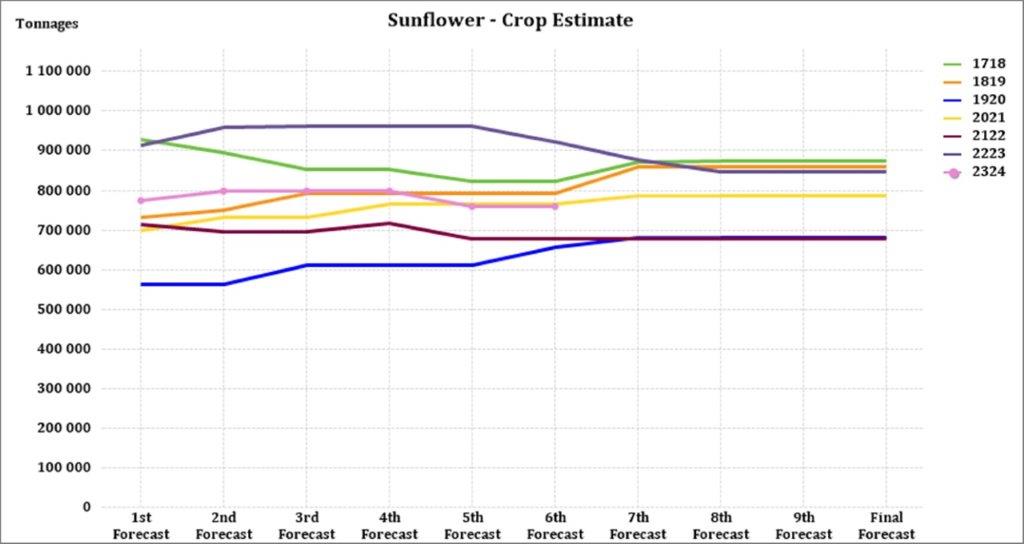
The third area estimate for sunflower seed is 555 700 ha, which is 17% less than the 670 700 ha planted the previous season.
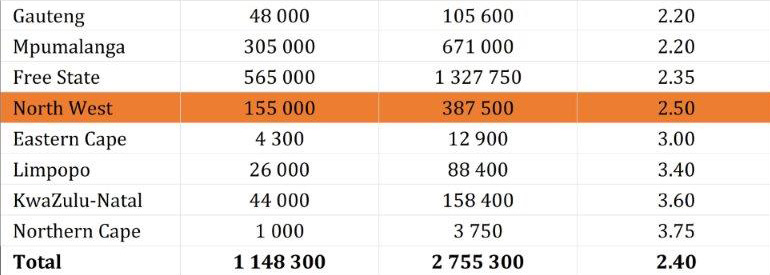
It is estimated that 1 148 300 ha have been planted to soybeans, which represents an increase of 24,10% compared to the actual 925 300 ha planted last season. This is the largest soybean area planted in the history of South Africa. Soybean harvest could reach a record 2.8million tonnes according to Wandile Sihlobo, Chief Economist at Agbiz.
Source: CEC (Crop Estimates Committee)
Source: CEC (Crop Estimates Committee)
Source: CEC (Crop Estimates Committee)
Source: CEC (Crop Estimates Committee)
• Imports and exports – national
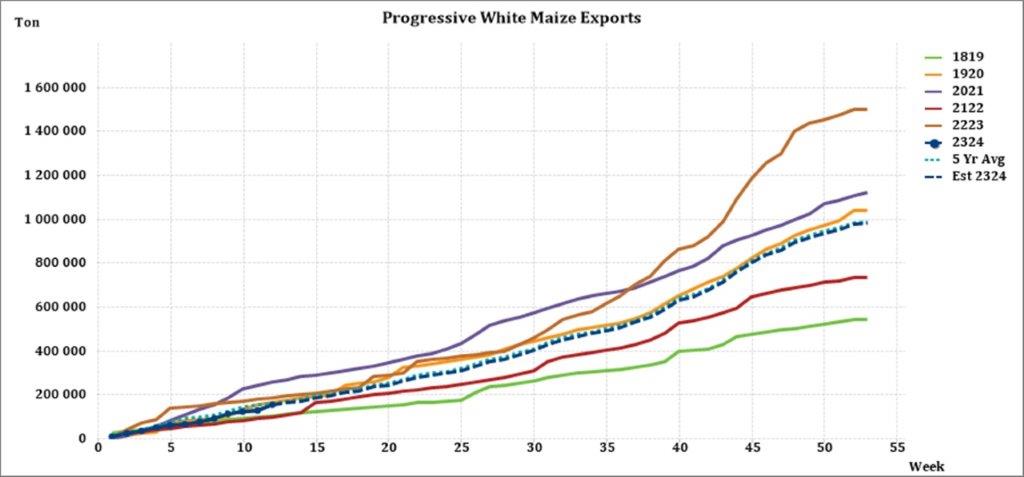
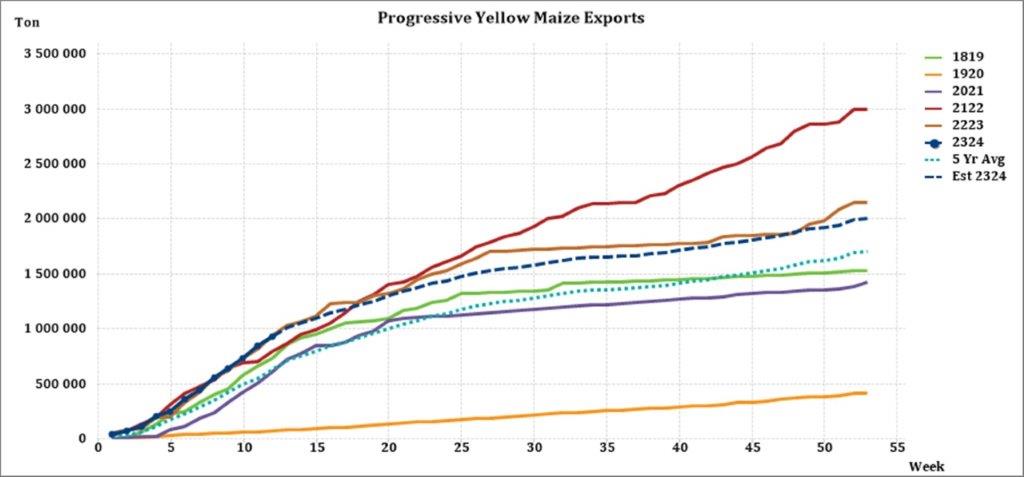
For the production season ending April 2024, 153 732 tons of white maize and 929501 tons of yellow maize have been exported to date (week 12 of 52) as seen in the graphs below. In the 2021/2022 season, a record number of 2 991 129 tons yellow maize was exported. This was mainly due to South Africa’s competitive export parity prices compared to the rest of the world.
Source: Sagis
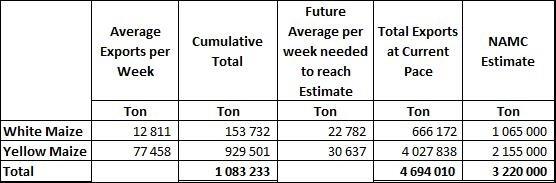
As seen in the table above, the average white maize exports per week are currently 12 811 tons. If theoretically, white maize exports remain at the current average per week then there would be 398 828 tons less white maize exports than anticipated.
The average yellow maize exports per week are currently 77 458 tons. If theoretically, yellow maize exports remain at the current average per week then there would be 1 872 838 tons more yellow maize exports than anticipated.
Source: Sagis
Maize exports
China’s decision to import less maize from America is to the benefit of South Africa.
China, the world’s largest importer of maize, is importing less and less maize from America because there are cheaper options elsewhere and probably for political reasons as well. In January, imports were up to 70% lower than in corresponding times in the past.
Harry Murphy Cruise, an economist at Moody’s Analytics who focuses on China, told the BBC news service that in addition to the cheaper options, increasing political tensions between China and America are causing China to try to diversify its import market in case the relationship deteriorates further. ‘Trade is a core element in policymakers’ arsenal.’
The BBC points out that China has also been importing maize from South Africa for the first time since May and American farmers are worried about this trend. However, the country that will benefit the most from the new trend is Brazil. In recent years, many grazing areas have been converted into fields where maize can be planted and Brazil is playing an increasingly large role in the export market. Farmers in Brazil have the added benefit of being able to grow maize twice a year.
China has increased its imports from Brazil and several agreements have been signed between the two countries to promote exports.
Rising fertilizer and fuel costs also caused the USA to have planted about 1.4 million ha less maize compared to 2021. In addition, a drought in the western parts further drove up the price of American maize on the international market making it less competitive. America normally exports maize to about 60 countries.
Trade surplus increased
Meanwhile, Wandile Sihlobo, chief economist of the agricultural chamber of Commerce AGBIZ points out that South Africa’s trade surplus for agricultural products rose by 9% in the first quarter compared to the corresponding time last year. The surplus of R22,6 billion is mainly attributable to a decrease in the value of agricultural imports and not growth in exports.
Compared to exports in the first quarter last year, there was a decrease of 2% this year. This can be mainly attributed to a lot of rain, load shedding, and logistical problems. However, the export was 5% higher when compared to the last quarter of last year.
In terms of trade destinations, the African continent remains the largest market. In the first quarter, 39% of the value was exported there, followed by the European Union with 23%, Asia and the Middle East with 21% combined, and the Americas with 8%.
Sihlobo says that from a policy point of view, the emphasis must be from now on to improve logistics efficiency with roads, rail transport, and ports and to look for new export markets. “South African agriculture is export-oriented. Roughly, in terms of value, half of everything that is produced is exported.”
Preferred countries for expanding agricultural exports are China, South Korea, Japan, America, Vietnam, Taiwan, India, Saudi Arabia, Mexico, the Philippines, and Bangladesh.
Source: landbou.com, Nico van Burick, 11 July 2023
• Parity prices
South Africa is a small producer compared to other countries and is thus a price taker (meaning that we cannot influence world prices). Because of this, our local prices are normally between import and export parity, which is illustrated in the graph below. An import parity price is defined as the price which a buyer will pay to buy the product on the world market. This price will include all the costs incurred to get the product delivered to the buyer’s destination.
An export parity price is defined as the price that a local seller could receive by selling his product on the world market e.g., excluding the export costs. The price which the seller obtains is based on the condition that he delivers the product at the nearest export point (usually a harbour) at his own expense.
The graph below reflects the Safex price, import parity and export parity of yellow maize as well as the Safex price of white maize. The import and export parity prices for white maize are not released by Grain SA for this period.
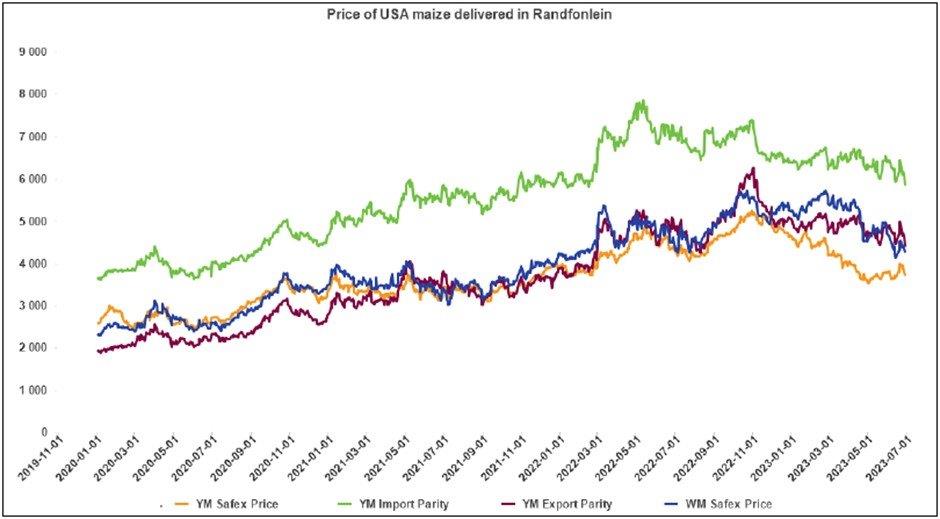
Source: Grain SA
• Producer deliveries – provincial
For the marketing year which is May to April (2022/2023) the Free State dominates the white maize which is used for human consumption and gristing. North West showed a decrease in white maize human consumption for the year ending April 2023 compared to the previous year.
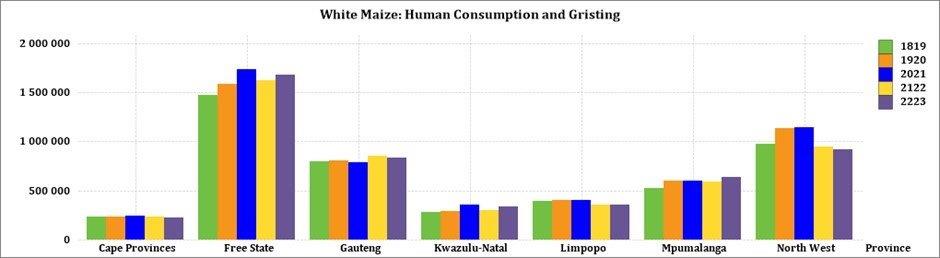
Source: Sagis
The Cape provinces used the most white maize for animal feed and industrial usage.
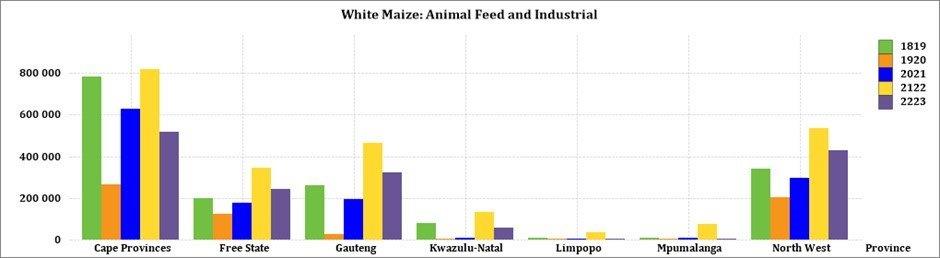
Source: Sagis
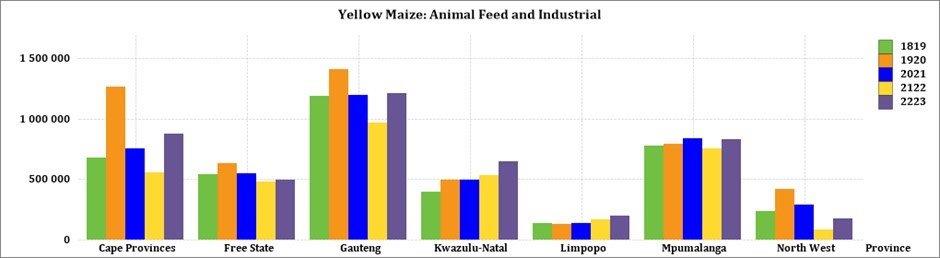
The Free State processed the most yellow maize for consumption and gristing during the thyear ending April 2023. For the same period Gauteng processed the most yellow maize for animal feed and industrial purposes.
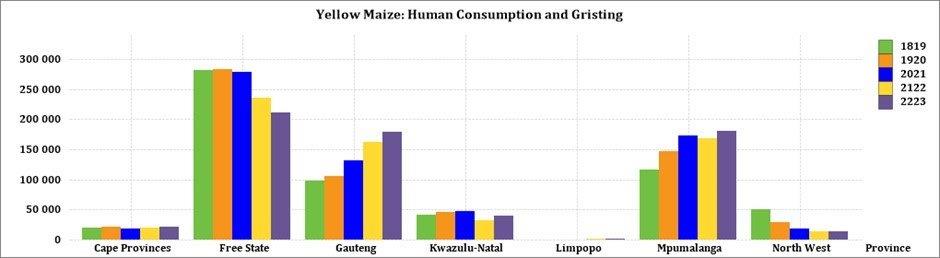
Source: Sagis
Source: Sagis
• Exchange rate
NWK Group is exposed to foreign exchange rate risk on various business areas, such as commodity prices and trade imports.
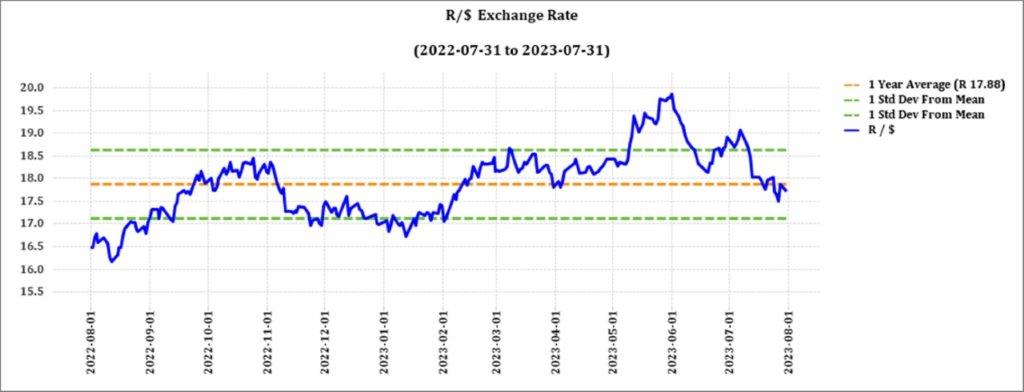
Source: Standard Bank, Corporate and Investment Banking & SARB
On a monthly average basis, the rand appreciated against the US dollar by 3,04% (0,57c) over the period May to June. The one-year average for rand/US dollar as on July 2023 is R18,22. Moreover, the average rand/US dollar exchange rate for June was R18,20 compared to R18,77 in June.
Exchange rate forecast:
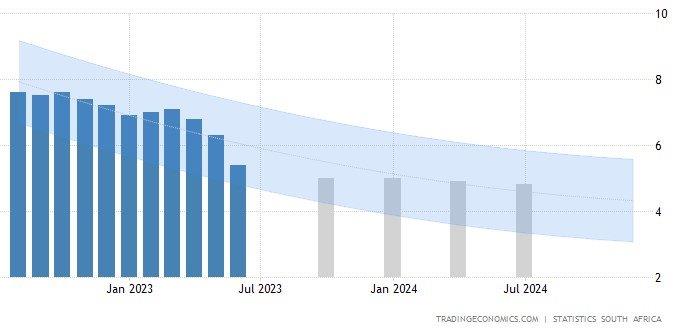
The graph below shows the actual USD/ZAR for 2022 Quarter 3 (Q3) to 2023 Quarter 4 (Q4) against the forecasted figures.
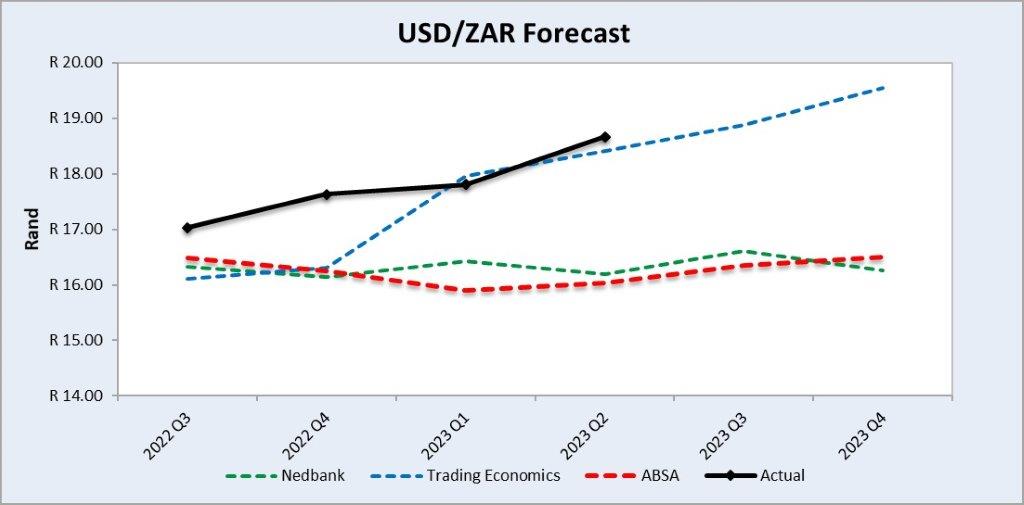
Source: Nedbank CIB; Absa; The Economic Forecast Agency; Trading Economics
• Interest rate risk
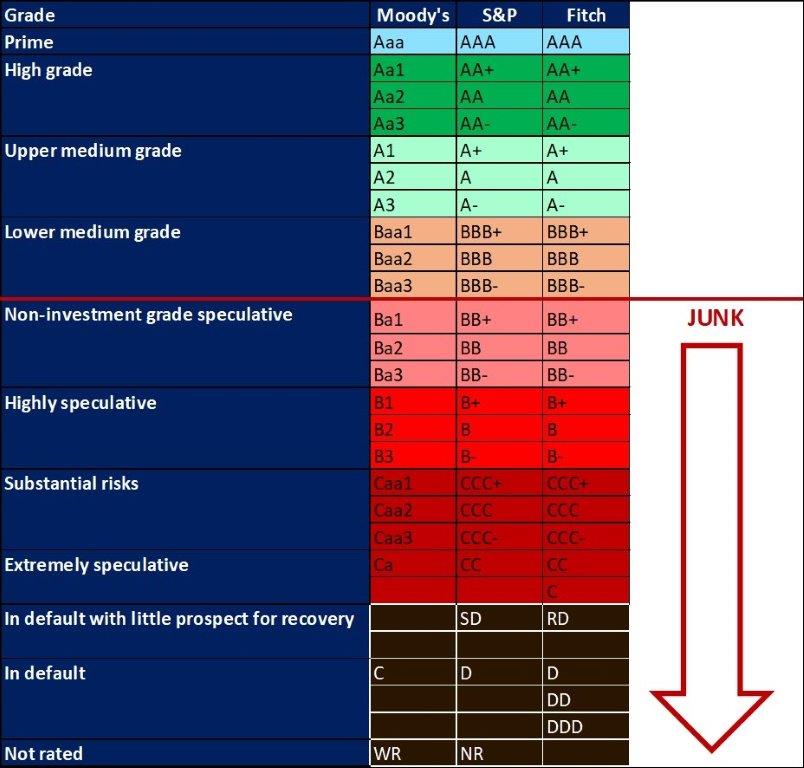
On 27 March 2020, Moody’s downgraded South Africa’s sovereign credit rating to sub-investment grade and placed a negative outlook on the rating. The key drivers for this downgrade include weak economic growth, continuous deterioration in fiscal strength, and slow progress on structural economic reforms. It is now the first time in post-apartheid South Africa where all major rating agencies, i.e.. Moody’s, Fitch and S&P, have South Africa’s credit ratings in sub-investment grade territory. More than a year later and Moody’s rating remains the same.
During the previous Monetary Policy Committee (MPC) meeting held on 20 July the committee decided that interest rates will remain unchanged. The repo rate is currently 8,25% and the prime rate is 11,75%. The South African Reserve Bank made several interest rate cuts to bring relief to the economy after Covid-19, but since November 2021 borrowing costs rose again by a cumulative 475 bps. The next MPC meeting date is 21 September 2023.
Interest rate movement:
- 27 January 2022: 7,50%
- 24 March 2022: 7,75%
- 19 May 2022: 8,25%
- 21 July 2022: 9,00%
- 22 September 2022: 9,75%
- 24 November 2022: 10,50%
- 26 January 2023: 10,75%
- 30 March 2023: 11,25%
- 25 May 2023: 11,75%
- 20 July 2023: 11,75%
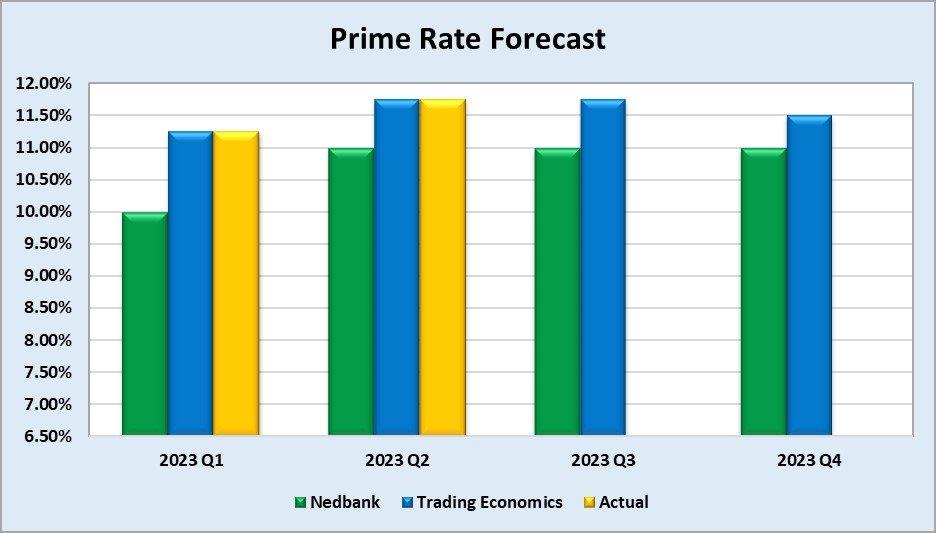
The following graph shows the prime rate forecast for 2023 Quarter 1 to 2023 Quarter 4. Both Q1 and Q2 experienced higher interest rates than anticipated by Nedbank.
Inflation rate
As the inflation rate is a driver for increases and decreases in interest rates the current rate and forecast have to be assessed to foresee further increases in the interest rate.
Current
South Africa’s annual inflation rate eased further to a 19-month low of 5,4% in June 2023, down from 6,3% in May and below market forecasts of 5,6%, moving back to the central bank’s target range of 3% to 6%. Food inflation eased to an eleven month low of 11% (vs 11,8% in May) and prices also softened for household contents & services (4,6% vs 5,6%), clothing (3,2% vs 3,5%), transport (1,8% vs 7%) and restaurants & hotels (5,6% vs 6,4%). By contrast, inflation accelerated for housing & utilities (4,2% vs 4%), recreation & culture (4,1% vs 3,8%) and alcoholic beverages & tobacco (6,1% vs 5,9%). The annual core inflation, which excludes prices of food, non-alcoholic beverages, fuel and energy, slowed to 5% in June, after a 5,2% rise in May, and broadly in line with market estimates of 5,1%. On a monthly basis, consumer price inflation remained unchanged at 0,2%.
Source: Statistics South Africa
Forecast
The inflation rate in South Africa is expected to be 5% by the end of this quarter, according to Trading Economics global macro models and analysts’ expectations. In the long term, the South African inflation rate is projected to trend around 4,6% in 2024 and 4,5% in 2025, according to Trading-Economics econometric models.
Russian Federation’s Suspension of Participation in Black Sea Grain Initiative
Food and fertiliser prices might spike as Russia refused to renew the agreement that allowed Ukraine to export grain through the Black Sea without being attacked by Russa on Monday, 17 July. The risk of food prices rising and grain exports from Ukraine through the Black Sea being halted may place over 100 million people into poverty.
According to the World Food Programme, pre-war Ukraine produced enough food to feed 400 million per year. The UN says the deal allowed the WFP to transport more than 725 000 tonnes of wheat to help people in need in countries hit by wars and extreme weather events.
Since the deal collapsed the first Ukraine cargo ship left the port in Odesa and travelled down the temporary corridor set up after Moscow pulled out of the UN-backed Black Sea grain deal. Ukraine is also close to finalizing a deal with global insurers to cover Black Sea grain ships in the midst of Russia threatening to open fire on vessels making their way to and from Ukraine.
Sources:
https://www.aljazeera.com/news/2023/7/17/as-russia-exits-grain-deal-which-countries-will-be-affected
https://www.politico.eu/article/russia-ukraine-war-black-sea-grain-ships-insurers/
https://www.theguardian.com/world/2023/aug/17/cargo-ship-leaves-ukraine-port-of-odesa-black-sea
• Highlights in the agrochemical sector
Between 30% and 50% of a grain and oilseed farmer’s existing input costs are spent on fertiliser. International fertiliser prices continue to decrease, as weaker rand offsets some of the reduction in local costings.
However, fertiliser prices may once again spike as Russia refused to renew the agreement that allowed Ukraine to export grain through the Black Sea past Russian military ships on Monday, 17 July.
China is currently the largest glyphosate supplier in the world. The dynamics of China’s glyphosate greatly impacts the global supply structure, over 80% of glyphosate produced in China is exported, to more than 20 destinations in the world. In China, on a month-to-month basis, prices (dollar terms) of most herbicides, insecticides and fungicides were mostly on a downward trend from June 2023 to July 2023. The depreciation of the rand over a period of a year definitely plays a role and might have higher local prices as effect.
The big news for South Africa was the announcement of a 35 000-ton cargo of Russian granular MOP booked for Durban. The product will arrive in the first half of August and the price is reportedly around $365/t to $370/t CFR Durban. This is about $40/t cheaper than the regular sources of non-sanctioned potash, which is the obvious motivation to do this deal. It is unclear what consequences there may be for buyers and consumers of this product coming from Russia.
With the weak Rand this week, Chinese granular amsul has climbed from R3 800/t to R4 500/t on an import parity basis ex-Durban. South African amsul imports year-to-date are less than half of last year – with prices now spiking, the opportunity for cost-effective amsul buying has been missed for this year.
The Brazilian MAP market clearly has some price optimism, as the Swaps quotes above indicate. The Brazilian MAP physical price has not yet broken through the $500/t level but the forward market is pricing in some further increases. Does this suggest that South African MAP buyers should anticipate further rises in the local price? Our view is yes – and the Rand weakness may magnify MAP price increases in the coming weeks.
Sources:
https://www.dtnpf.com/agriculture/web/ag/crops/article/2023/07/17/wholesale-fertilizer-prices-fall
https://sagrainmag.co.za/2023/04/13/kunsmispryse-se-neus-wys-effens-afwaarts/
https://www.agricultureportal.co.za/index.php/agri-index/68-crops/9643-sharp-rebound-in-rand-helps-lower-local-fertilizer-costs
https://www.agricultureportal.co.za/index.php/agri-index/68-crops/9730-weakening-rand-magnifies-rising-local-fertilizer-prices
Herbicides
The following products are the main products regarding herbicides that may have an impact on input costs for producers:
- Glyphosate (95%)
- Acetochlor (92%)
- Atrazine (97%)
- Metolachlor (97%)
- Trifluralin (95%)
The following comparison is from the August 2023 Grain SA report which reports the previous month’s prices.
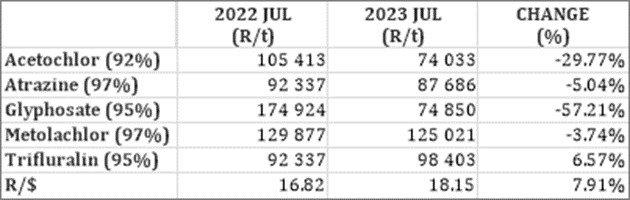
In comparison with the previous year’s prices, four of the five main products experienced a decrease in prices. Glyphosate had the biggest decrease with 57,21%.
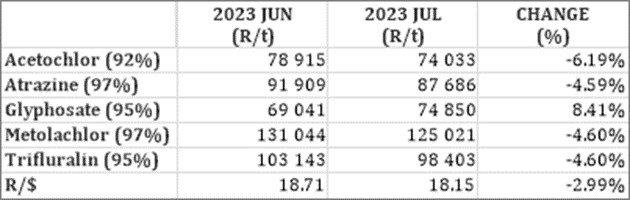
For the two months compared four of the five products experienced a price decrease.
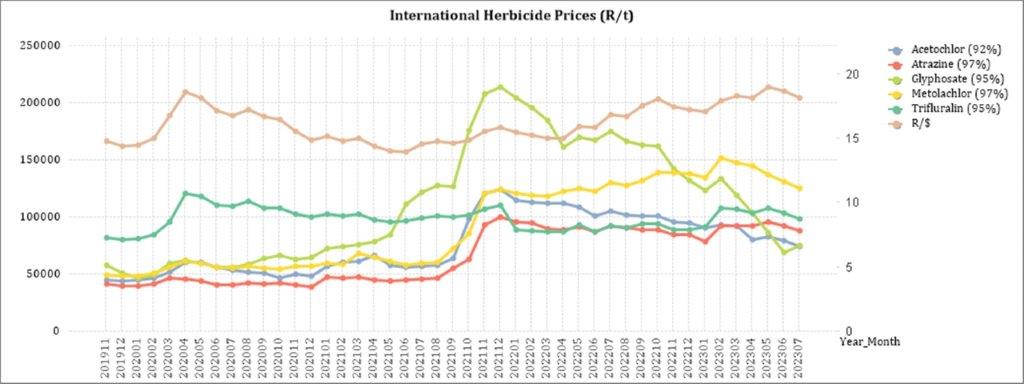
The graph below shows the international herbicides prices (R/t) per product from November 2019 to July 2023.
Insecticides
The following products are the main products regarding insecticides that may have an impact on input costs for producers.
Imidacloprid (95%)
Lambda-cyhalothrin (95%)
Carbofuran (99%)
Deltamethrin (98%)
Acetamiprid (95%)
Chlorpyrifos (95%)
Cypermethrin (94%)
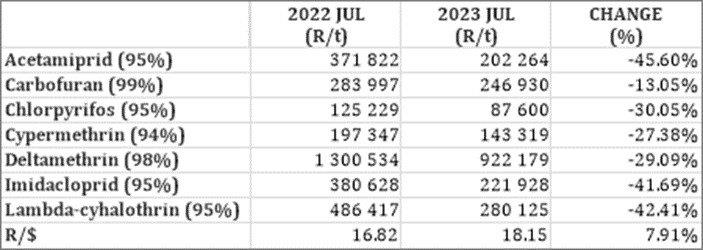
In comparison with the previous year’s prices, four of the products experienced a price decrease. The largest decrease was Acetamiprid with a decrease of 45,6% and Lambda-cyhalothrin with 42,41%.
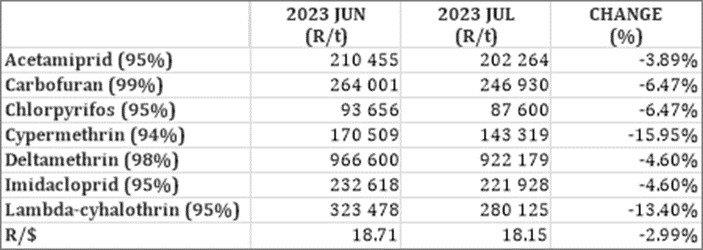
Once again all of the products experienced a price decrease in July on a month-to-month basis.
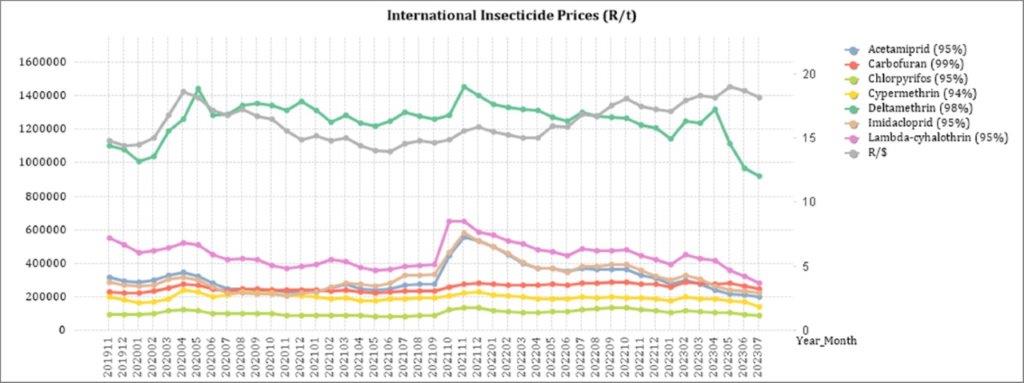
The graph below shows the international insecticide prices (R/t) per product from November 2019 to July 2023.
Fertiliser
The following fertiliser products are being analysed:
- Ammonia (Middle East)
- Urea (46%) (Eastern Europe)
- DAP (USA Gulf)
- KCL (CIS)
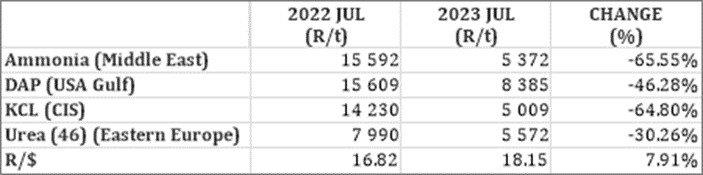
As seen in the table above all of the main fertiliser products decreased on a year-on-year basis. The biggest decrease, based on average international prices (R/t), was Ammonia (65,55%) followed by KCL (CIS) (64,80%).
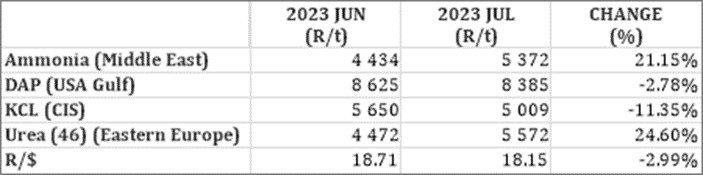
For the two months compared two of the products experienced a decrease in price per ton. KCL experienced the biggest price decrease with 11,35%.
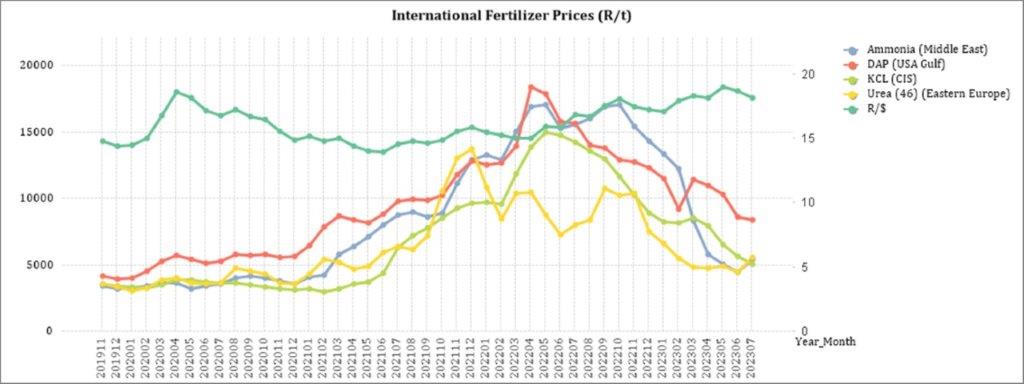
The graph below shows the International Fertiliser prices (R/t) per product from November 2019 to July 2023.
Sources: Grain SA – https://www.ft.com/content/4d746aa5-29e3-4796-b9e6-0b64c6865389
Urea: The latest Indian urea tender closed earlier this week and delivered a few surprises. Firstly, the price was a good $20/t lower than predicted, settling just below $400/t CFR India. This netted back to around $380/t FOB Middle East and $375/t FOB China. A smaller surprise, given the market gossip about how tight producers are on inventory, was that 3,4 million tons of urea were offered. The Indians indicated that they were looking for approximately 1 million tons, so the tender was more than three times over-subscribed. Hardly a message of product availability being limited on the tender.
Ammonia: Prices were flat this week –the market appears tight with a number of producers suffering outages but the urea price drop may have caused ammonia buyers to hold back in hope of ammonia prices being affected. The EU gas price jump this week would also point to European ammonia production being cut back in favour of cheaper imports but as yet, no new import purchases have been seen.
Phosphates: It was active buying from India that kept DAP pricing heading upwards this week. There was no confusing the price direction as the Indian price leapt by $70/t to rise above $500/t CFR. The Chinese DAP price rose by close to $75/t as concerns about Chinese supply are clearly rising.
Potash: The US led potash markets this week as their summer fill programme (stocking up for next spring before winter impacts Canadian exports and US distribution in the Corn Belt) picked up speed. The Canadian port strike now seems to be over thus supplies are expected to resume.
Source: https://www.grainsa.co.za/upload/report_files/Chemical-and-Fertilizer-Report_August-2023.pdf
Global risks – World Economic Forum
The Global Risk Report released by the WEF displays the top global risks over the short and long-term. The top 5 short term global risks ranked by severity over two years are:
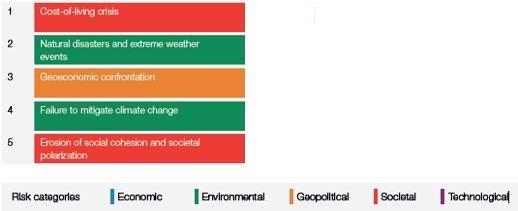
The cost of living is already at worrying levels with the FAO Price Index reaching the highest level in March 2022 since its inception in 1990. What is interesting to see is that the current number one global risk, cost-of-living crisis, will only be the 15th highest risk in the long-term.
Global inflation is rising and uncertainty looms over when the Russian/Ukraine war will end and when food exports, inflation and interest rates will start to stabilise or ease. Rising energy prices and a shortage of energy supply pose a further threat to the cost of living. According to the WEF there is a material possibility of a global food supply crisis occurring in 2023. This can lead to a humanitarian crisis with a up flair in protests and political unrests.
The top 5 long term global risks (ten years) ranked by severity are:
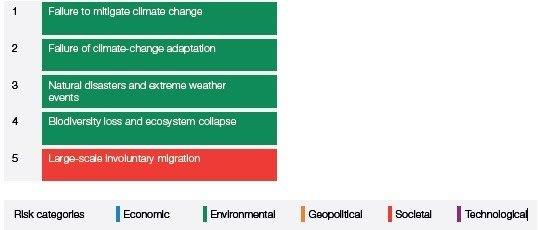
The number one long term risk namely failure to mitigate climate change refers to the failure of governments, businesses and individuals to enforce, enact or invest in effective climate-change mitigation measures, such as the decarbonization of economic activity. It is seen as the global risk that we are the least prepared for.
Pressure on energy-importing countries to invest in cleaner renewable energy sources have already limited progress on climate change mitigation due to geopolitical tensions and economic pressures. A good example of progress almost being reversed is the EU spending €50 billion on new and expanded fossil-fuel infrastructure and some countries restarting coal power stations instead of investing in cleaner sources. Progress to mitigate climate change is slow and short-term goals are often pursued without consideration of the long-term effects.
Source: WEF_Global Risks Report 2023 pdf
The impact of South Africa being grey-listed
The Financial Action Task Force (FATF) grey list refers to the FATF’s practice of publicly identifying countries with strategic Anti- Money Laundering and Countering the Financing of Terrorism (AML/CFT) deficiencies.
In summary, the grey listing of a country means that its government has adopted an action plan to address to deficiencies identified during its mutual evaluation after an observation period, and to implement such action plan within a defined time period, and with FATF monitoring such implementation.
There are a number of impacts on a country’s economy that has been grey listed. A few of them are:
- Reputation damage: According to Treasury the most significant implication to a country that is grey-listed is the reputational damage to the country, as its effectiveness in combatting financial crimes like corruption and money-laundering as well as terror financing are deemed to be below international standards.
- Challenges for SA business wishing to access international financial services: One of the biggest risks is related to the withdrawal of banking and payments services necessary for trade, remittance, and other transfers and economic growth. Cross-border transactions will endure more red tape.
It should be noted that FATF does not require enhanced due diligence measures to be applied, but rather that all jurisdictions take account of it in their risk analysis.
- Enhanced reporting requirements when transacting: This will make South Africa less competitive in a global market as it will take a lot more time to do business due to extra paperwork and due diligence.
- Higher direct costs: If greater due diligence has to be performed it will come at a cost or investors might demand a higher rate of return when investing in South African institutions.
- Reduction in foreign direct investment: Being seen as a high-risk investment destination, some investors may not be allowed to invest in the country anymore and withdraw investments in the country.
However, with this being said, South Africa is a large exporter of raw materials and the world depends on us to continue providing those raw materials. South Africa also has a highly regarded financial sector and many offshore platforms will continue to operate as usual.
Before South Africa was grey-listed the world knew we were a high-risk jurisdiction to do business with and they treated us as such. Thus, being grey-listed is not such a shock to the world and our economy as one might think. On the bright side, Finance Minister Enoch Godongwana is confident that South Africa will implement the action plan timeous and be removed from the grey-list by mid-2024. Mauritius was removed from the list after 18 months.
Sources
https://businesstech.co.za/news/business-opinion/669803/its-time-to-be-realistic-about-south-africas-greylisting/
https://www.sableinternational.com/blog/south-africa-s-greylisting-what-does-it-mean
https://www.treasury.gov.za/comm_media/press/2023/2023022501%20FATF%20Grey%20Listing%20Fact%20Sheet.pdf
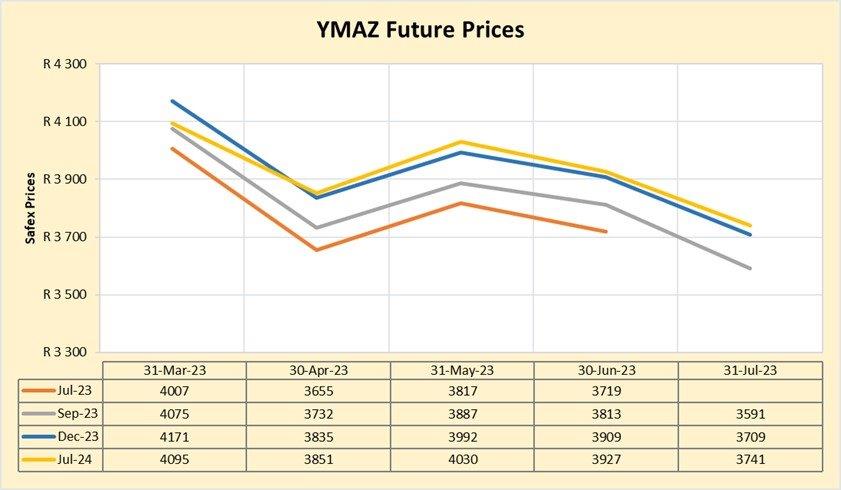
FUTURE PRICES
The graphs below illustrate the market sentiment for maize, in the form of future contracts, for the upcoming contract months. The market sentiment is the expectation of supply and demand fundamentals relating to white and yellow maize in South Africa.
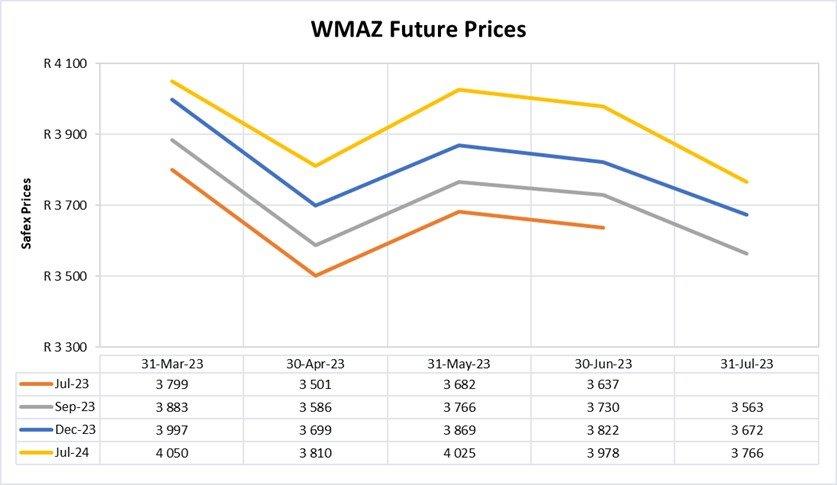
Source: Sagis/JSE
Source: Sagis/JSE
CBOT corn experienced a 1,1% decrease for the week ending July 28th, compared to a 6% decrease year-on-year. This was due to improved weather prospects in the Midwest, slow US corn exports to China, and Russian President Putin’s pledge to donate free grain to African countries. However, ongoing war and attacks in Ukraine may exacerbate supply concerns and drive global prices upward. Locally, Safex maize prices followed the global decreasing price trend, supported by a 0,5% appreciation of the rand. Local prices continue to trade below both US and Argentinian export parities, pressured by lowered global prices.
Source: https://agrink.co.za/downloads/ABSA%20Agri%20Trends%20Grains%20and%20Veggies.pdf
Fraud risk
FRAUD AWARENESS
Here are three fraud prevention tips:
- Carefully read all contracts and purchasing agreements before signing and make certain that all of your requirements have been put in writing. Rather ask for extended time to thoroughly go through the contracts or purchasing agreements instead of rushing through them before signing.
- Always ask for and wait until you receive written material about any offer or charity. Without any written material it is your word against theirs. A lot of the finer details will be in writing and if not that is also something to query and make sure of.
- Carefully review your insurer’s explanation of the benefits statement. Call your insurer and provider if you have questions.
Source: https://www.ncoa.org/article/22-tips-for-seniors-to-avoid-scams


