

The NWK Limited agricultural economic report provides an overview of the main external factors that NWK and its clients are exposed to at a specific point in time. This report opts to aid in a timely basis to foresee external market and other factors that may have an impact on any business and clients. The main focus of this document is to have a closer look at external factors that can affect any business and our customers.
Executive summary
External factors that can affect any business and its customers include various economic factors. This report will focus on monthly or quarterly changes of these economic factors.
The inflation rate rose to 4,5% in September 2026. Retail trade growth rose by 3,3% in August 2026. The unemployment rate rose further to 33,6% in Q2 of 2026. The GDP growth for the second quarter of 2026 shrank with 0,2%, following a 0,4% growth in the previous period. The Policy Uncertainty Index rose to 81,9 in Q2 2026(baseline 50) compared to 77,8 in Q1 2026.
External factors that are of great concern to any agricultural business is the weather and climate outlooks. These factors include long term climate risks, such as drought and heat stress, as well as the current status of the El Niño and La Niña climate phenomenon. The El Niño Southern Oscillation (ENSO) is currently on El Niño advisory. El Niño conditions is at near-record levels.
The September 2026 National Agricultural Marketing Council (NAMC) report estimates the projected closing stock level on 30 April 2027 for white and yellow maize to be more than that of the 2025/2026 marketing season. The projected sunflower ending stock for February 2027 is 79 791 t, that is more than the final for the 2025/2026 season of 49 266 t. The projected soya ending stock for February 2027 is 269 155 t, which is less than the final for the 2025/2026 season of 286 120 t.
During the previous Monetary Policy Committee (MPC) meeting held on 23 September, the committee decided that interest rates will remain the same. The repo rate is currently 7,25% and the prime rate 10,75%.
Business climate – key risk drivers
A few highlights regarding certain risk drivers are mentioned below.
According to Trading Economics, South Africa’s annual inflation rate rose for the second month to 4,5% in September 2026 from 4,4% in August, but below the expected 4,7%. The inflation rate is expected to be 5,2% by the end of this quarter. In the long-term, the South Africa Inflation Rate is projected to trend around 4% in 2027 and 3,2% in 2028.
Brent crude oil monthly average prices increased by $23 per barrel. Iron ore increased slightly by $2,89 per metric ton on a monthly average.
South Africa’s retail trade rose by 3,3% year-on-year in August 2026, following a 3,4% advance in July. The reading exceeded market expectations of 3%, keeping retail sales growth close to its strongest level since early 2026. According to Statistics SA, South Africa’s unemployment rate rose to 33,6% in Q2 2026.
The GDP growth rate shrank by 0,2% in the second quarter of 2026. Three of the ten industries experienced a decrease.
The Safex maize prices have strengthened through September, increasing by 8,4% month-on-month for white maize and 7,3% for yellow maize. A marginally weaker rand provided limited additional support to local prices, while ample domestic maize supplies continue to cap further upside.
The El Niño–Southern Oscillation (ENSO) is on El Niño advisory. The 2026 El Niño event continues to intensify across the central and eastern equatorial Pacific. The latest weekly Niño 3,4 index, climbed to +3,3°C, providing further evidence that El Niño is already very strong and continuing to strengthen. Forecasts are predicting that it will persist into autumn of 2027.
The Policy Uncertainty Index (PUI) eased to 61,3 in Q3 2026 from 81,9 the previous period. It remained above its neutral baseline amid global energy shocks, higher fuel costs and weak investment.
Sources: https://tradingeconomics.com/south-africa/inflation-cpi
https://tradingeconomics.com/commodity/brent-crude-oil
https://tradingeconomics.com/south-africa/unemployment-rate
https://www.statssa.gov.za/?page_id=737&id=1
https://tradingeconomics.com/south-africa/gdp-growth
https://agrink.co.za/downloads/ABSA%20Agri%20Trends%20Grains%20and%20Veggies.pdf
https://tradingeconomics.com/commodity/iron-ore
https://thenational.co.za/news/2026-09-30-south-africa-s-policy-uncertainty-eases-in-third-quarter-but-remains-elevated/
Agribusiness Confidence Index (ACI) Q3, 2026
The Agricultural Business Chamber (Agbiz) conducts a quarterly survey to compile the Agribusiness Confidence Index (ACI), reflecting the views of at least 25 decision-makers in the agricultural sector.
After remaining below the 50-neutral mark for two consecutive quarters, the Agbiz/IDC Agribusiness Confidence Index (ACI) increased by 8 points in Q3 2026 from Q2 to 53 points. The current ACI level indicates that South African agribusinesses are optimistic about business conditions. The optimism this quarter was primarily among respondents in the financial services sector, grain traders, input suppliers, and the feed industry. Meanwhile, the other respondents maintained their views from the last quarter.
Still, while the overall reading of the ACI is encouraging, the respondents highlighted concerns in their comments about a likely El Niño-driven drought in the upcoming 2026/2027 season, ongoing geopolitical tensions, and their impact on input costs and trade disruptions. Others also expressed concerns about the slow process of opening more export markets to support the long-term growth of agriculture. This survey was conducted in the first week of September 2026 and covered businesses across agricultural subsectors nationwide.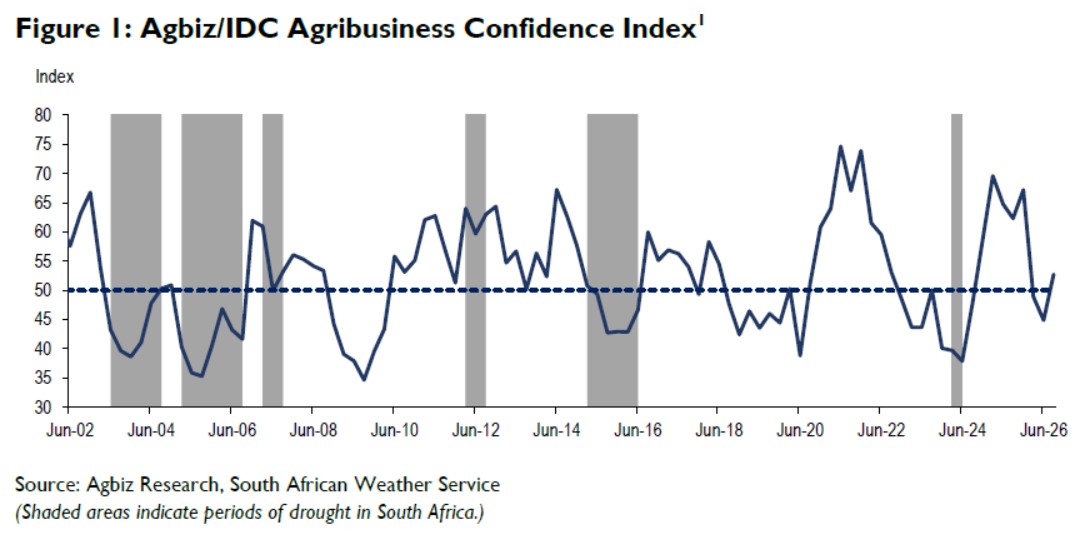
Discussion of the subindices
The ACI comprises ten subindices; and most of them improved in Q3 2026. Here is the detailed view of the subindices.
- The market share subindex rose by 6 points to 67 in Q3 2026. This improvement in mood mirrors the ample harvest in horticulture and field crops, and the generally better export performance so far this year.
- The capital investments subindex rose by 29 points from Q2 2026 to 63 in Q3. This was surprising, as high-frequency data show that tractor and combine harvester sales remain weak, with farmers anticipating a challenging drought season in the 2026/2027 production year.
- The sub-index measuring export volumes increased by 21 points to 58 in Q3. This is aligned with the strong agricultural exports. For example, in the first half of 2026, South Africa’s agricultural exports amounted to US$7,8 billion, up 11% from the first half of 2025.
- The general economic conditions subindex rose by 10 points to 38 in Q3 2026. While this is a welcome change in mood, it remains unclear whether the economic data support it. The GDP data for the second quarter is yet to be released on September 8, 2026, which is a day after this report.
- On the neutral side, the turnover subindex confidence remained unchanged from Q2 2026, stabilising at 67. The ample harvests of grains, oilseeds, and various fruits and vegetables primarily support these favourable index levels. Similarly, the net operating income subindex stabilised at 50 points in Q3 2026.
- On the negative side, the employment subindex fell by 10 points to 46 in Q3 2026. This is also unsurprising, as data on South African agricultural jobs has shown a slight decline since the start of the year. For example, the Quarterly Labour Force Survey data for the second quarter of 2026 show that the farming sector employed 944 000 people, down 2% quarter-on-quarter but up 4% from the same period last year.
- The general agricultural conditions subindex fell by 25 points to 36 in Q3 2026. This was mainly due to the expected El Niño drought and the likely negative impact on agricultural production in the 2026/2027 season.
Changes in interpretation
The subindices of the debtor provision for bad debt and financing costs are interpreted differently from the abovementioned indices. A decline is viewed as a favourable development, while an increase signals growing financial strain.
In Q3 2026, the debtor provision for bad debts subindex increased by 13 points to 46, reflecting likely challenging financial conditions in the sector due to higher input costs, animal diseases and the fears of the likely drought. The financing costs subindex increased by 42 points to 58, reflecting likely higher future financing costs and an expected rise in interest rates.
Concluding remarks
“In essence, the ACI’s Q3 2026 results paint an encouraging picture, reflecting a favourable agricultural season we are leaving behind. But going forward, there remains uncertainty. The likely El Niño drought, higher input costs, lingering foot-and-mouth disease in the cattle industry, port inefficiencies, and the need to open new export markets remain the primary focus for many agricultural and agribusiness stakeholders.
The geopolitical tensions also continue to present challenges, including rising farm input costs and shipping costs. These geopolitical tensions do not bode well for South Africa’s efforts to open more export markets, all of which are essential for the long-term growth of the agricultural sector,” said Wandile Sihlobo, chief economist of the Agricultural Business Chamber of South Africa (Agbiz).
ISSUED BY:
Wandile Sihlobo
Chief Economist, Agricultural Business Chamber of South Africa (Agbiz)
E-mail: wandile@agbiz.co.za
Source: https://agbiz.co.za/content/economic-research?page=agribusiness-confidence
Fact of the month
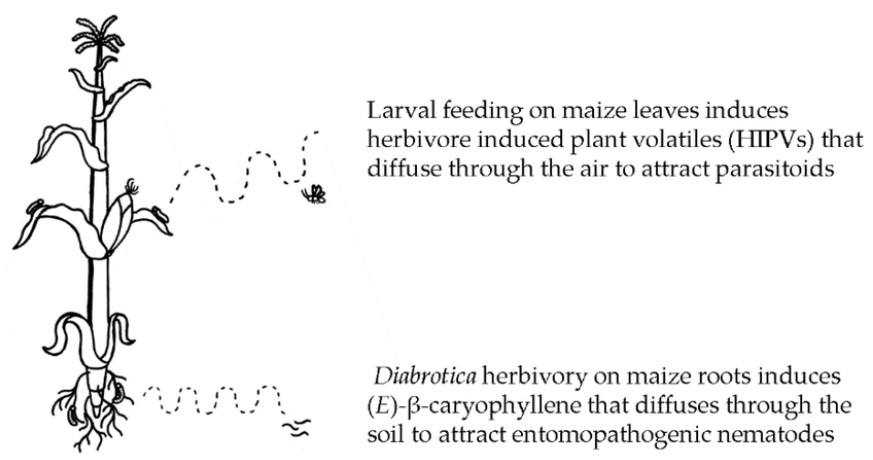
Maize has a natural, indirect defence system against pests. When pests like caterpillars or rootworms damage maize leaves or roots, the plant releases specific volatile organic compounds (VOCs) known as herbivore-induced plant volatiles (HIPVs). These chemicals act like an alarm signal, drawing in parasitic wasps and predatory insects that hunt the pests.
Weather and climate
NATIONAL ASSESSMENT
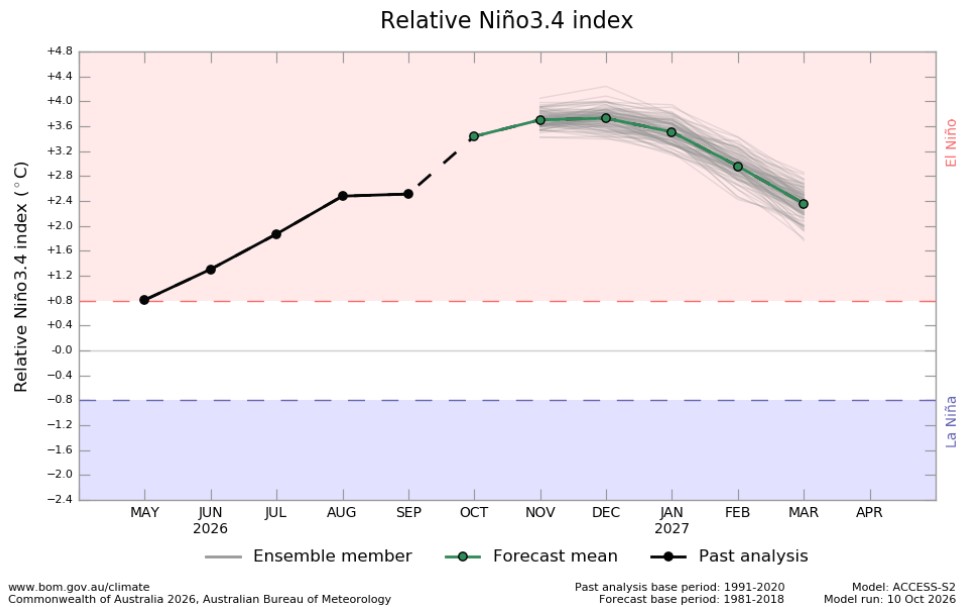
The 2026 El Niño event continues to intensify across the central-eastern equatorial Pacific. The traditional Niño 3.4 index shows a pronounced and sustained rise, with the seasonal mean reaching +2,46°C during July to September 2026 and the September monthly value increasing further to +2,84°C. The latest weekly Niño 3.4 index, centered on October 14, 2026, climbed to +3,3°C, providing further evidence that El Niño is already very strong and continuing to strengthen. Weekly sea surface temperature anomalies across the central-eastern equatorial Pacific have remained above +3°C for a fifth consecutive week, underscoring the exceptional intensity and persistence of the event.
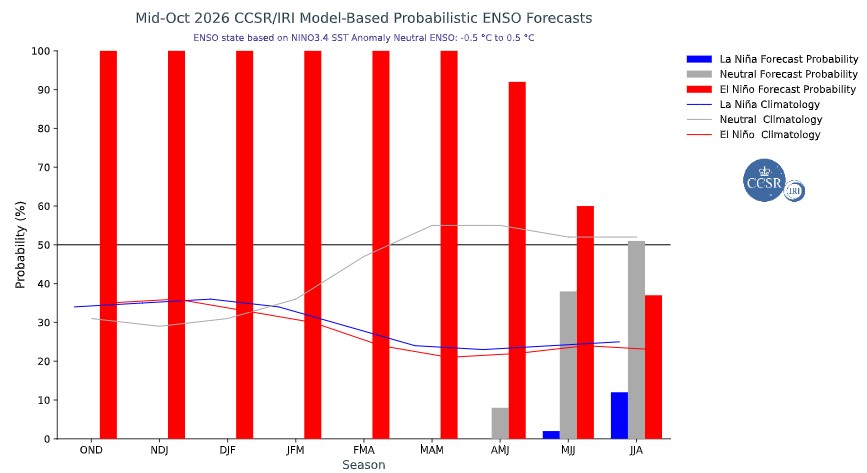
The Bureau of Meteorology’s model indicates that El Niño is at near-record levels. Both oceanic and atmospheric indices reflect values consistent with a strong El Niño, with further intensification forecast during the rest of spring. All models, including the bureau’s, forecast the warmth in the tropical Pacific to peak around November or December, and persist into autumn 2027.
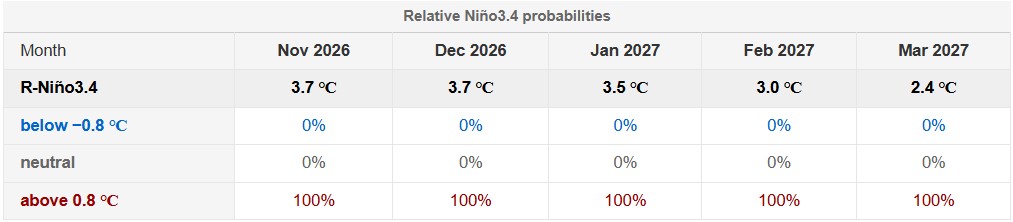
The graph below reflects current El Niño in the tropical Pacific. The graph supports the strong El Niño forecast.
http://www.bom.gov.au/climate/ocean/outlooks/?index=nino34
The latest Climate Watch issued by the SA Weather Service (30 September 2026) the forecasts indicate that below-normal rainfall is expected over most parts of the summer rainfall areas due to the anticipated strong El Niño.
Above-normal minimum and maximum temperatures are predicted for most parts of South Africa. The country will experience drier and warmer conditions during early and mid-summer seasons. These below-normal rainfall and above-normal temperature forecasts will likely have a negative impact on crop and livestock production.
Above normal maximum temperatures increase the risk of heat stress in crops and livestock and may raise the risk of veld fires. Therefore, the relevant decision-makers are encouraged to advise farmers in these regions to practice soil and water conservation, proper water harvesting and storage, and other appropriate farming practices.
Source: https://www.weathersa.co.za/api/wp/uploads/2026/10/SCOLF202609.pdf
SUNSPOTS
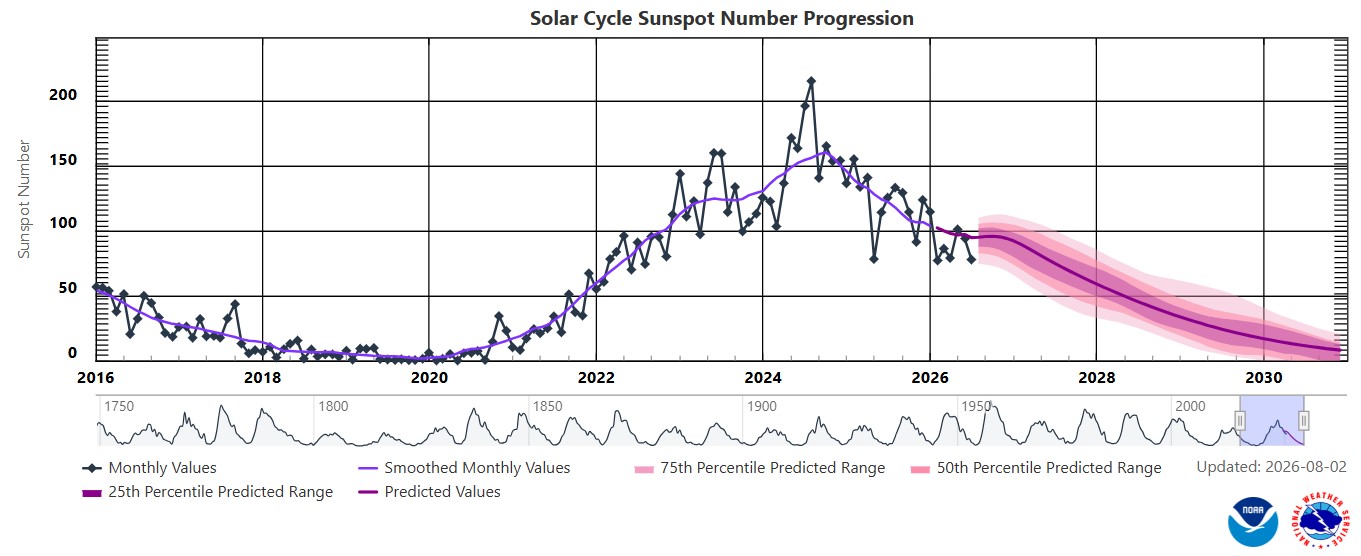
Sunspots are darker, cooler areas on the sun’s surface that arise due to disturbances in the sun’s magnetic field. Sunspots vary in numbers throughout the 11-year solar cycle.
According to a study published on Science Direct the rainfall rate can be directly related to the sunspot number, but shows different characteristics during solar maximum (the peak of the sun’s 11-year solar cycle) years. Though a lag correlation exists between sunspot number and rainfall, sunspots have an increasing effect on rainfall. Studies show that the more sunspots are present the higher the rainfall and the less sunspots the lower the rainfall.
ENSO (El Niño Southern Oscillation) occurs at irregular intervals between three and seven years causing global climate system variation. Considering this event occurs periodically, it might be triggered by the 11-year solar cycle as an energy source.
The graph below shows the latest 11-year solar cycle. An upward trajectory suggests that higher rainfall can be expected, characteristic of a La Niña. A downward trajectory suggests that lower rainfall can be expected, characteristic of an El Niña.
Between October 2020 to February 2025 the actual sunspot numbers were higher than the predicted values. September 2026 falls outside the predicted range, with a monthly mean sunspot value of 60,3.
Sources: https://www.spaceweatherlive.com/en/solar-activity/solar-cycle.html https://www.sciencedirect.com/science/article/abs/pii/S136468262200116X#:~:text=It%20was%20observed%20that%20rainfall,an%20increasing%20effect%20on%20rainfall
https://www.space.com/solar-cycle-frequency-prediction-facts
https://eos.org/articles/why-did-sunspots-disappear-for-70-years-nearby-star-holds-clues https://aip.scitation.org/doi/abs/10.1063/1.4930679?journalCode=apc#:~:text=ENSO%20occurs%20at%20irregular%20interval,cycle%20as%20an%20energy%20source
Market risk
GRAIN MARKET ANALYSIS
- Ending stock – National
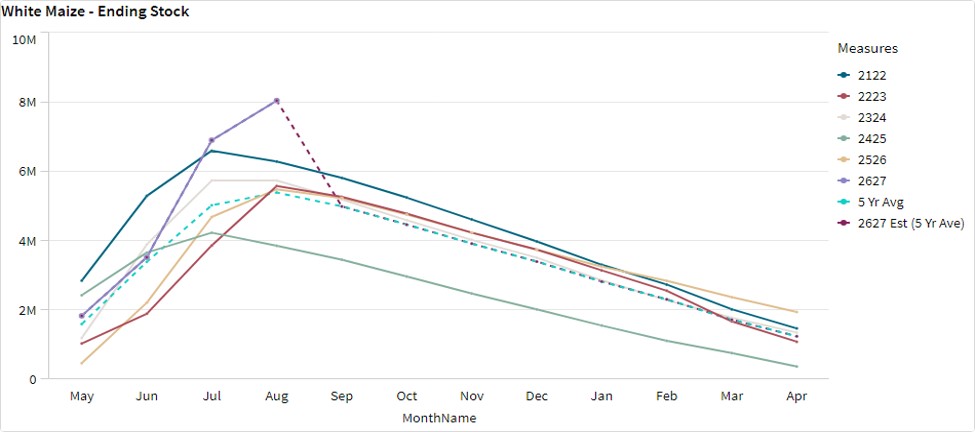
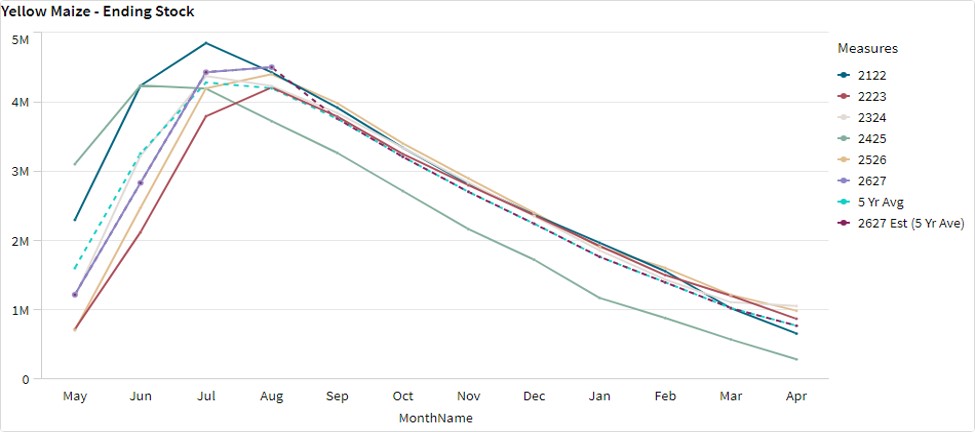
Ending stock data is gathered from the NAMC. The estimates are reassessed and reported by the Grain & Oilseeds supply & demand estimates committee. The following is the projected ending stock for April 2027 in tonnages for the 2026/2027 season:
- White maize => 4 303 614t
- Yellow maize => 1 057 110t
The following is a summary of September 2026 ending stock projections for the 2025/2026 season:
- Wheat => 758 184t
The following is a summary of the February 2027 projected ending stock for the 2026/2027 season:
- Sunflower => 79 791t
- Soybeans => 269 155t
- Sorghum => 51 571t
The estimated white maize ending stock for April 2027 is 2 755 765 t. That is 816 910 t more than the ending stock for the 2025/2026 season. The estimated yellow maize ending stock for April 2027 is 1 340 630 t. That is 350 497 t more than the ending stock for the 2025/2026 season.
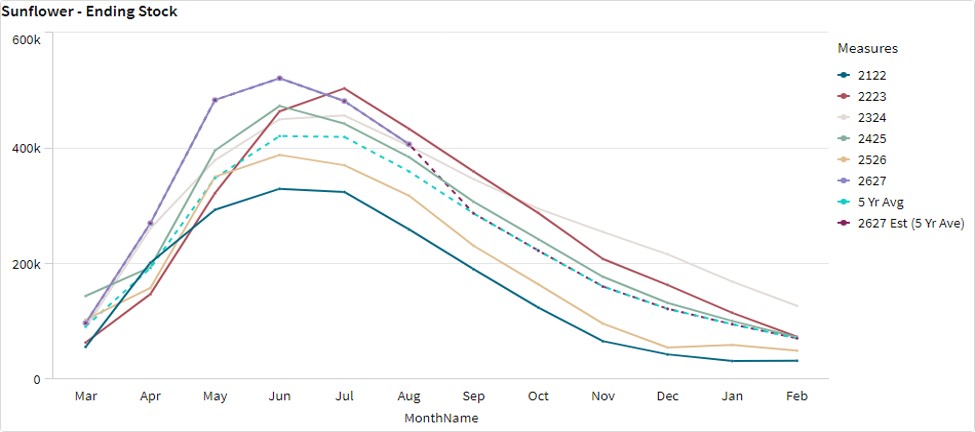
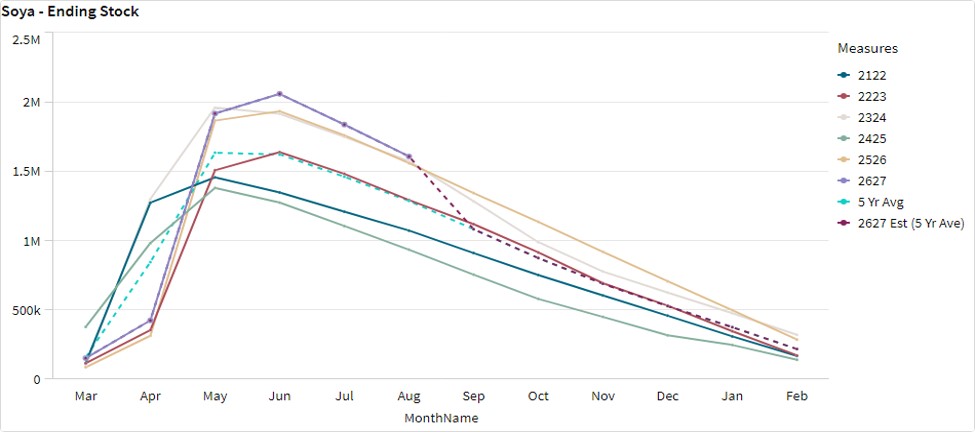
The graphs below show the predicted ending stock for the different commodities according to SAGIS data. A five-year average has been calculated to determine the estimated ending stock for the current season.
The estimated sunflower ending stock for the season 2026/2027 is 70 901 t based on the five-year average. This is 21 635 t more than the previous season.
The estimated soybean ending stock for the season 2026/2027 is 217 549 t based on the five-year average. This is 68 571 t less than the previous season.
- Crop estimations
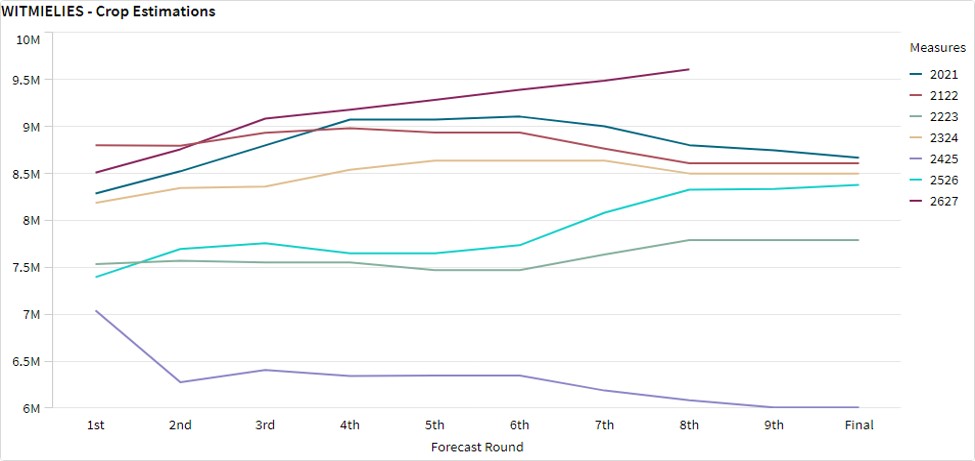
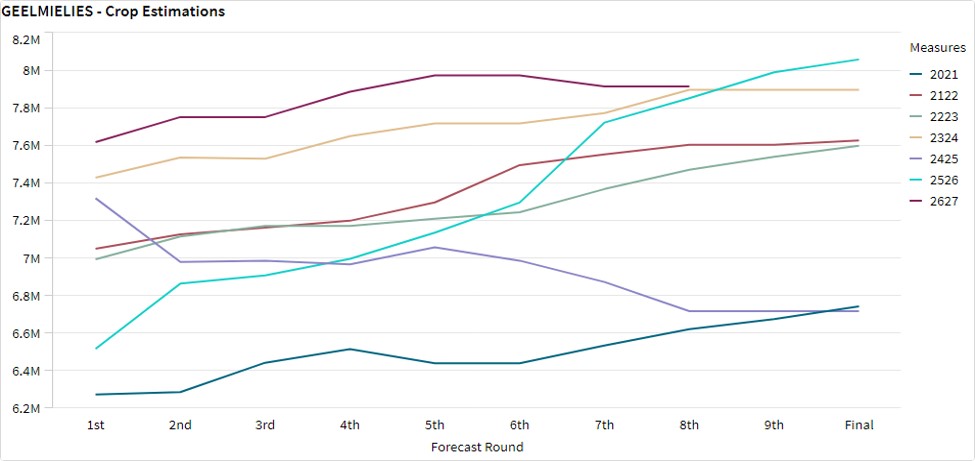
According to the Crop Estimate Committee (CEC) eighth production forecast for 2026, the total area estimate for maize in South Africa is 2,724 million ha, which is more than the 2,597 million ha planted for the previous season. The total forecasted tons for white and yellow maize are 17 million t from the eighth forecast.
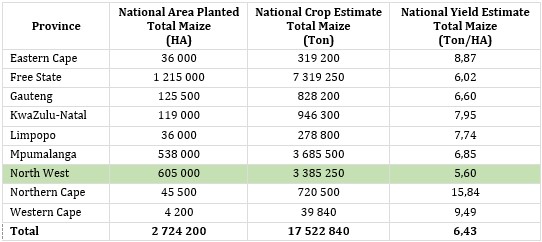
Source: CEC (Crop Estimates Committee)
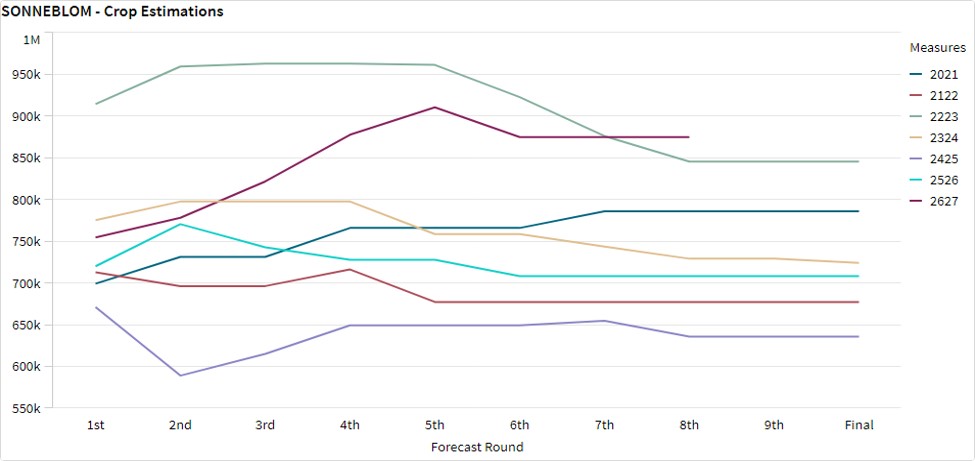
- Production forecast sunflower
The production forecast for sunflower seed is 874 805 t. The area estimate for sunflower seed is 570 100 ha while the expected yield is 1,53 t/ha.
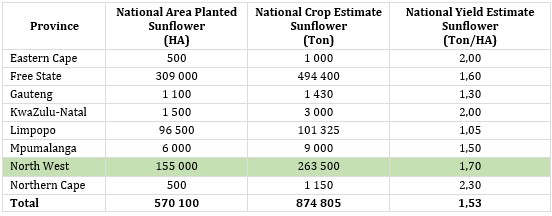
Source: CEC (Crop Estimates Committee)
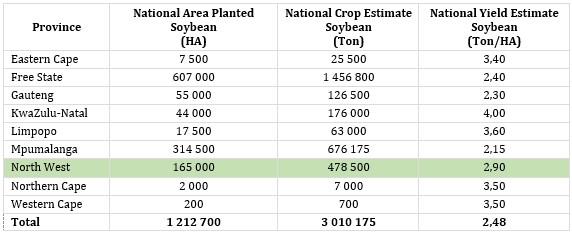
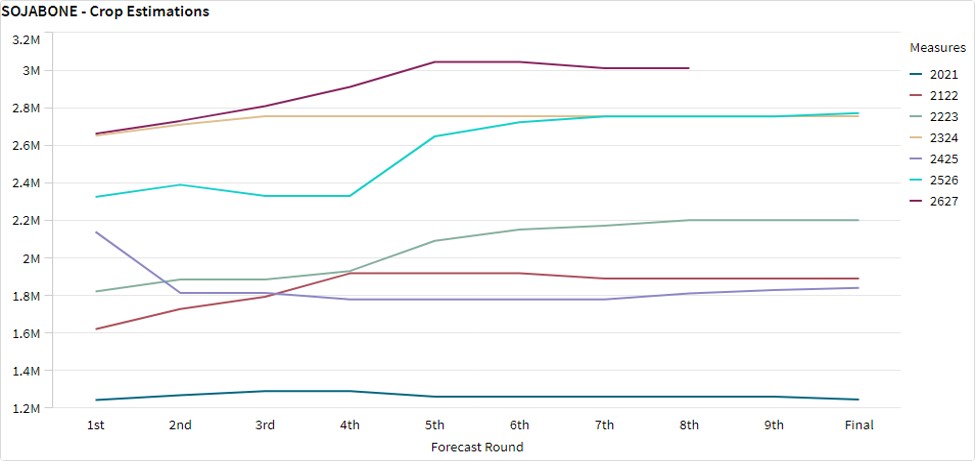
- Production forecast soybeans
The production forecast for soybeans is 3,010 million t. The estimated area for soybeans is 1,213 million ha with an expected yield of 2,48 t/ha.
Source: CEC (Crop Estimates Committee)
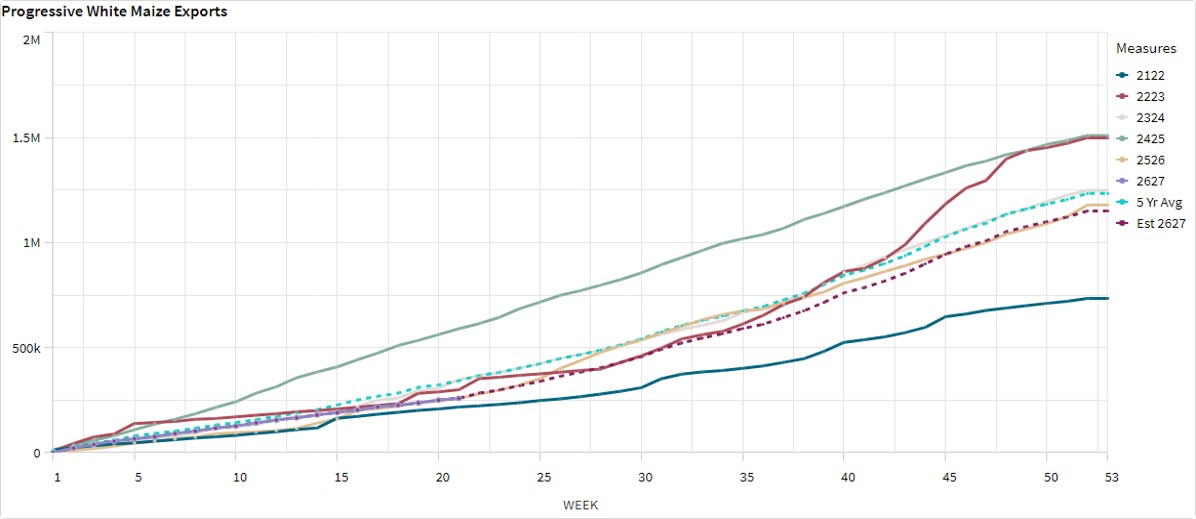
- Imports and exports – National
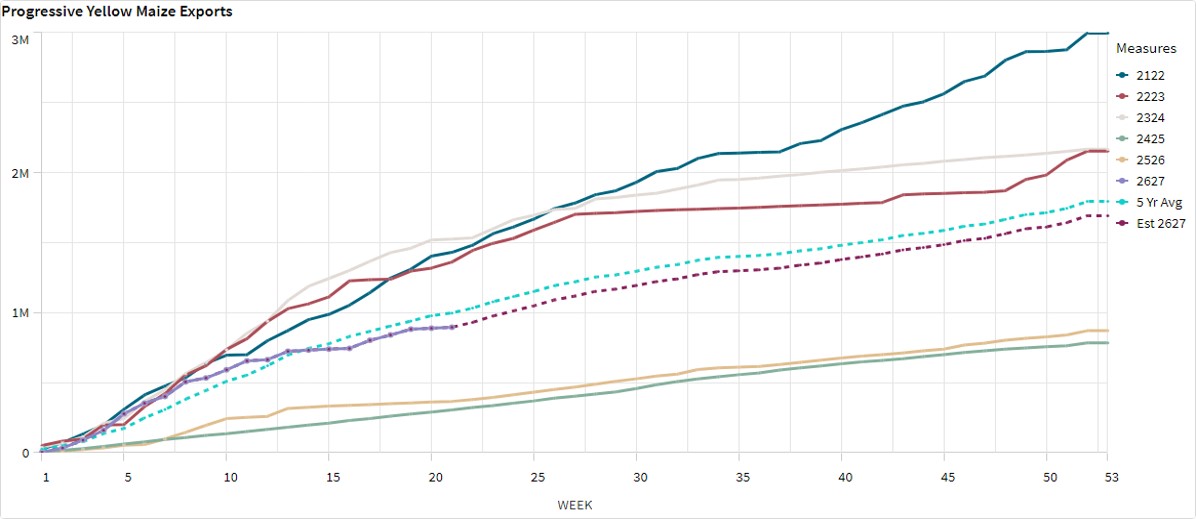
For the production season ending April 2027, 258 932 t of white maize and 895 880t of yellow maize have been exported so far as seen in the graphs below (week 21).
- Parity prices
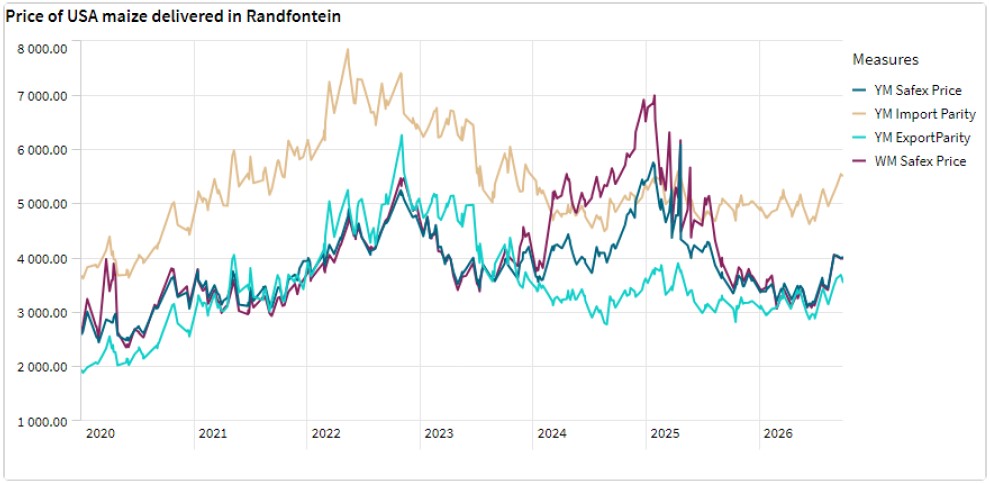
South Africa is a small producer compared to other countries and is thus a price taker (meaning that we cannot influence world prices). Because of this, our local prices are normally between import and export parity, which is illustrated in the figure below. An import parity price is defined as the price which a buyer will pay to buy the product on the world market. This price will include all the costs incurred to get the product delivered to the buyer’s destination.
An export parity price is defined as the price that a local seller could receive by selling his product on the world market e.g., excluding the export costs. The price which the seller obtains is based on the condition that he delivers the product at the nearest export point (usually a harbour) at his own expense.
The graph below reflects the Safex price, import parity and export parity of yellow maize as well as the Safex price of white maize. The import and export parity prices for white maize is not released by Grain SA for this period.
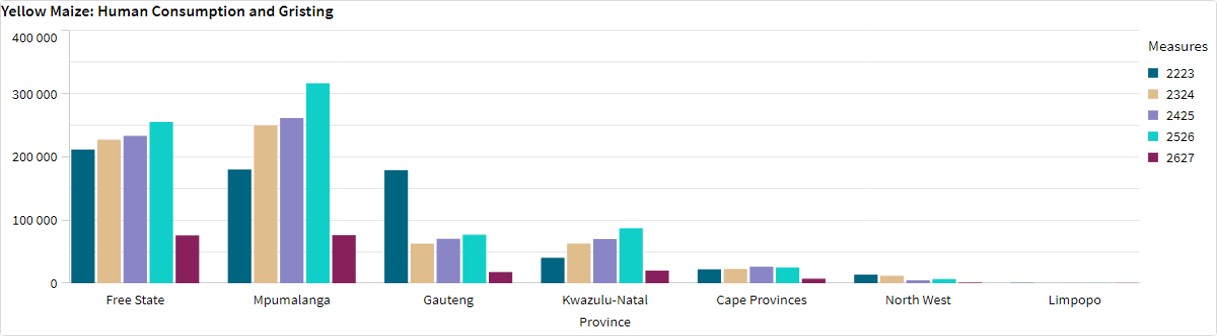
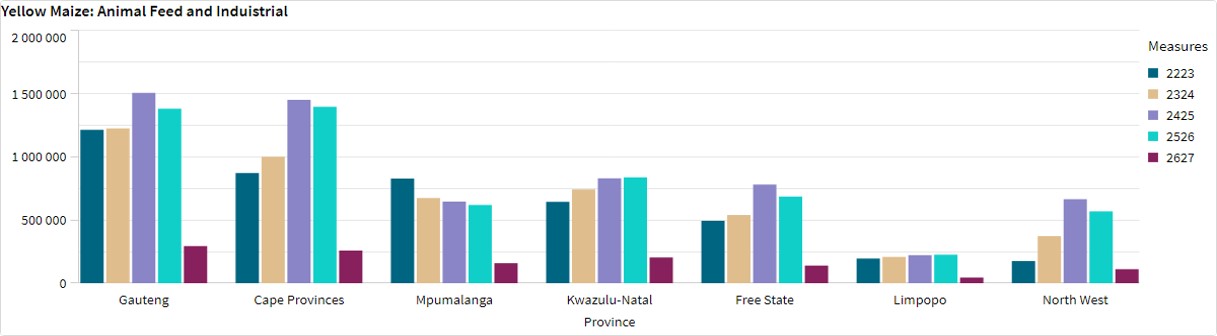
- Grain processing per province
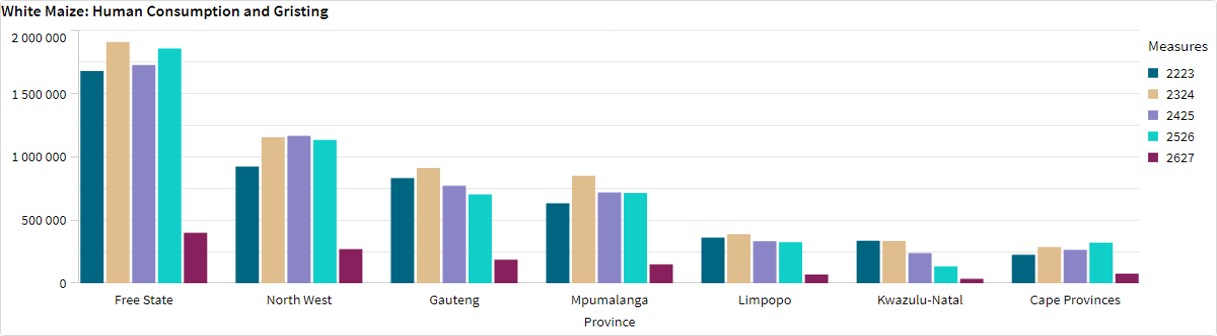
For the marketing year 2026/2027, May 2026 to April 2027, the Free State dominates the white maize that is used for human consumption and gristing. North West consumed the second most white maize produced for human consumption for the marketing year.
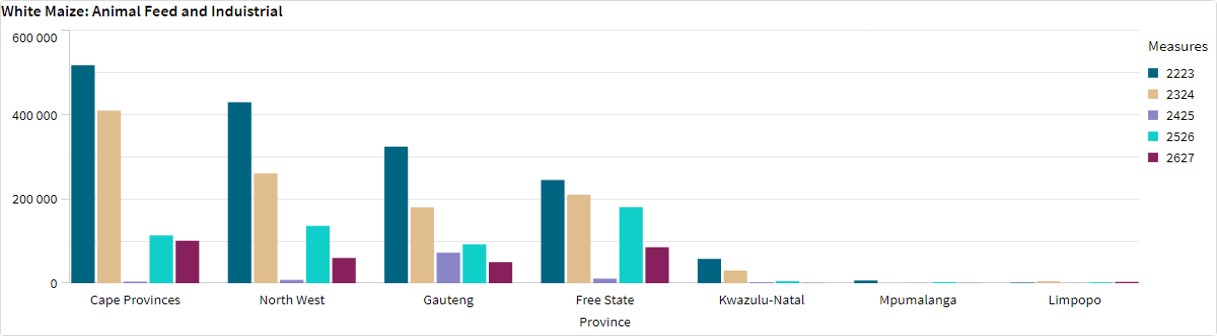
The Cape provinces used the most white maize for animal feed and industrial usage, with the Free State using the second most.
Mpumalanga processed the most yellow maize for consumption and gristing and Gauteng processed the most yellow maize for animal feed and industrial purposes.
- Exchange rate
NWK Group is exposed to foreign exchange rate risk in various business areas, such as commodity prices and trade imports, etc.
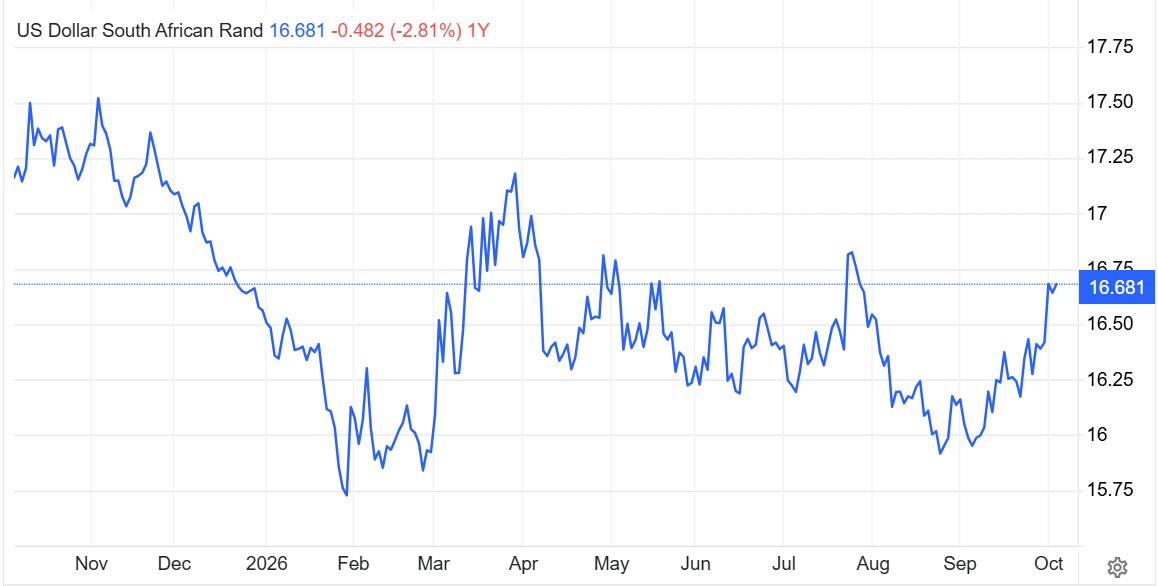
The South African rand depreciated against the dollar with 0,15% in September at R16,20/$. Stalled US-Iran negotiations kept oil prices elevated, weighing on risk-sensitive currencies in oil-importing economies. At the same time, heightened geopolitical uncertainty boosted safe-haven demand for the greenback, while subdued prices of key precious metals limited support the rand.
Source: Trading Economics.
- Interest rate
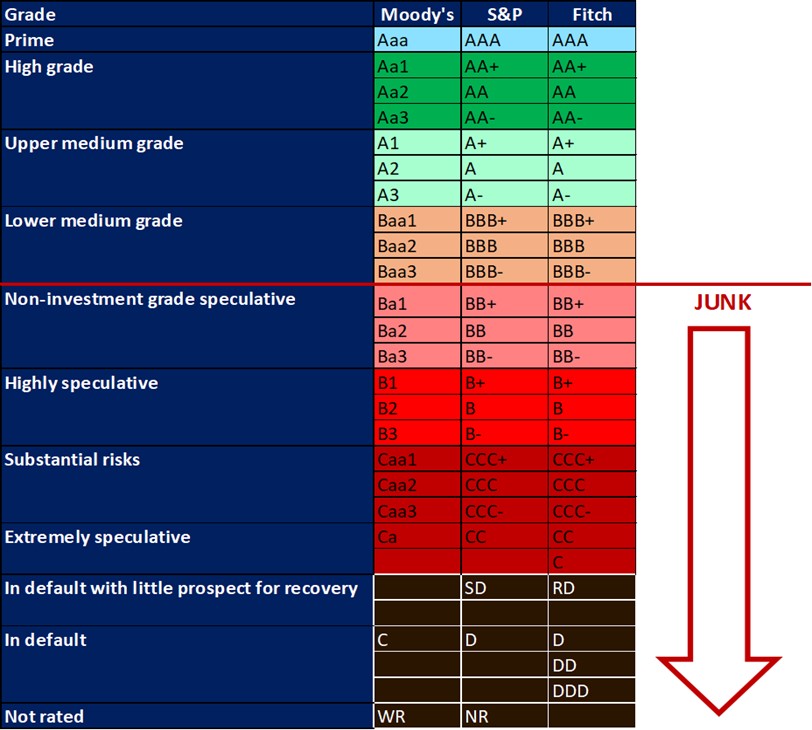
All major rating agencies, i.e., Moody’s, S&P and Fitch, have South Africa’s credit ratings in sub-investment-grade territory. S&P, however, raised the country’s investment status for the first time in nearly two decades from BB- to BB.
The South African Reserve Bank is also having new discussions around the repo rate, how it is calculated and whether it should still exist. The rate has been fixed at 350 basis points above the country’s monetary policy rate since 2001. These discussions will be monitored over time to see how things unfold.
Source: https://www.spglobal.com/ratings/en/regulatory/article/-/view/type/HTML/id/3479175
https://www.moneyweb.co.za/news/economy/kganyago-favours-ending-use-of-prime-rate/
https://www.moneyweb.co.za/moneyweb-radio/safm-market-update/prime-interest-rate-what-is-it-and-do-we-need-it/
- Interest rate
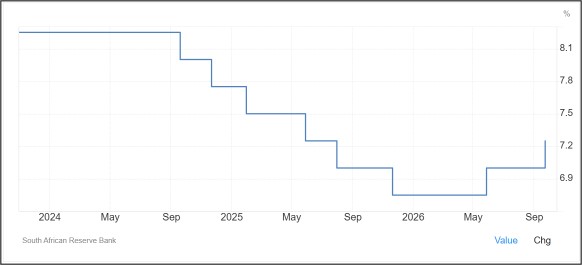
During the previous Monetary Policy Committee (MPC) meeting held on 23 September 2026the committee decided to keep interest rates unchanged. The repo rate remained unchanged to 7% and the prime rate rose to 10,25%. The next MPC meeting will be held on 19 November 2026.
Interest rate movement:
30th January 2025 – 11,00%
20th March 2025 – 11,00%
29th May 2025 – 10,75%
31st July 2025 – 10,50%
18th September ‘25 – 10,50%
20th November ‘25 – 10, 25%
29th January ‘26 – 10,25%
26th March ‘26 – 10,25%
28th May ‘26 – 10,25%
23rd July ‘26 – 10,50%
23rd September ’26 – 10,75%
- Current interest rate
The South African Reserve Bank raised its key repo rate by 25 basis points to 7,25% on 23 September, as widely expected, citing the need to bring inflation back toward its target. The decision was unanimous, reflecting upside risks to inflation and downside risks to economic growth.
Consumer price inflation edged up to 4,4% in August from 4,3% in July, remaining close to the midpoint of the Reserve Bank’s 3% to 6% target range. Policymakers said headline inflation is likely to rise above 5% later this year and in early 2027, driven by higher fuel prices, before slowing as the fuel-price shock recedes. Inflation is expected to return to around 3% toward the end of 2027.
Accordingly, inflation forecasts were revised higher to 4,4% in 2026 (from 4% previously), 4% in 2027 (from 3,8%), and 3,2% in 2028 (from 3,1%). Regarding economic activity, the SARB cut its 2026 growth forecast to 1,2% (from 1,4%) but maintained the 2027 and 2028 projections at 1,7% and 1,9%, respectively.
Source: South African Reserve Bank: Trading economics
- Inflation rate
As the inflation rate is a driver for increases and decreases in interest rates the current rate and forecast have to be assessed to foresee further increases in the interest rate.
- Current
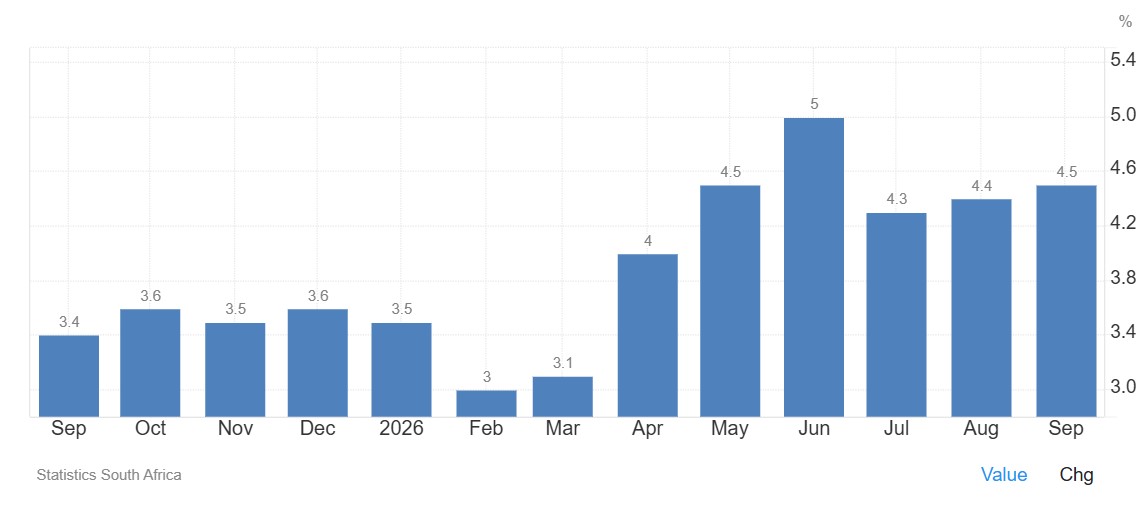
South Africa’s annual inflation rate rose for the second month to 4,5% in September 2026 from 4,4% in August, but below the expected 4,7%. Still, the headline inflation remained above the SARB’s 3% target and the upper bound of its 2% to 4% tolerance band. The acceleration was largely driven by rising transport prices, which climbed further by 10,8%, compared to 8,8% in August, largely reflecting a sharper increase in fuel prices (27,9% vs 20%).
Diesel prices jumped 46%, while petrol prices rose 25%, following domestic price hikes. Food inflation also rose slightly faster to 1,2% from 1,1% in August. The core inflation, which excludes prices of food, non-alcoholic beverages, fuel and energy, edged down to 4% in September from 4,1% in August. On a monthly basis, the CPI went up by 0,4%, after being flat in the previous month.
Source: Statistics South Africa.
- Inflation rate forecast
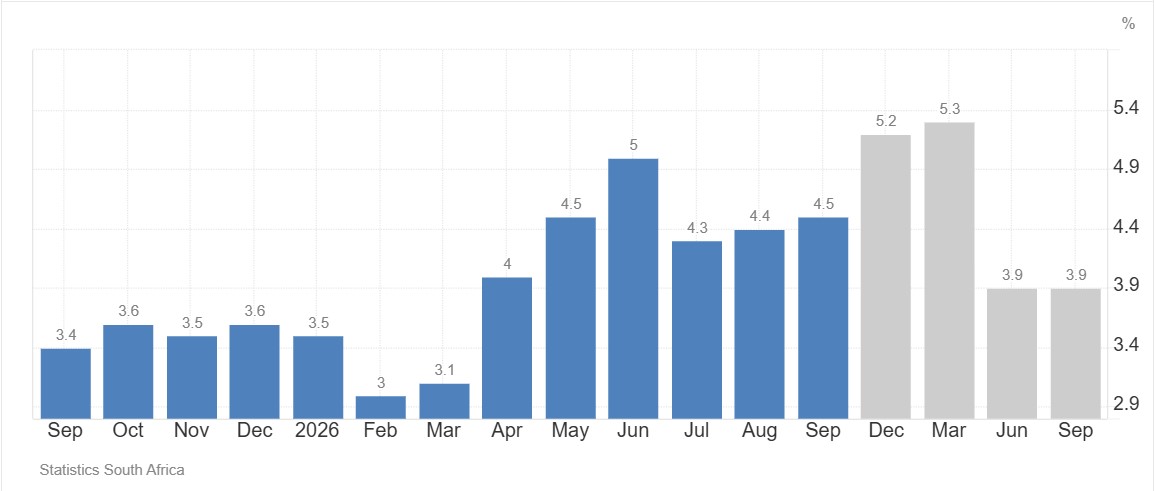
Inflation rate in South Africa increased to 4,5% in September from 4,4% in August of 2026. Inflation rate in South Africa is expected to be 5,2% by the end of this quarter, according to Trading Economics global macro models and analysts expectations. In the long-term, the South Africa inflation rate is projected to trend around 4% in 2027 and 3,2% in 2028, according to their econometric models.
- Highlights in the agrochemical sector
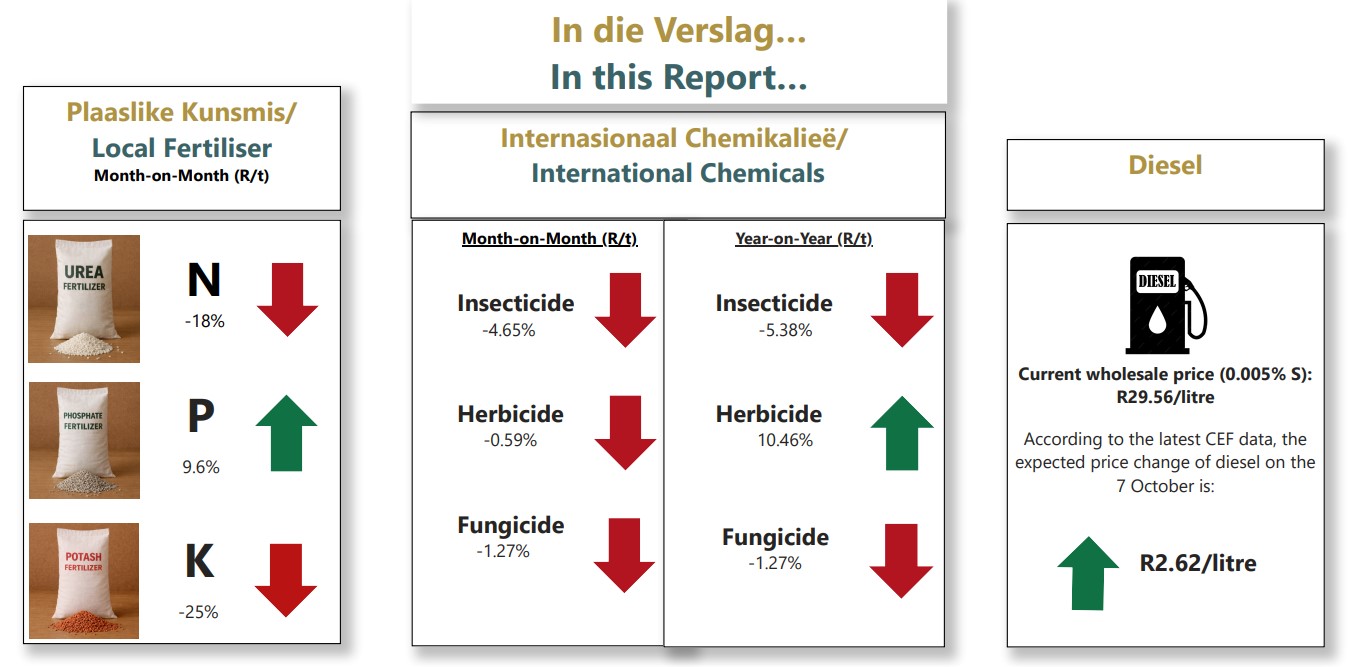
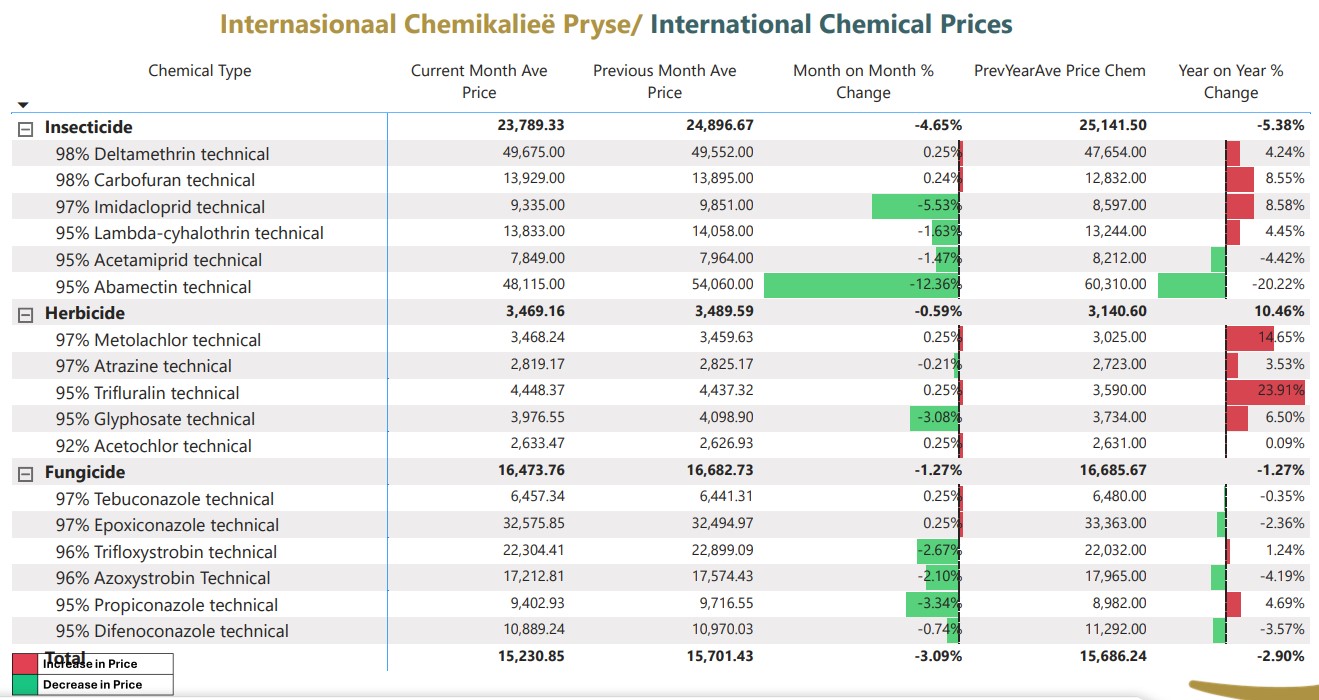
On average month-on-month period, insecticide prices decreased by 4,65%, herbicide by 0,59% and fungicide by 1,27%.
On a year-on-year basis, chemical prices for insecticides and fungicides decreased by 5,38% and 1,27, respectively, and herbicides increased by 10,46%.
- Fuel costs

The wholesale diesel price is currently R29,11/litre for diesel (0,05%) and R29,56/litre for diesel (0,005%). According to the Minister of Mineral and Petroleum Resources, diesel prices increased due to global supply constraints arising from geopolitical tensions between Russia and Ukraine, refinery shortages in the Middle East, a weaker Rand against the US dollar, and the impact of the higher slate levy.
According to the CEF, diesel prices are expected to increase further from 7 October, with projected increases of approximately R2,24/litre for diesel (0.05%) and R2,62/litre for diesel (0,005%).
Crude oil is currently trading at approximately $107,47/barrel, having risen above $100/barrel from 10 September. The increase was driven by continued attacks on Saudi energy infrastructure, reduced shipping activity through the Strait of Hormuz, disruptions to trade routes in the Red Sea, and the temporary loss of a major Saudi export pipeline. These developments have heightened concerns about global supply shortages and contributed to higher international fuel prices.
Sources: https://grainsa.co.za/applied-economics/inputs/#file-viewer-4
Future prices
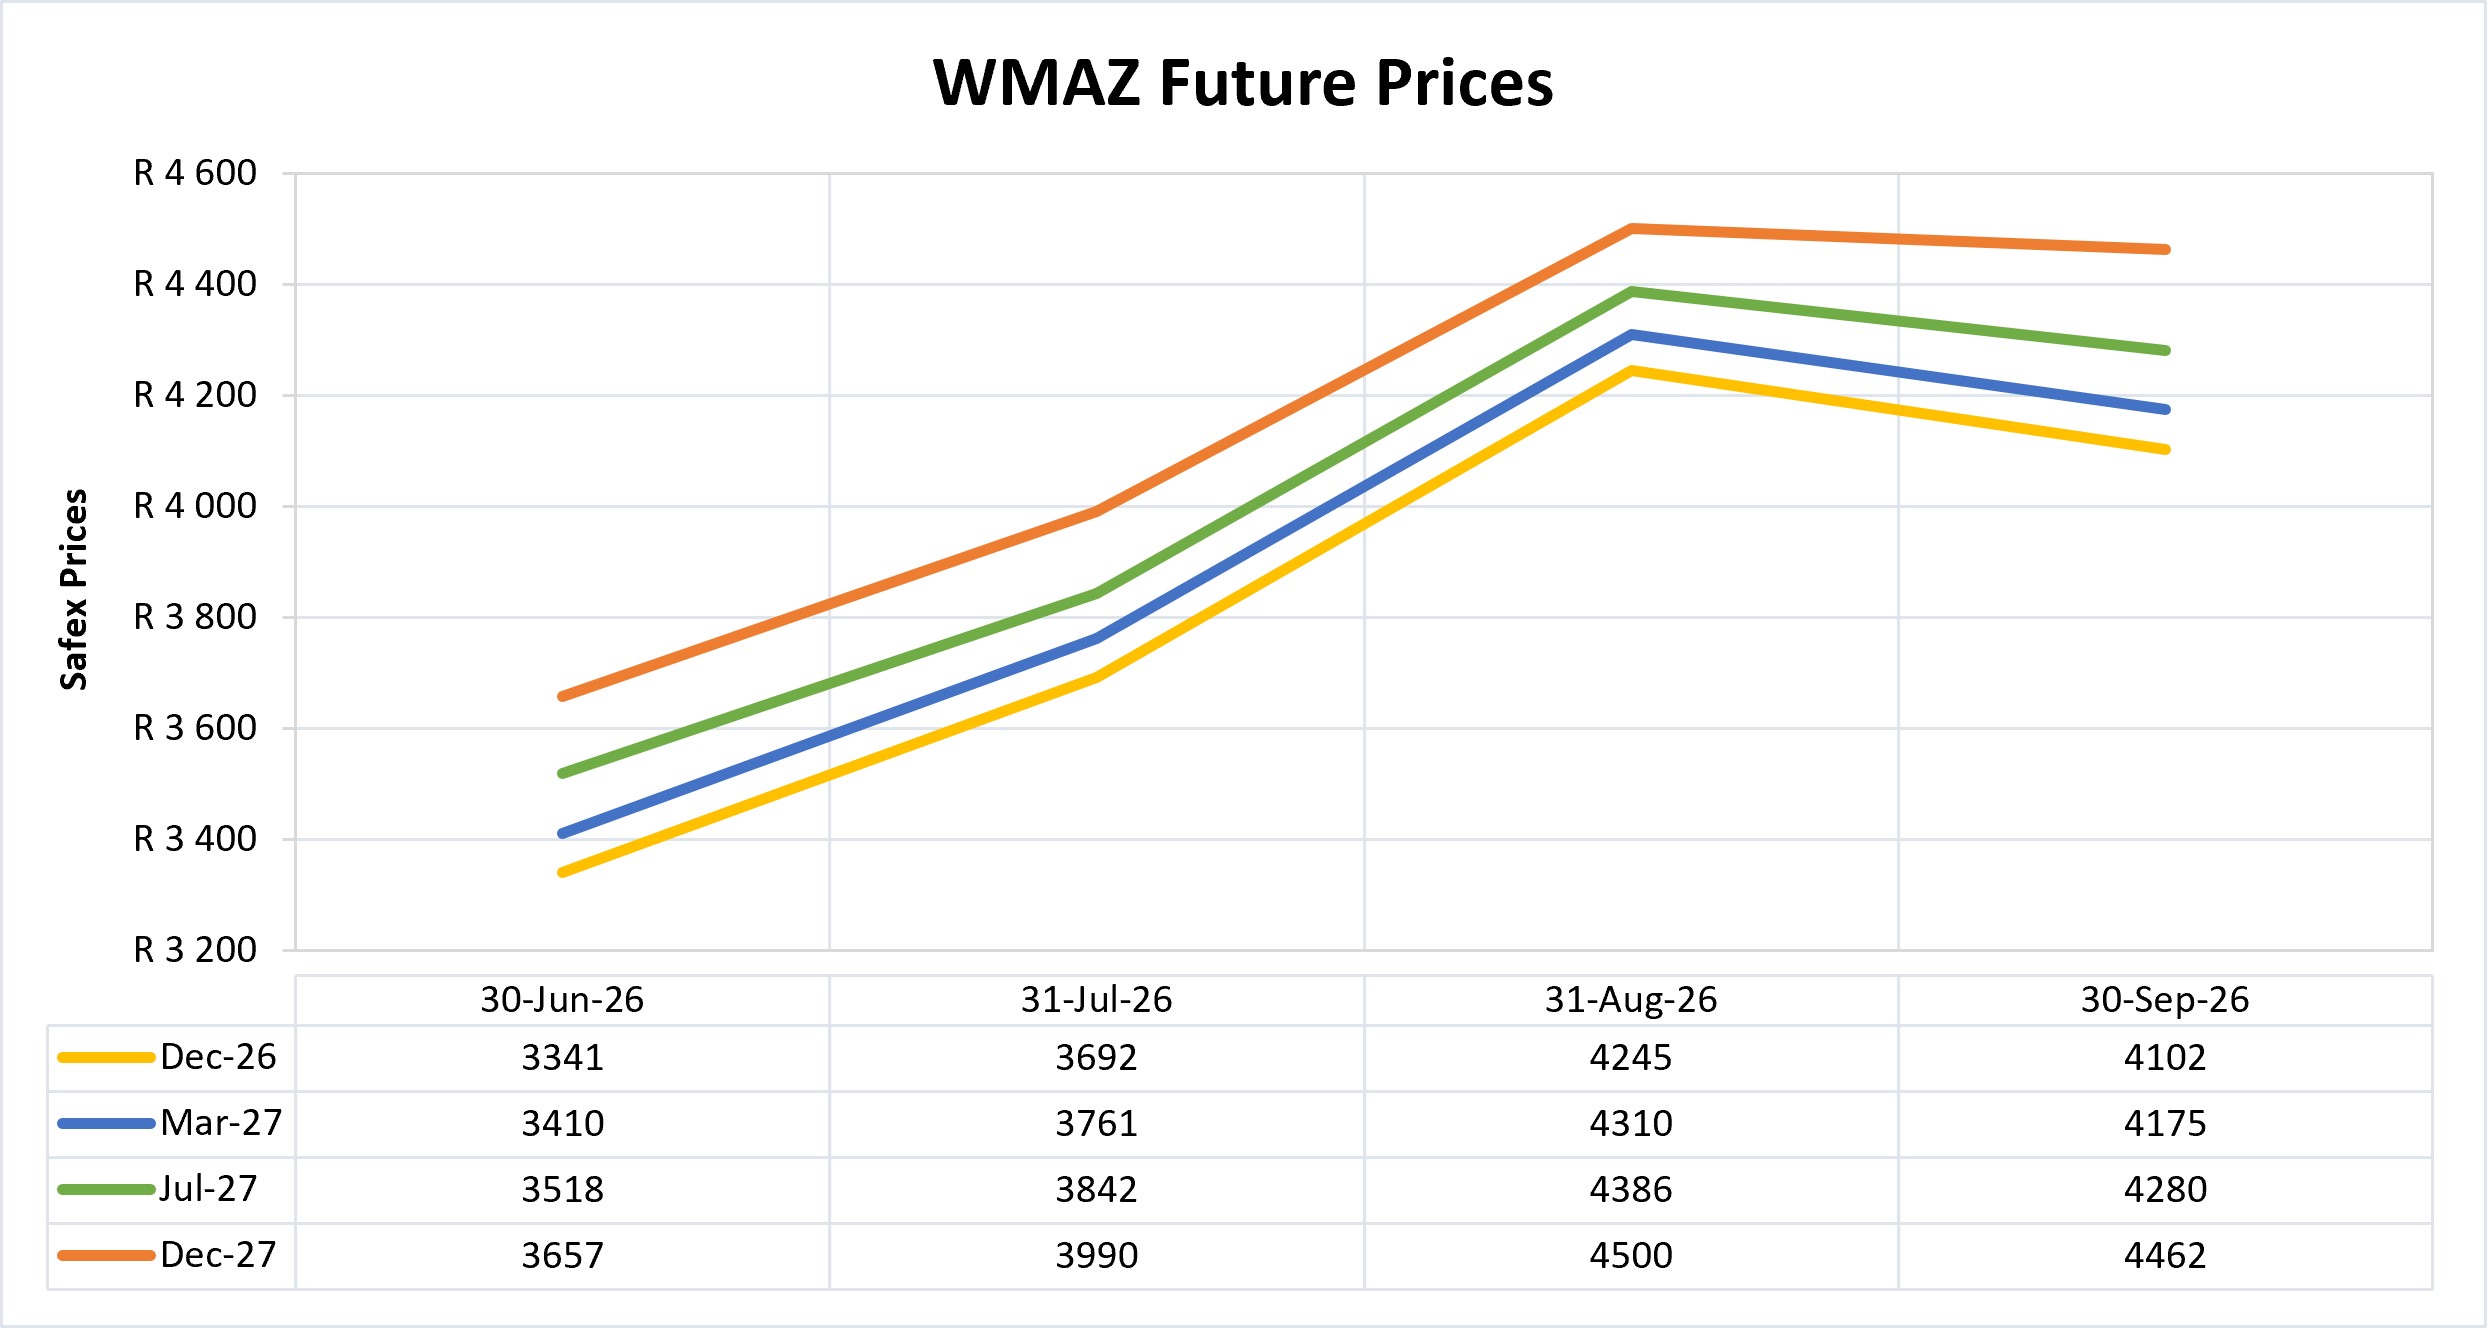
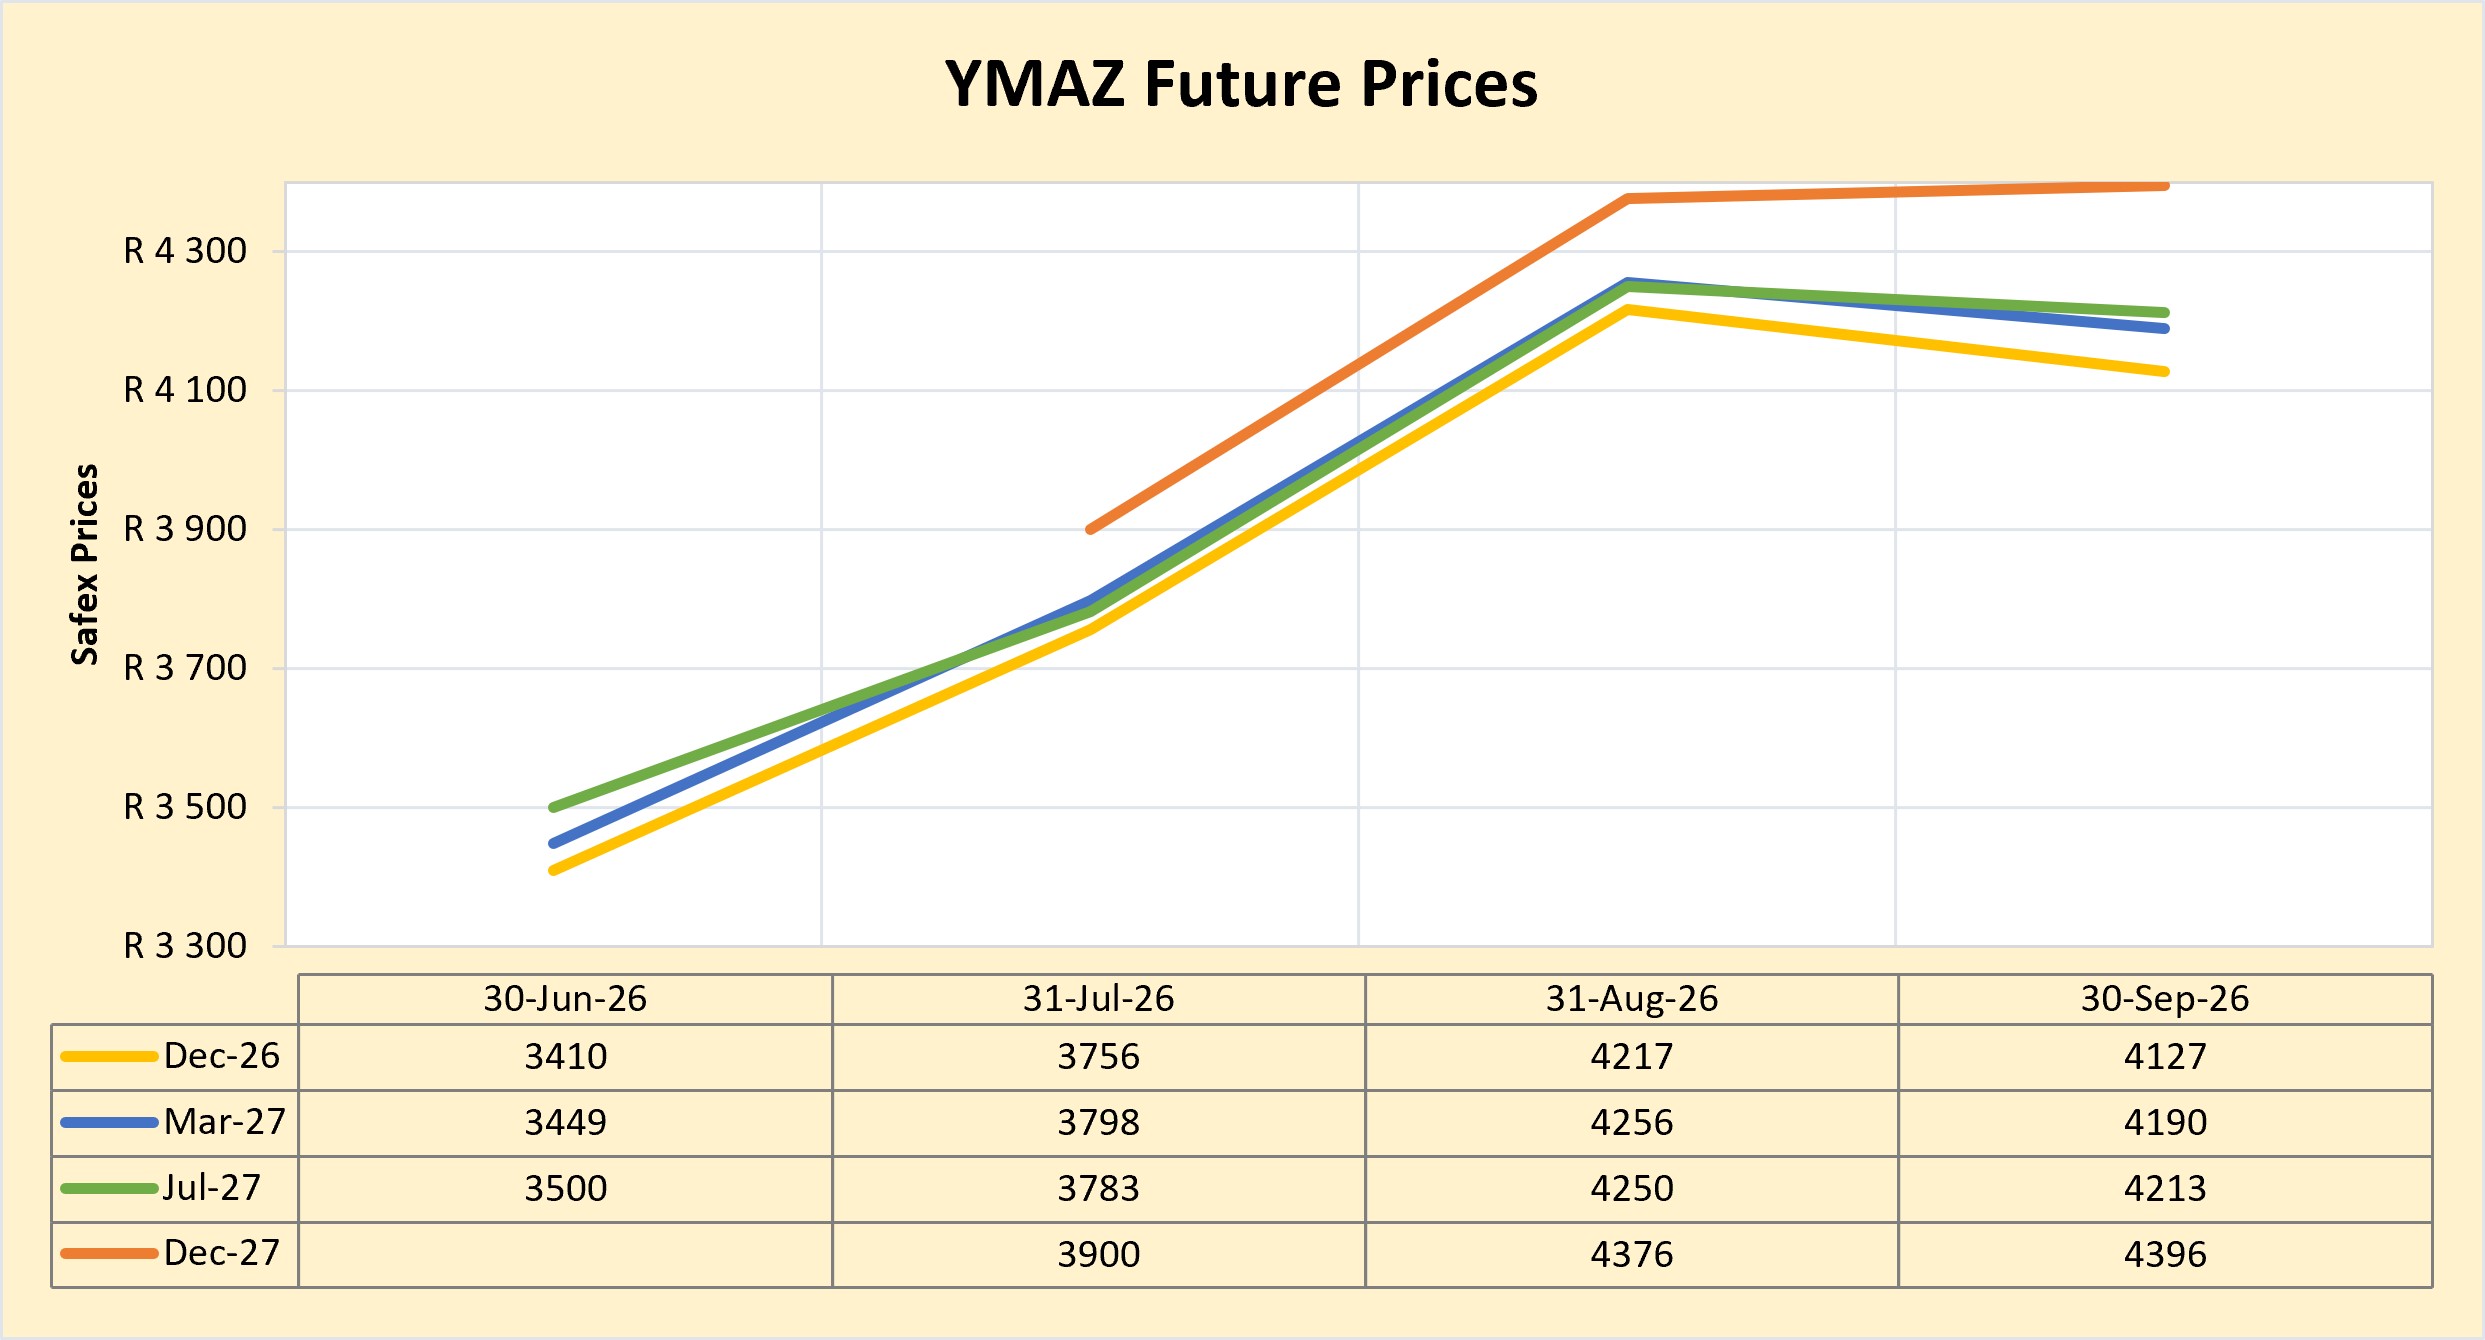
The graphs below illustrate the market sentiment for maize, in the form of future contracts, for the upcoming contract months. The market sentiment is the expectation of supply and demand fundamentals relating to white‑ and yellow maize in South Africa.
DOMESTIC MARKET OVERVIEW
Safex maize prices also remained range-bound but firmed over the period. A marginally weaker rand provided limited additional support to local prices, while ample domestic maize supplies continue to cap further upside.
Sources: https://www.grainsa.co.za/upload/report_files/Maize_Monthly_Market-Report_2026.09.29.pdf
Fraud risk
FRAUD AWARENESS
Protect yourself against credential stuffing
Credential stuffing is a growing cyber threat that occurs when criminals use usernames and passwords stolen from previous data breaches to gain unauthorised access to other accounts. The attack is successful because many people reuse the same password across multiple websites, applications, and online services. Once a password is exposed in one breach, attackers use automated software and bots to test those credentials across thousands of other platforms.
Although the success rate of individual login attempts is relatively low, attackers can test millions of credentials in a short period, making credential stuffing highly effective. A compromised account can provide access to personal information, financial data, company systems, or other sensitive information that can be used for fraud, identity theft and phishing attacks.
Cybercriminals often obtain stolen credentials from data breaches, public data dumps, or criminal marketplaces on the dark web. Sophisticated tools enable them to bypass traditional security measures and make login attempts appear legitimate, making these attacks difficult to detect. Many well-known organisations worldwide have been affected by credential stuffing incidents, highlighting the widespread nature of this threat.
How to protect yourself
Employees play a critical role in preventing credential stuffing attacks. You can significantly reduce your risk by:
- Using a unique password for every account
- Enabling Multi-Factor Authentication (MFA) wherever available
- Using a reputable password manager to generate and store strong passwords
- Avoiding the reuse of work passwords on personal accounts
- Changing passwords immediately if you become aware of a data breach affecting one of your accounts
Key takeaway
A strong password alone is not enough if it is used on multiple accounts. By using unique passwords and enabling MFA, you can greatly reduce the risk of becoming a victim of credential stuffing and help protect both your personal information and organisational assets.
Fraud awareness tip: If you receive an unexpected authentication prompt, password reset notification, or login alert, do not ignore it. These may be early warning signs that someone is attempting to access your account using stolen credentials
Source
https://www.cloudflare.com/learning/bots/what-is-credential-stuffing/
https://www.fortinet.com/resources/cyberglossary/credential-stuffing